Introduction
ThingsBoard offers a powerful feature – the ability to create and customize interactive visualizations, also known as dashboards. These dashboards are instruments for monitoring and managing your data and devices efficiently. With ThingsBoard dashboards, users can adapt interfaces to their specific needs, making it easier than ever to inspect their IoT devices and data. What’s brilliant is that each dashboard can be populated with numerous widgets, offering flexibility and customization. These dashboards aren’t limited to a single data source; they can display data from various entities, including devices, assets, and more. Plus, you can assign dashboards to specific Customers, ensuring that the right individuals or teams have access to the data they need.
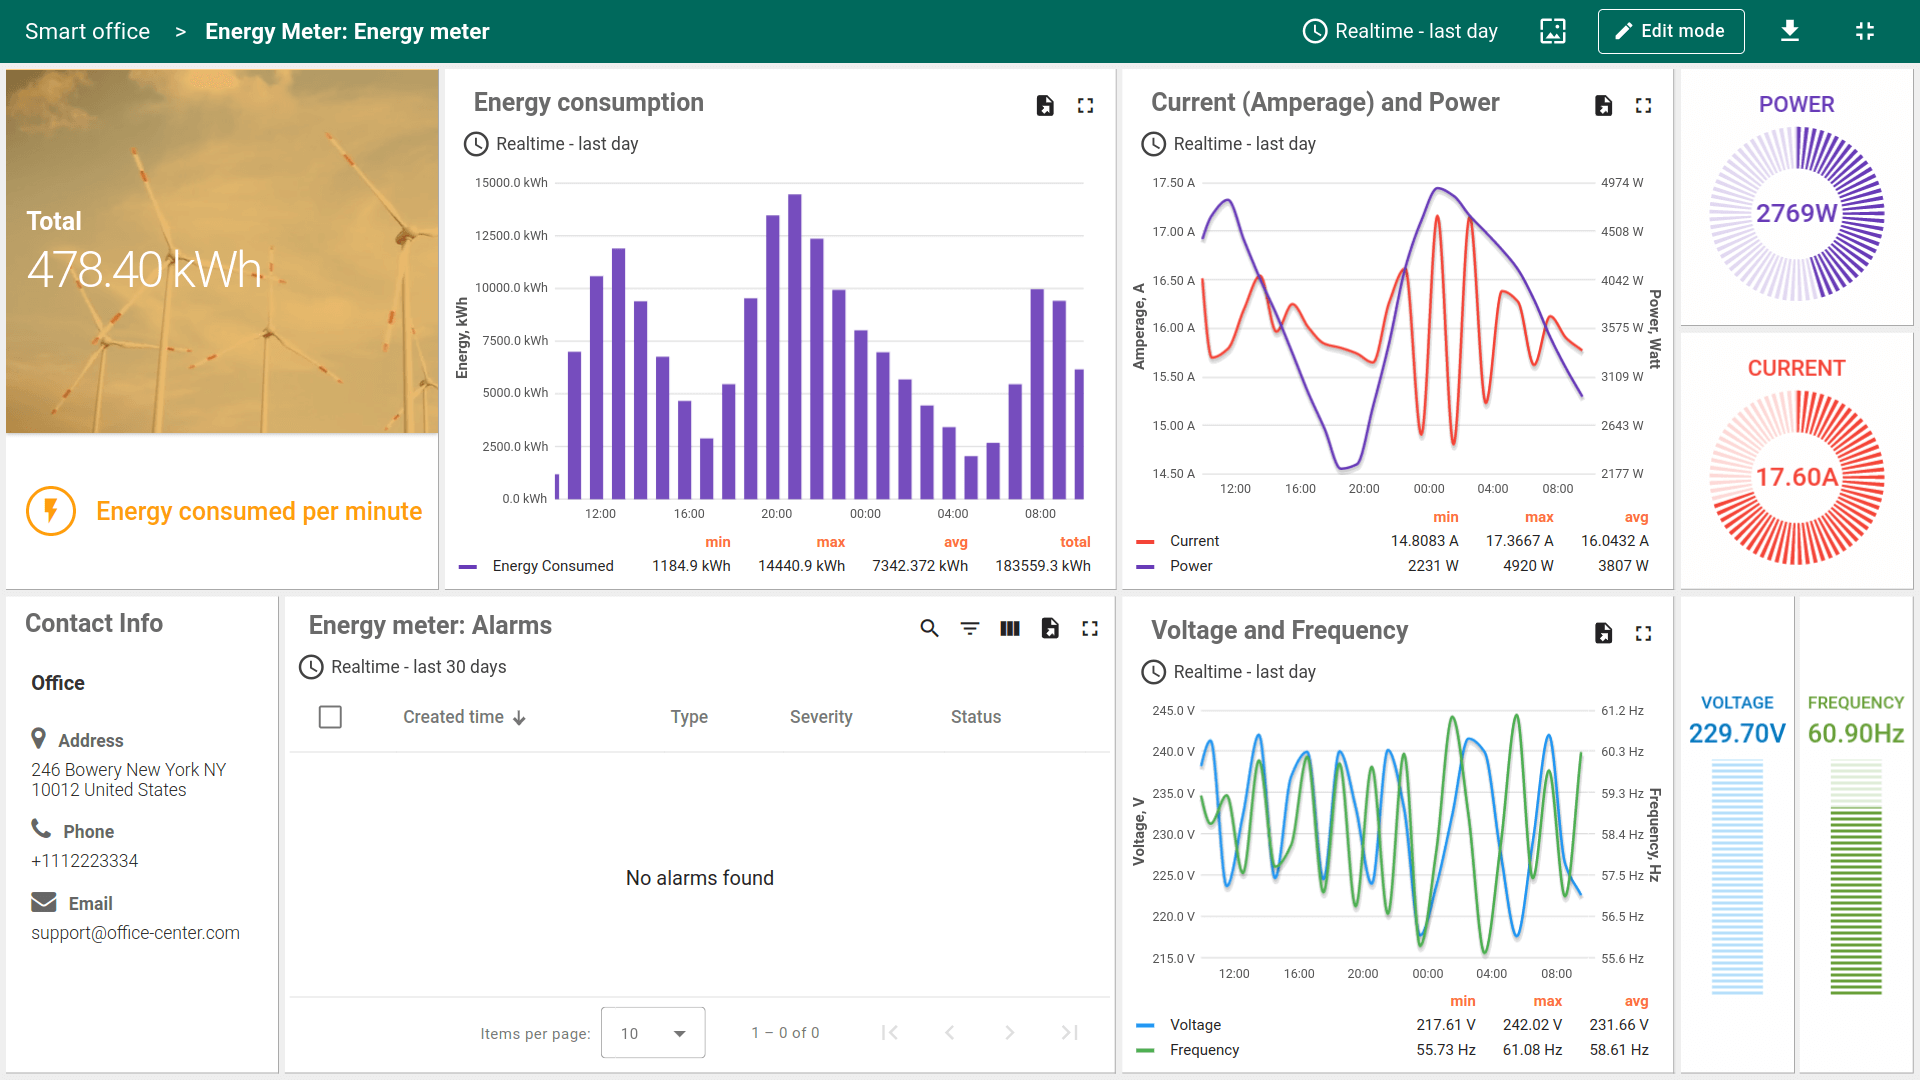
Dashboards in ThingsBoard provide users with the following capabilities:
-
Data Visualization: Users can create various widgets such as charts, graphs, tables, and more to visualize data obtained from connected devices. This enables operators and analysts to easily analyze information and track device statuses.
-
Device Management: Dashboards can be used to perform management operations on devices, such as turning devices on or off, changing parameters, and so on. Users can set actions and respond to real-time data from devices.
-
Interactivity: Dashboards can be designed with interactive elements such as buttons, switches, allowing users to interact with devices and data.
-
Display Customization: Users can customize the arrangement and size of widgets, choose color palettes, fonts, and other visualization aspects to create a user-friendly and informative interface.
-
Role-Based Access: ThingsBoard allows controlling access to dashboards with different levels of privileges based on user roles. This ensures data security and confidentiality.
ThingsBoard also offers convenient IoT solution templates to reduce time-to-market for your IoT products. These templates include interactive dashboards, processing logic, sample devices, users, and all other necessary entities. Think of these templates as a complete PoC/MVP. Read more about solution templates here.
This guide covers main concepts and various dashboard settings.
Create new dashboard
To add a new dashboard, you should:
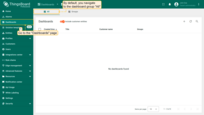
- Login to your ThingsBoard instance and navigate to the "Dashboards" page through the main menu on the left of the screen. By default, you navigate to the dashboard group "All";
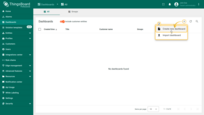
- Click the "+" sign in the upper right corner of the screen, and select "Create new dashboard" from the drop-down menu;
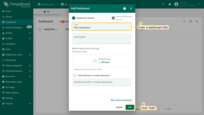
- In the opened dialog, it is necessary to enter a dashboard title, description is optional. Click "Add";
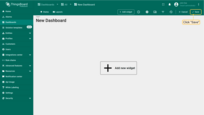
- Once you have created the dashboard, it will be automatically opened. Save it by clicking the "Save" button in the upper right corner.
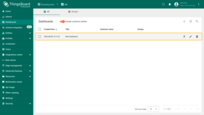
- Your first dashboard has been successfully created. As you continue to add new dashboards, they will appear at the top of the list. This default sort is based on the creation timestamp.
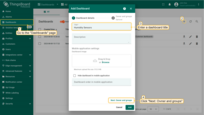
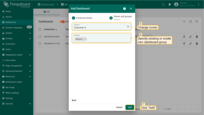
At the stage of creating a dashboard, you can specify it to a different owner and a specific dashboard group right away. How to create a new group of dashboards, read here.
- In the "Add Dashboard" dialog, enter the dashboard title, and then click "Next: Owner and groups";
- Change the owner and select an existing dashboard group or create a new one, then click "Add";
- The created dashboard is located in the "Sensors" dashboard's group and belongs to Customer A.
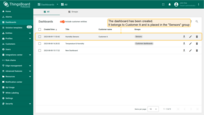
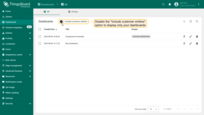
By default, the list of dashboards displays all dashboards, including those of your customers. To view only your dashboards, disable the “Include customer entities” option.
Dashboard toolbar
Before starting working with a dashboard, get familiar with its interface to understand which features are responsible for what actions.
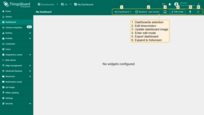
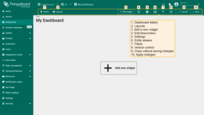
The dashboard toolbar allows you to add new widgets, manage states, layouts, settings, aliases, filters, version control, generate report from dashboard, and configure time window using the corresponding icons in the toolbar.
Some of these icons (states, layout, settings, entity aliases, filters, version control, add new widget) are visible only in the “Edit” mode. All other icons are visible in both “View” and “Edit” modes. You can hide these icons or configure the toolbar to be minimized by default using settings.
Edit mode
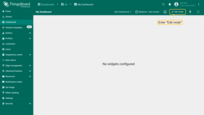
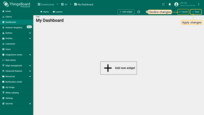
To enter dashboard edit mode, simply open the dashboard you wish to edit and click the “Edit mode” button found in the upper right corner of the screen.
Once you’ve switched to edit mode, you access the dashboard toolbar to add new elements and access controls. Don’t forget to save your changes using the “Save” button, or if you decide to discard any unsaved edits, you can do so by clicking the “Cancel” button.
Add new widget
All IoT dashboards are constructed using ThingsBoard widgets. A widget is an element that displays a specific type of information or functionality on a dashboard. Widgets are used to visualize data, remote device control, alarms management, and display static custom HTML content.
To add a widget to a dashboard, you should:
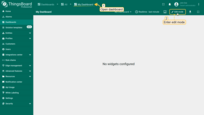
- Open your dashboard and switch to Edit mode;
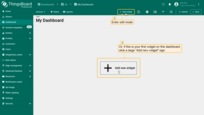
- Click the + Add widget at the top of the screen. If this is your first widget on the dashboard, you can also click Add new widget in the center of the screen to open the Widget bundle dialog;
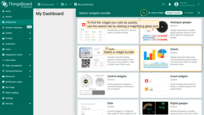
- Choose a widget bundle (for example, Charts). To quickly find your desired widget, use the search bar by clicking the magnifying glass icon and entering the widget's name;
- Select a widget (for example, Time series chart) to open the Add widget dialog;
- Specify the data source, add at least one data key, and click Add. Then Apply changes.
- The widget is now created.
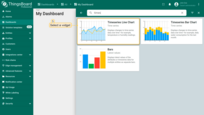
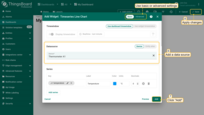
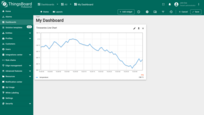
Each widget typically has specific settings and parameters that allow users to customize its behavior and appearance according to their needs. For more information about widgets, how to create them, and their settings, click the button below:
Time window
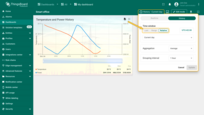
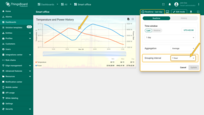
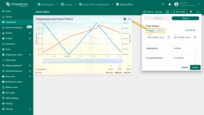
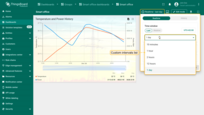
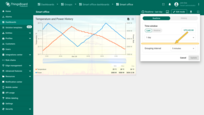
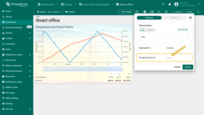
The Time window is a tool used to define time intervals when working with telemetry data. The time window is used by all time series and alarm widgets unless they are configured to use their own widget time window. In the case of a time series widget, ThingsBoard fetches telemetry with a timestamp that matches the time window. In the case of an alarm widget, ThingsBoard fetches alarms with the created time that matches the time window.
The time window can work in two modes:
- In the real-time mode, widgets constantly receive updates from the server and automatically show you only the data that matches the time window for a current timestamp;
- In the history mode, widgets receive data only during the initial load and no updates are issued over WebSockets.
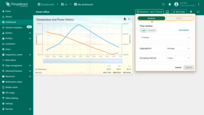
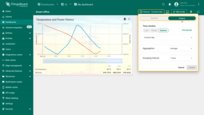
Key parameters of the time window:
- Last: Displays real-time data for a specified time interval (e.g., the last 5 minutes, the last hour, or the last 24 hours).
- Range: Displays data for a fixed period, such as from December 1, 2024, to December 7, 2024.
- Relative: Uses predefined intervals, such as the current day, the previous day, or the previous month.
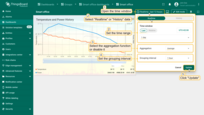
To display data for your desired time period, set the time range in the time window and click “Update”.
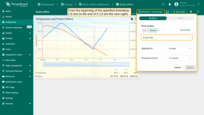
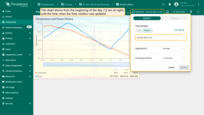
Aggregation
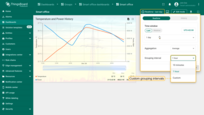
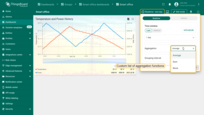
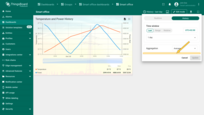
The data aggregation function is applied to time series data and does not apply to alarms. Currently, six aggregation functions are available:
- Min: Identifies the smallest value among all data in the selected time interval. Useful for displaying the minimum value, such as the lowest temperature recorded in an hour.
- Max: Identifies the largest value among all data in the selected time interval. This is useful for displaying the maximum value, such as the highest energy consumption level.
- Average: Calculates the arithmetic mean of all data in the selected interval. Useful for analyzing average metrics, such as the average humidity over a day.
- Sum: Computes the total sum of all values in the selected time interval. This can be helpful for calculating the total volume of water or electricity consumed.
- Count: Counts the number of records in the selected interval. Useful for assessing the volume of data received or to count the number of events.
- None: Transmits raw data without applying any aggregation functions. Used when access to each unaltered value is required.
Data aggregation is useful when you do not want to retrieve all raw time series data to the user interface but prefer to pre-aggregate it at the database level.
Using aggregation functions helps save network bandwidth and reduces the computational load on the client’s browser. We recommend using aggregation functions whenever possible, especially when dealing with a large amount of raw data points.
Grouping interval
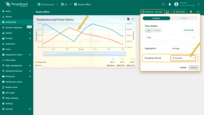
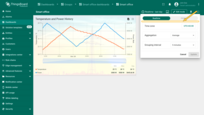
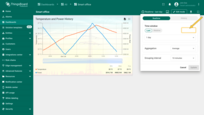
Group time series values by the specified time interval. This enables data analysis within a defined period and provides a more structured and convenient approach to handling large volumes of data.
For example, if a device sends temperature data every 10 minutes, but you need hourly average values, set the grouping interval to 1 hour and use the “Average” aggregation function. This will provide the desired result without additional processing on the client side.
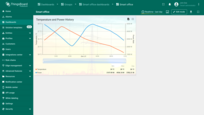
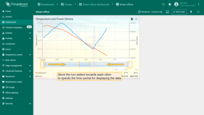
There are times when the time intervals are long, and you’d like to see the data closer without changing timestamps, therefore, you need to zoom in. Move the two sliders towards each other to specify the time period for displaying the data. To zoom out to the original size of the chart, move the sliders back to their default position.
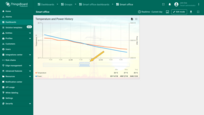
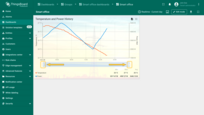
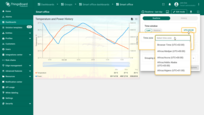
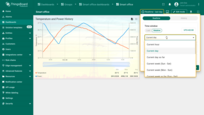
The ThingsBoard introduces time zone configurations. By default, the dashboard uses the time zone provided by the browser. Now it is possible to set the time of your browser or a specific country. To quickly find the needed time zone, start typing its name in the time zone bar.
Time window settings
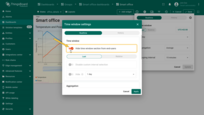
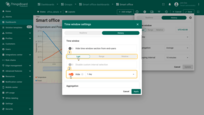
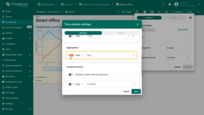
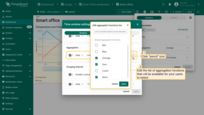
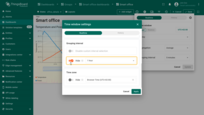
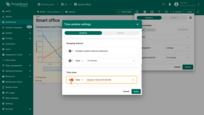
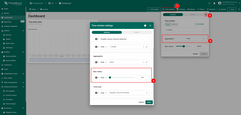
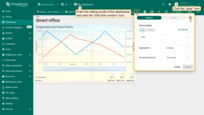
You can customize the time window for the end-user by hiding certain configuration elements. Enter the editing mode of the dashboard, click the “edit time window” icon on the dashboard toolbar. In the popup window, click the “gear” icon. The time window configuration window will open.
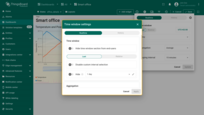
Here, you can perform the following configurations:
For time window:
- Hide the time window section from end-users: Users will not be able to change the set time interval.
You can also hide the “Last”, “Range” (History) or “Relative” intervals from end-users.
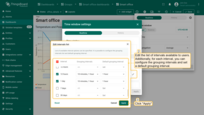
Edit the list of intervals available to users. Additionally, for each interval, you can configure the grouping intervals and set a default grouping interval.
For aggregation function:
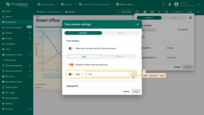
- Hide the aggregation from end-users: Users will not be able to change or disable the aggregation function you set during configuration.
You can edit the list of available aggregation functions. List the available aggregation functions for the end-user.
For grouping interval:
- Hide the grouping interval from end-users: Users will not be able to change the grouping interval set during configuration.
- Hide the time zone from end-users: Restrict users from changing the timezone.
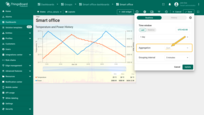
Available only when Aggregation is None:
- Max values: Limits the number of data points rendered in time-series widgets within the selected time window.
Filters
Entity filters allow you to specify a filter for the list of entities resolved by the entity alias.
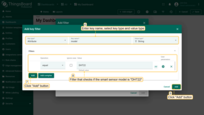
Let’s look at an example. Suppose you have thousands of “Thermometer” devices, and you would like to display thermometers of a specific model and with certain battery levels. Let’s also assume that thermometer model is stored as an attribute, and the battery level is stored as a time series data. We will define a filter that checks if the sensor model is “DHT22” and the battery level is less than 20 percent.
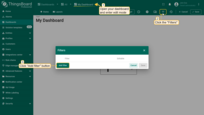
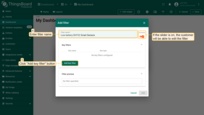
- Open your dashboard, enter edit mode and click the "Filters" button in the upper right corner of the dashboard window. In the pop-up window click "Add filter" button;
- In the pop-up window click "Add key filter" button;
- Enter key name, select key type and value type. Then add a filter that checks if the sensor model is "DHT22" and click "Add";
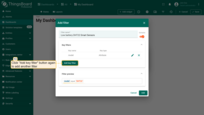
- Add another key filter;
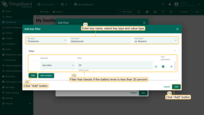
- Add filter that checks if the battery level is less than 20 percent;
- Click "Add" button to add new filter;
- Click "Save" and apply all changes.
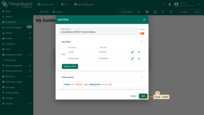
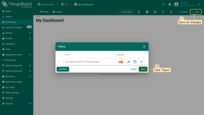
Filters are applied only to the “latest” value of the attribute or time series key. Don’t use this feature to “filter out” historical time series values.
You can combine different logical expressions over one key using “complex” filters. For example: “(A > 0 and A < 20) or (A > 50 and A < 100)”. Also, you can combine two expressions for different keys using the “and” relation. For example: “(A > 0 and A < 20) and (B > 50 and B < 100)”. It’s not possible to use “or” in relation to combining different keys yet. For example: “(A > 0 and A < 20) or (B > 50 and B < 100)”.
See more examples of how to use filters in this video:
Entity aliases
Entity Aliases determine which entities (devices, assets, etc.) you would like to display on the dashboard. An alias can be thought of as a reference to one or more devices. These references can be static or dynamic.
An example of the static alias is the Single entity alias. An entity is configured once in the alias dialog box. All users see the same data if they have permission to access this device.
An example of a dynamic alias is the Device type alias, which displays all devices of a certain type (e.g. “Thermometer”). This alias is dynamic because the list of devices depends on the user using the dashboard. If you are logged in as a Tenant administrator, this alias will be allowed for all Thermometer devices. However, if you are logged in as a Customer user, this alias will be resolved to Thermometer devices that are assigned/owned by that Customer.
Let’s create a dynamic alias, which displays all devices of a certain “Smart sensors” type.
- To add an alias, open your dashboard and enter edit mode. Then, in the upper right corner, locate the "Entity aliases" button and click it. A pop-up window will appear, where you should click the "Add alias" button;
- In the new pop-up window, fill in the alias name, select the filter type and device type, and then click the "Add" button;
- Click "Save" button to save the alias and all changes.
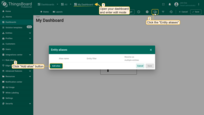
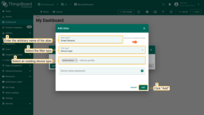
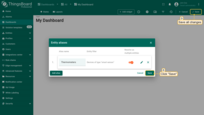
Please see the Entity aliases documentation for more information.
Settings
Dashboard settings allow adjusting and altering the overall look of the Dashboard. You can change the title, logo, and customize the toolbar.
To start customizing the Dashboard enter Edit mode, then click the “gear” icon in the upper right corner of the dashboard window to open the dashboard settings window.
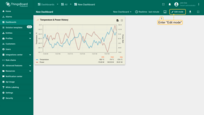
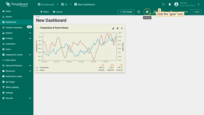
Title settings
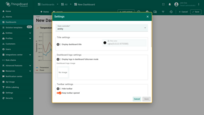
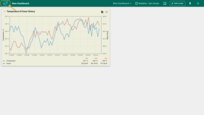
If you want the Title to be displayed on the dashboard, you need to enable the “Display dashboard title” checkbox. The default text color is black. Color and transparency are easily adjusted using the Title color parameter by clicking the colored circle and choosing the desired color for the title by moving the slider. The changed title appears on the top left of the Dashboard.
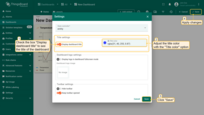
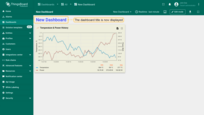
Dashboard logo settings
You can set dashboard logo which displayed in dashboard fullscreen mode. For this, check the box “Display logo in dashboard fullscreen mode” and add dashboard logo image.
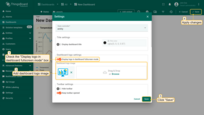
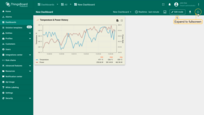
Toolbar settings
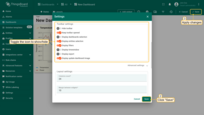
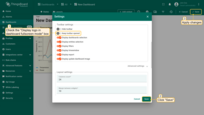
The checkboxes “Display dashboard selection”, “Display entities selection”, “Display filters”, “Display time window”, “Display export” and “Display update dashboard image” are responsible for the visibility of the appropriate options on the Dashboard toolbar panel.
The “Display filters” option is shown on the toolbar panel only if at least one filter has been created. If the filter was created, but you’d like to limit the customer’s opportunity to modify the device’s indicators, we disable the ability to see filters on the toolbar panel by unchecking the corresponding checkbox.
You can display/hide toolbar icons. Let’s hide “Display dashboards selection”, “Display time window” and “Display export” icons on the dashboard page.
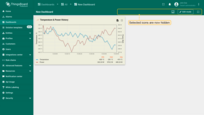
The “Hide Toolbar” option will hide the toolbar from the dashboard page. Instead of it, on the upper right of the screen, you will find “Enter edit mode” icon.
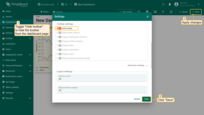
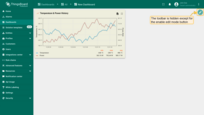
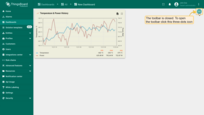
The “Keep toolbar opened” option is responsible for displaying the toolbar on the dashboard page. If we disable it, the toolbar will be closed. Instead of it, on the upper right of the screen you find the three-dots icon. By clicking on it, the hidden toolbar will be opened.
Layouts
Layouts determine how widgets will be displayed and organized on the dashboard grid. Read more about layouts in a separate documentation.
States
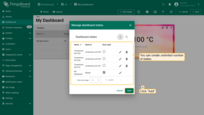
The States feature exists to create a layered hierarchy in your Dashboard. To use States properly, you need to assign a specific action to a widget that will help you fast “travel” among the required states. To do this, you should enter edit mode and click the button two-layered squares “Manage dashboard states” in the upper left corner of the dashboard window. The Manage dashboard states configuration window will open.
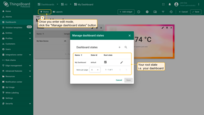
Since you haven’t created any states yet, you have only your “Root state”, namely your Dashboard. Root state defines the main state of your hierarchy. After creating additional states, you easily can change a root state by clicking the “Pencil” icon (Edit dashboard state) and selecting the “Root state” checkbox.
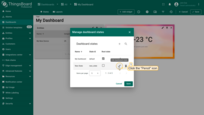
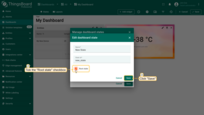
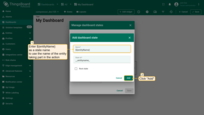
To add a new state, you need to click on the “+” icon in the right upper of the window, it will open the Add dashboard state window. Assign a name, and the State ID will automatically generate based on that name, though you have the option to modify it. Click “Add” and then save all changes.
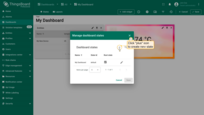
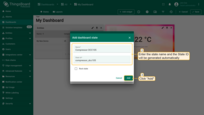
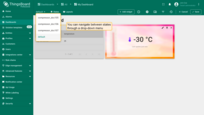
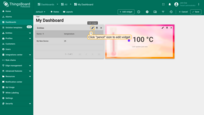
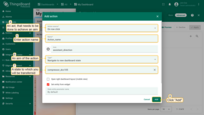
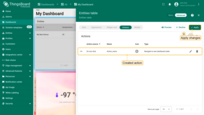
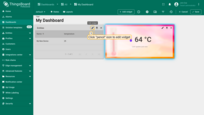
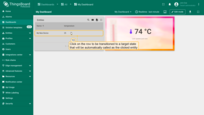
Giving a corresponding action to a particular widget allows traveling between states. To add an action, you should click the “pencil” icon (Edit widget) in the upper right corner of the widget to enter the widget configuration mode. There you need to navigate to the “Action” tab and click the “+” icon to add a new action.
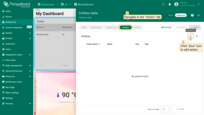
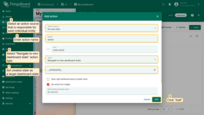
It will open the “Add action” window.
- The Action source is a particular act that needs to be done to achieve an aim.
- The Name means a preferred title to an action.
- The Icon defines a symbol for action.
- The Type determines an aim of the action.
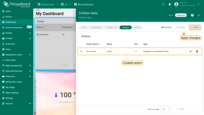
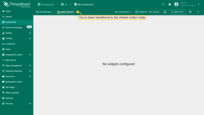
In our case, a Type should be “Navigate to new dashboard state”. After choosing this option, the line “Target dashboard state” will appear, where we have to choose a newly created state. When the configuration for a new action is done, click the “Add” button. The new action appears in the actions list. Click the “Apply” button at the upper right of the window to apply changes.
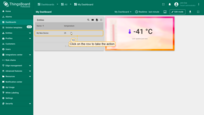
As we have chosen the “On row click” action, we need to click on the row of our widget to bring the action into effect. After clicking, we immediately transfer to the chosen state.
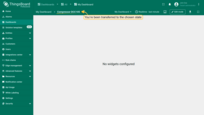
For the state to be named after the entity, use ${entityName} as the name of the state. Thus during the action, you will be transitioned to a state that is called the same as the entity that took part in the action.
Generate report from dashboard
A Tenant Administrator or Customer User can generate a report from the currently opened dashboard in PDF, PNG, or JPEG format.
- Click the “Export Dashboard” button, located on the right side of the dashboard toolbar.
- In the expanded drop-down menu, select the desired export format.
- The report generation process will start automatically.
And finally, the report file will be automatically downloaded and saved to your PC.
Generate dashboard report by schedule
Report generation can also be automated on a schedule using the event scheduler with the “Generate Dashboard Report” event type.
Managing dashboard
With your dashboards, you can perform operations such as export dashboard in the JSON format, share dashboard group, make dashboard group public, edit dashboard and delete dashboard using the corresponding icon next to the dashboard.
Let’s look at each operation.
Export dashboard
In the ThingsBoard you can export a dashboard as a configuration file in JSON format. You can use this file to transfer your Dashboard or widget configuration to another instance.
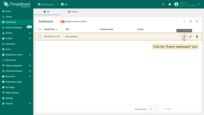
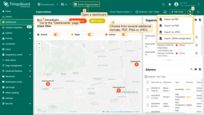
To export a dashboard, go to the “Dashboards” page. Find the dashboard you want to export in the list and click on the “Export dashboard” button located next to the dashboard’s name. The configuration file in JSON format with all settings on the control panel will be saved on your PC.
To export the dashboard directly from the toolbar, open the dashboard and click the “Export dashboard” button in the upper right corner of the screen and select “Export JSON configuration”. The dashboard is exported to the configuration file in JSON format.
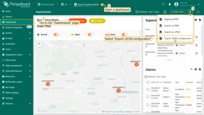
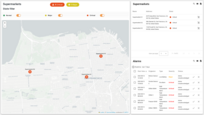
Dashboard export is also possible in several additional formats: PDF, PNG or JPEG. This is useful when you need to send the data displayed in your dashboard by email or print.
Import dashboard
You can import a dashboard from a JSON configuration file. This can be useful when you are migrating your dashboard configuration from another instance.
To import a dashboard, follow these steps:
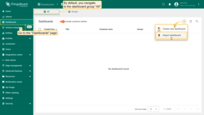
- Go to the "Dashboards" page and click on the "+" button in the upper right corner of the page and select "Import dashboard" from the drop-down menu;
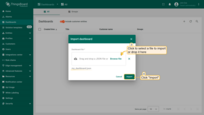
- In the import dashboard window, upload the dashboard configuration JSON file and click "Import";
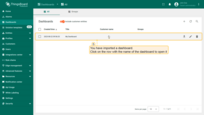
- You have imported a dashboard. Open it;
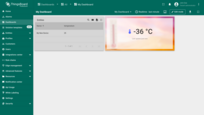
- As you can see, your dashboard has been imported along with all of its widgets.
Manage dashboard owner and groups
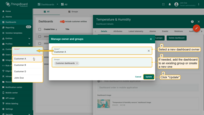
You can change the dashboard owner to ensure that only users associated with the selected customer have access to the dashboard.
Note: This step is essential for maintaining strict access control. Each customer user will only have access to the data explicitly granted to them.
Keep in mind that granting access to a dashboard gives the customer access only to the dashboard itself, not to the data displayed on it. For the widgets to display data, the customer must also be granted access to the corresponding devices or other entities.
Changing the dashboard owner:
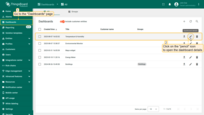
- Open the dashboard details by clicking the “pencil” icon in the dashboard list.
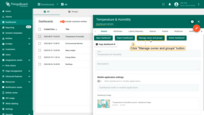
- Click the “Manage owner and groups” button.
- Select a new dashboard owner from the list. If needed, add the dashboard to an existing group or create a new one.
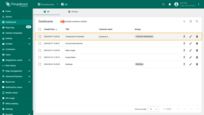
- Confirm the changes to update the owner information.
In the “Customer name” column, you can see the current owner of the dashboard.
Note: A Tenant Administrator always has the right to reassign or revoke dashboard ownership.
Include customer entities
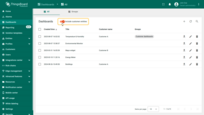
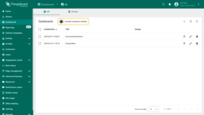
The “Include customer entities” option on the “Dashboards” page determines whether dashboards owned by customers are shown or hidden in the list.
- When the switch is enabled (default state) — the table shows all available dashboards, including those owned by customers.
- When the switch is disabled — the table shows only your own dashboards (excluding customer dashboards).
Share dashboard group
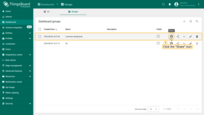
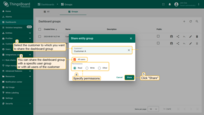
You can share a dashboard group with your customers, granting them permissions such as “Read”, “Write”, or using a previously created role. Roles are sets of permissions that define what actions users can perform. For more information about roles read here.
To share a dashboard group, follow these steps:
- Go to the "Dashboards" page and navigate to the "Groups" tab. Click the "Share" icon next to the dashboard group that you want to share;
- Select the customer to which you want to share the dashboard group. Additionally, you can share the dashboard group with a specific user group or with all users of the customer. Specify permissions and click "Share".
Make dashboard group public
You can make the dashboard group and all its dashboards public and then share links to those dashboards with other users.
For this you should:
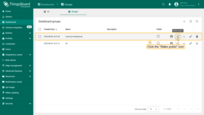
- Go to the "Dashboards" page and navigate to the "Groups" tab. Click the "Make public" icon next to the dashboard group that you want to make public;
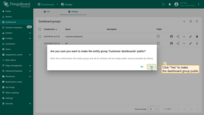
- In the confirmation dialog box, click "Yes";
- To copy the public dashboard link and share it, open public dashboard group and click the "Public dashboard link" icon opposite the needed dashboard;
- In the pop-up window, click "Copy public link" icon. You can now share the dashboard using this link, for example, by sending it via email. Or you can use the quick buttons to share the link on social networks.
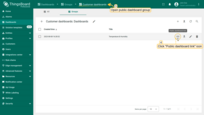
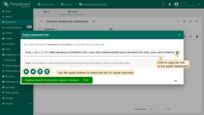
To make a dashboard private again, follow these steps:
- Go to the "Dashboards" page and select the "Groups" tab. Click the "Make private" icon next to the dashboard group that you want to make private;
- In the confirmation dialog box, click "OK".
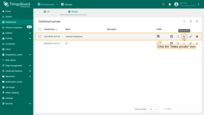
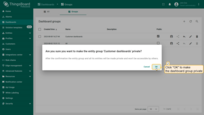
Edit dashboard
Edit the fields you need, such as the title or description of the dashboard. After making the edits, remember to save all changes. With these steps, you will have successfully updated the dashboard information.
Let’s see how to do this:
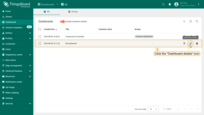
- Go to the "Dashboards" page and click the "Dashboard details" icon next to the dashboard that you want to edit;
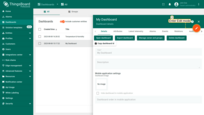
- In the "Dashboard details" window, click the "Pencil" icon to enter edit mode;
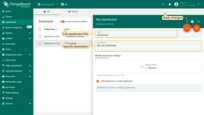
- Edit the fields you need. For example, edit the title of the dashboard, specify description. After making the edits, remember to save all changes;
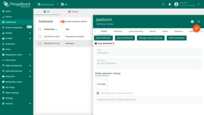
- You have updated the dashboard information.
Delete dashboard
You can delete a dashboard using one of the following ways:
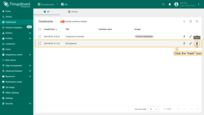
First way:
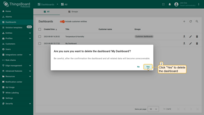
- Go to the "Dashboards" page and click the "Trash" icon opposite the dashboard`s name you want to delete;
- Confirm deleting the dashboard in the dialog box.
Second way:
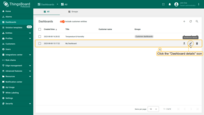
- Click the "Dashboard details" icon next to the dashboard that you want to delete;
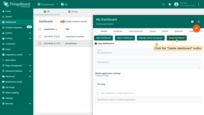
- In the "Dashboard details" window, click "Delete dashboard" button;
- Confirm deleting the dashboard in the dialog box.
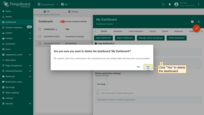
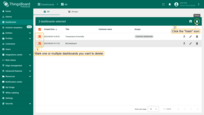
You can also delete multiple dashboards at once.
- Mark one or multiple dashboards you want to delete. Click on the "Trash" bin icon in the top right corner;
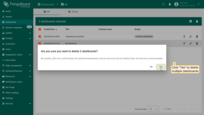
- Confirm deleting dashboards in the dialog box.
Next steps
-
Widgets - This guide contains instructions for configuring ThingsBoard widgets.
-
Data visualization - These guides contain instructions how to configure complex ThingsBoard dashboards.
-
Data processing & actions - Learn how to use ThingsBoard Rule Engine.
