This tutorial will show how to calculate total water consumption in the building based on incoming data from all water meter sensors in the building.
- Use case
- Prerequisites
- Model definition
- Message Flow
- Configuring the Rule Chains
- Validating the flow
- Next steps
Use case
Let’s assume you have buildings with multiple water meter sensors inside each building. For example, one per each apartment or similar.
In this tutorial we will configure ThingsBoard Rule Engine to automatically calculate total water consumption in the building based on readings from multiple water meters and within certain time intervals. We will use 1 building, 2 sensors and 10 seconds interval just for demo purposes. You can use this tutorial as a basis for much more complex scenarios.
Prerequisites
We assume you have completed the following guides and reviewed the articles listed below:
- Getting Started guide.
- Rule Engine Overview.
Model definition
We will create one asset that has name “Building A” and type “building”. We will add this asset to an asset group called “Buildings”.

We will create two devices that has names “Water Meter A1” and “Water Meter A2” and type “water-meter”. We will add this devices to device group called “Water Meters”.

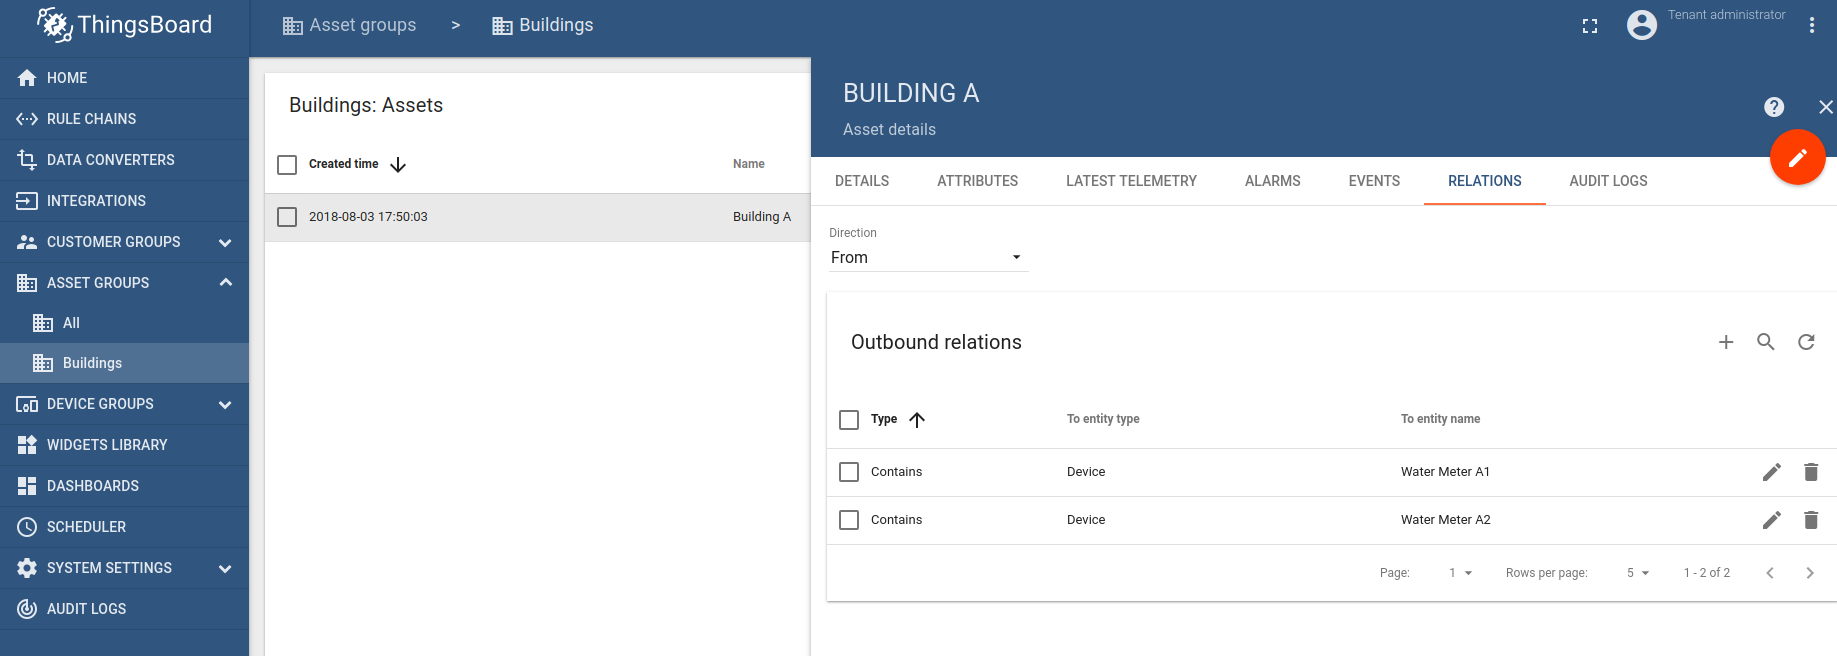
We must also create relations between the building asset and water meters. This relation will be used in the rule chain to associate water meters readings with the building itself. It is also convenient to use relations in the dashboards to provide drill-down capabilities. You may notice two outbound relations from the building asset to water meters on the screenshot below:
Note: Please review the following documentation page to learn how to create assets and relations.
Message Flow
In this section, we explain the purpose of each node in this tutorial. There will be three rule chains involved:
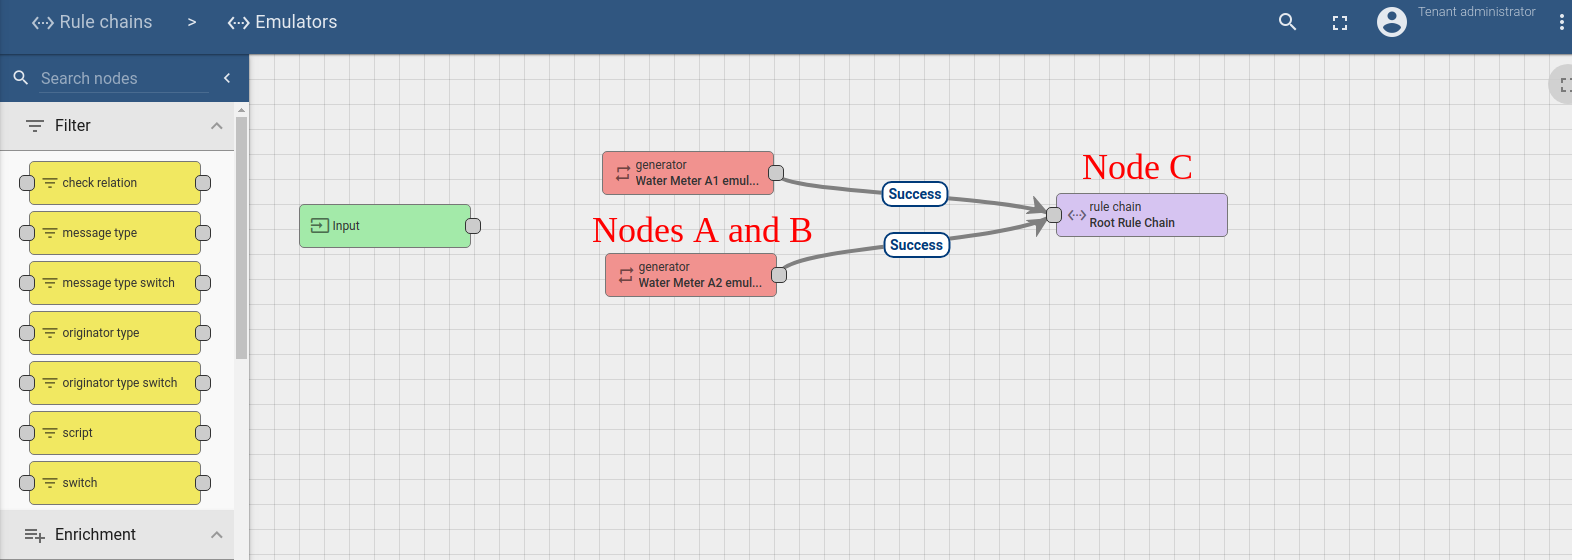
- “Emulators” - optional rule chain to simulate data from two water meters;
- “Water consumption” - rule chain that actually aggregates the water consumption readings;
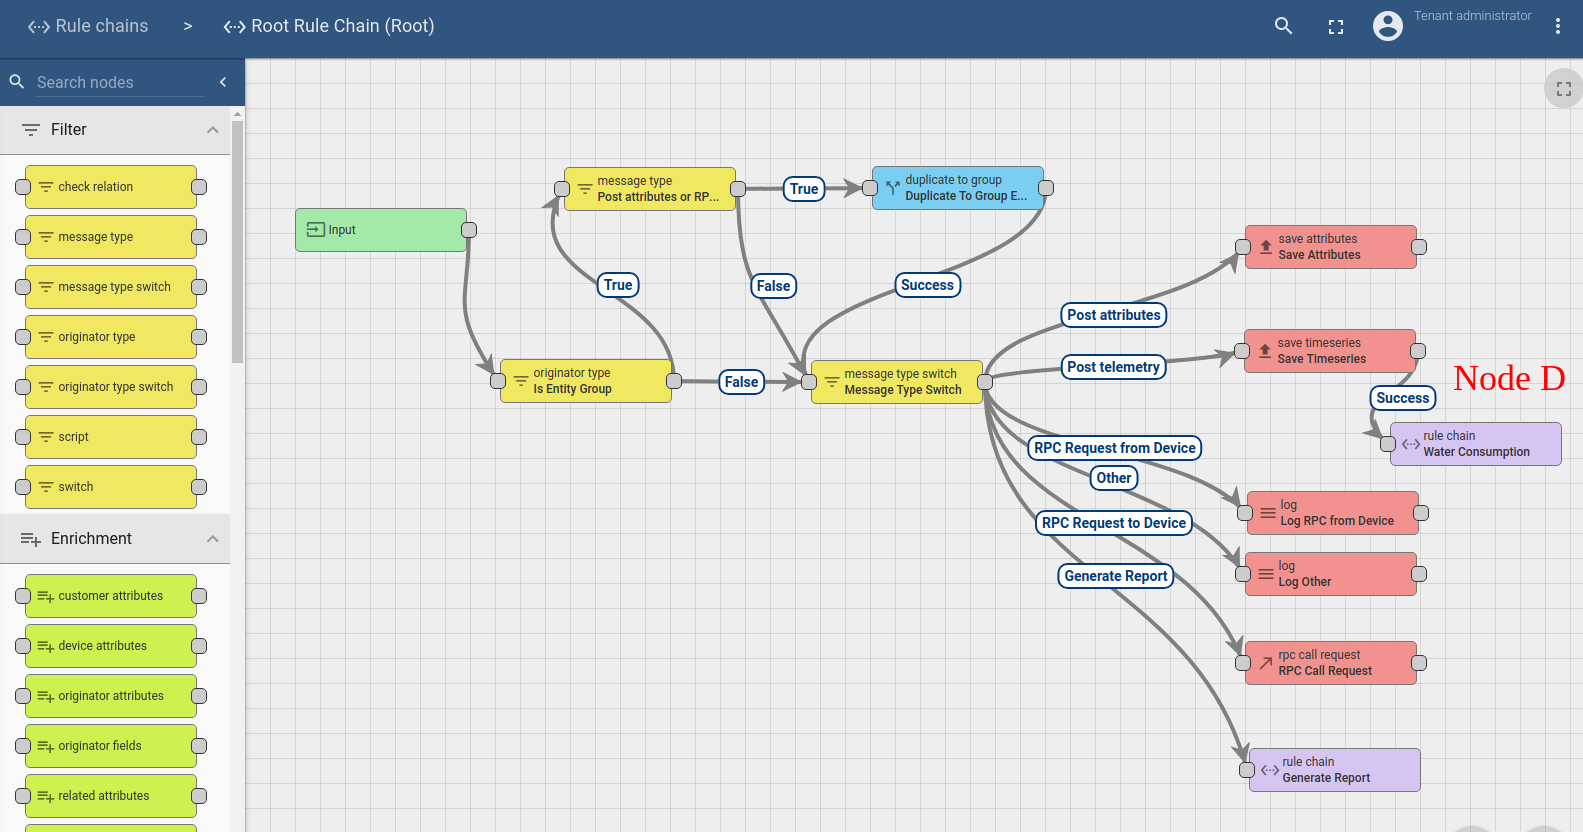
- “Root Rule Chain” - main, default, rule chain that dispatches all messages. In our case Root Rule Chain consumes data produced by “Emulators”, store them to the database and pushes to “Water consumption” rule chain for further processing.
Emulators rule chain
-
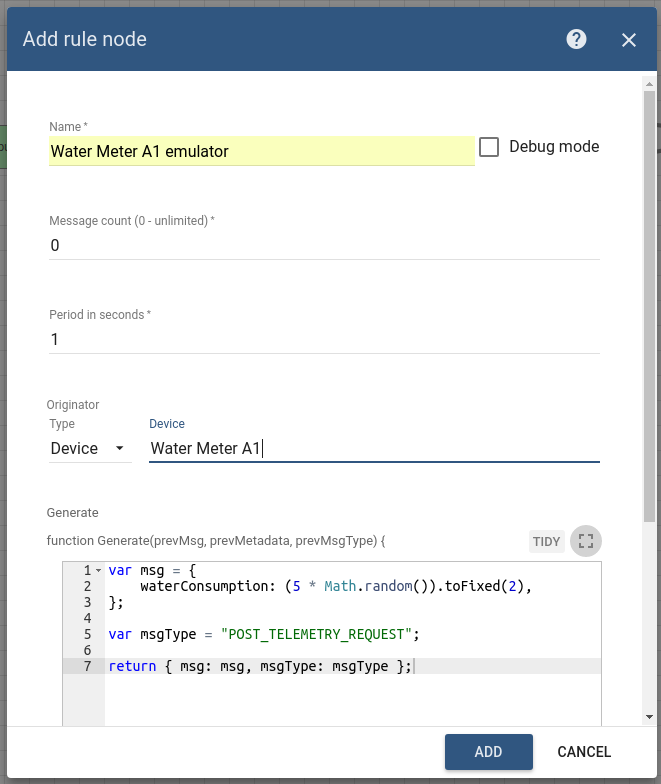
Nodes A and B: Generator nodes
- Two similar nodes that periodically generate a very simple message with random water consumption.
-
Node C: Rule Chain node
- Forwards all messages to default rule chain
Root rule chain
-
Node D: Rule Chain node
- Forwards all telemetry messages to aggregation rule chain. Please note that we intentionally do not introduce and filtering nodes to simplify the guide. Typically you should filter incoming telemetry before you forward it to more complex nodes. For example check that incoming telemetry contains water meter readings.
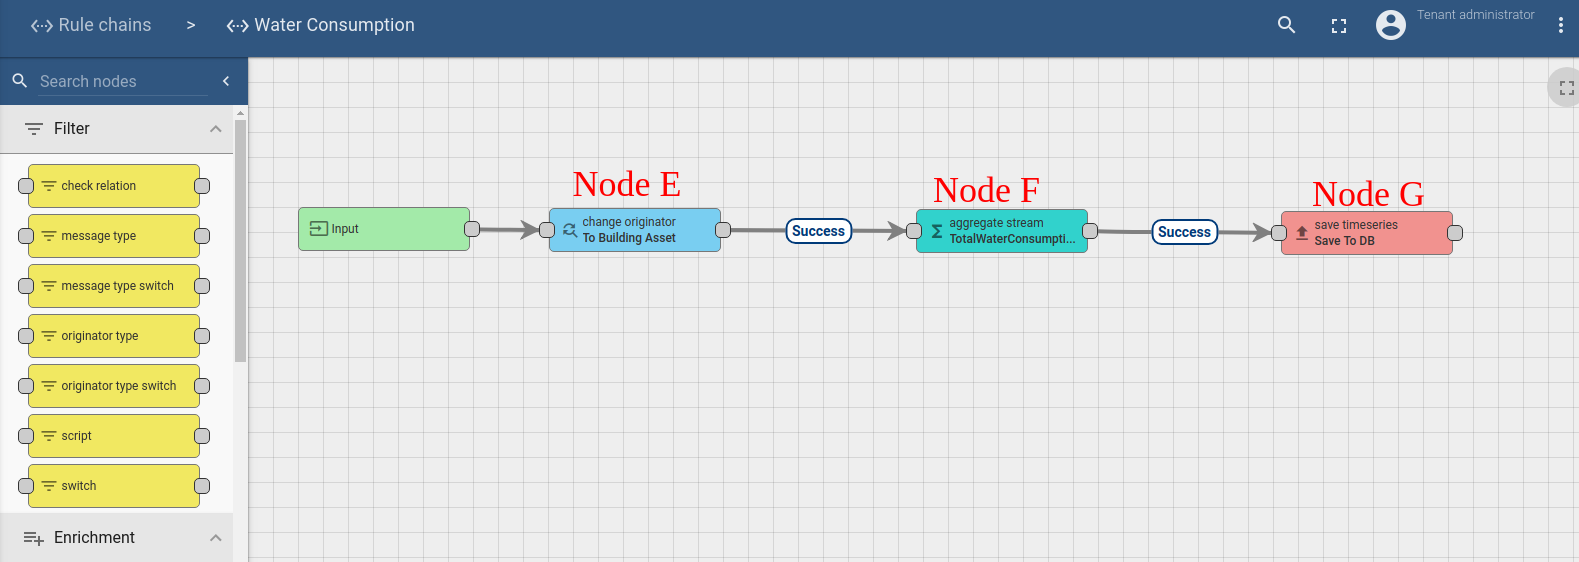
Water consumption rule chain
-
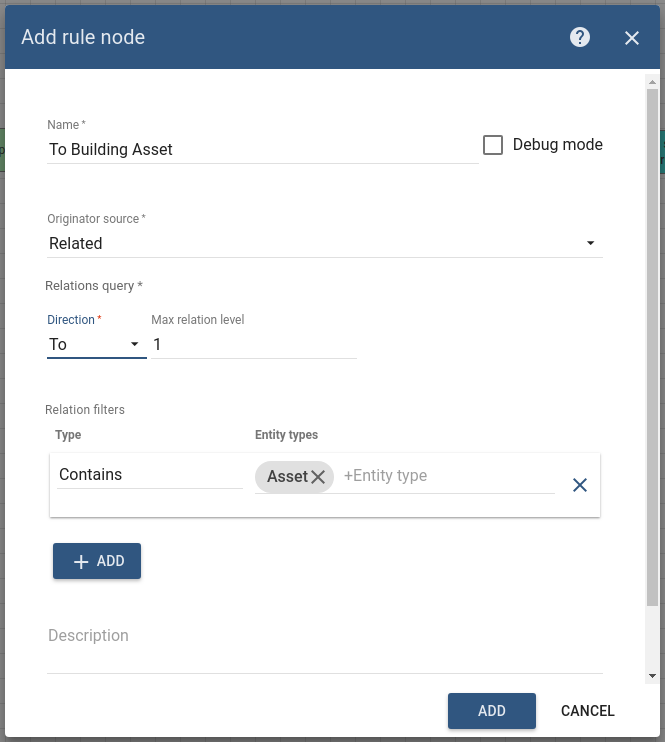
Node E: Change originator
- Updates the entity id that is associated with the message. Updates the entity id from particular water meter to the parent asset.
-
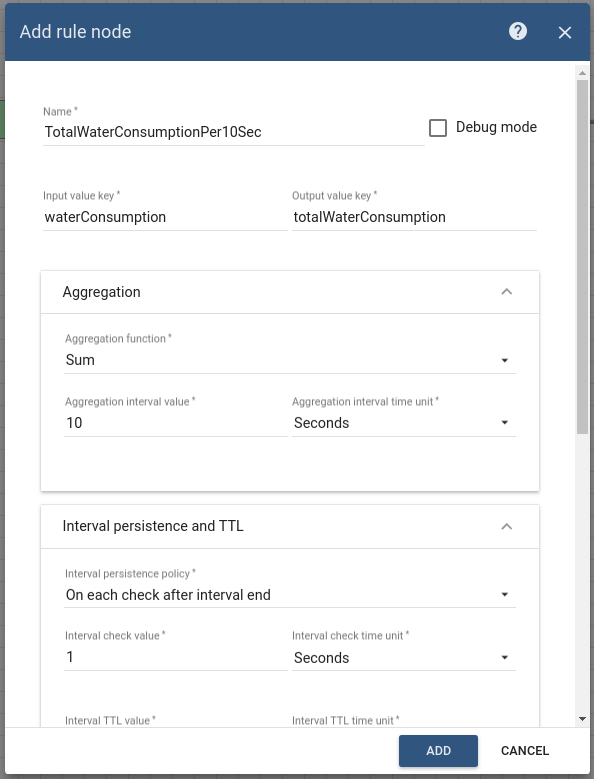
Node F: Aggregate stream node
- Transforms aggregated incoming data stream of “waterConsumption” readings to “totalWaterConsumption” value once per 10 seconds.
- Persists new telemetry after particular interval is over and on each new message that belongs to this interval afterwards. This is useful if some telemetry readings may be delayed.
-
Node G: Save telemetry node
- Simple node that stores incoming message to the database and dispatches updates to the subscribers.
Configuring the Rule Chains
Download and import attached emulators rule chain file as a new “Emulators” rule chain and attached water consumption rule chain file as a new “Water Consumption” rule chain. Please note that some nodes have debug enabled. This affects performance. Create Node C and Node D as shown on the image above in the root rule chain to forward telemetry to new rule chain.
Validating the flow
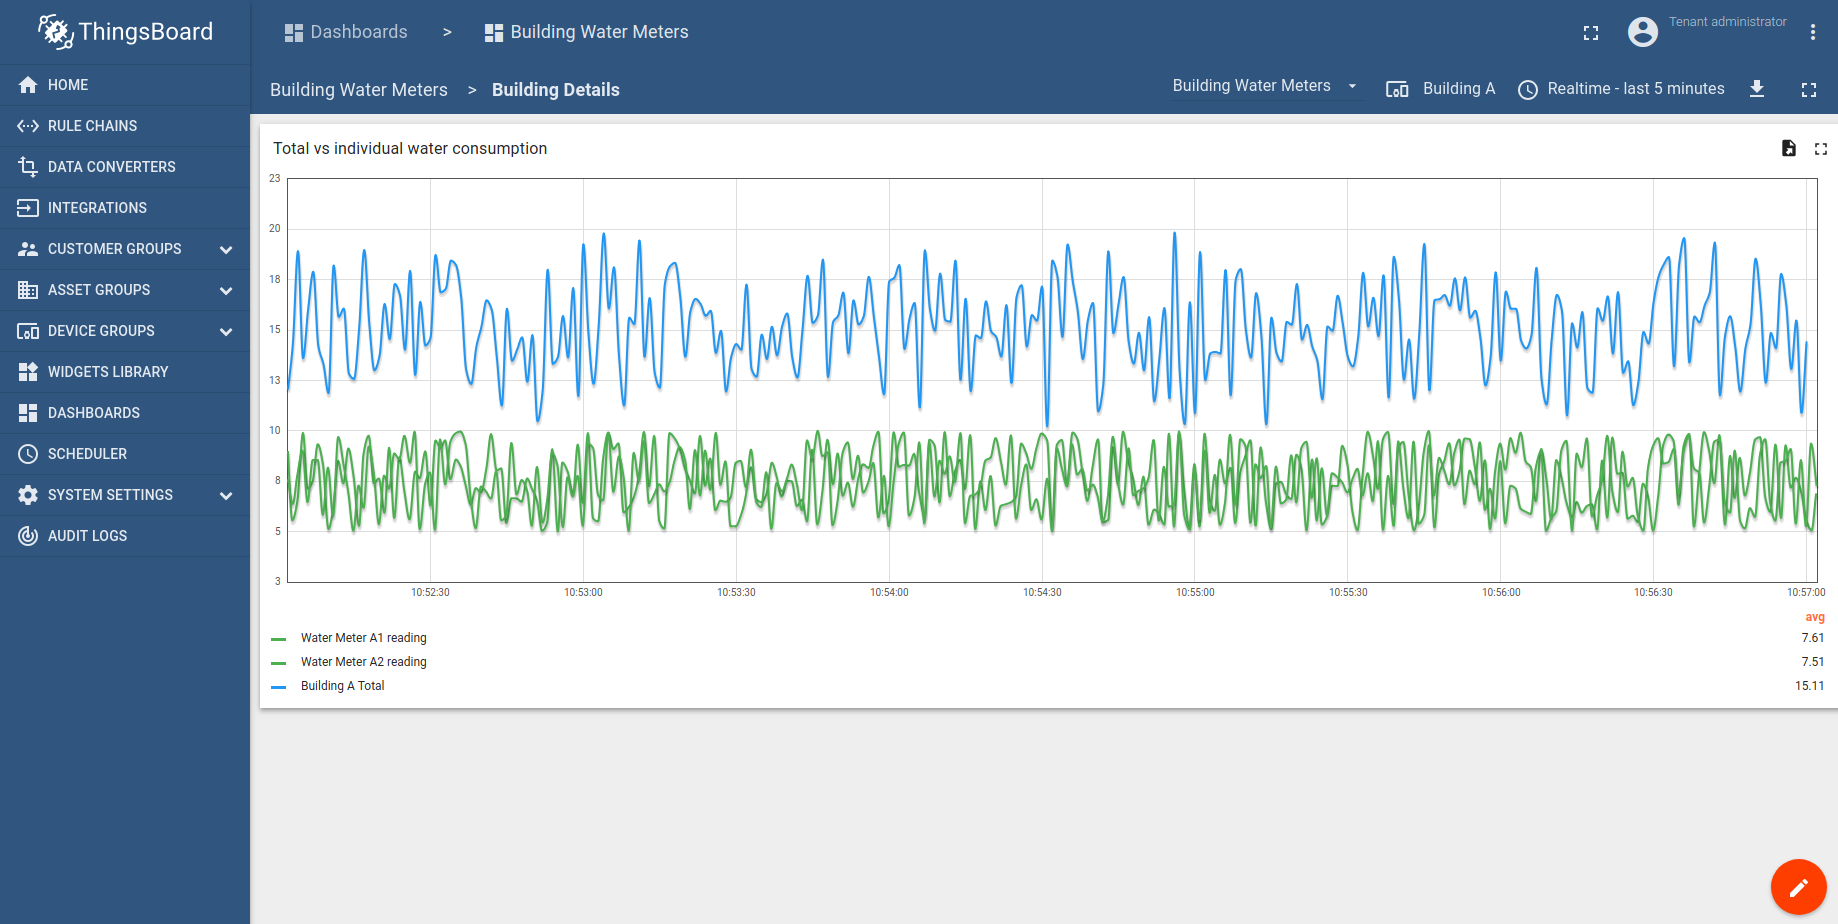
Download and import attached dashboard file as a new “Building Water Meters” dashboard.
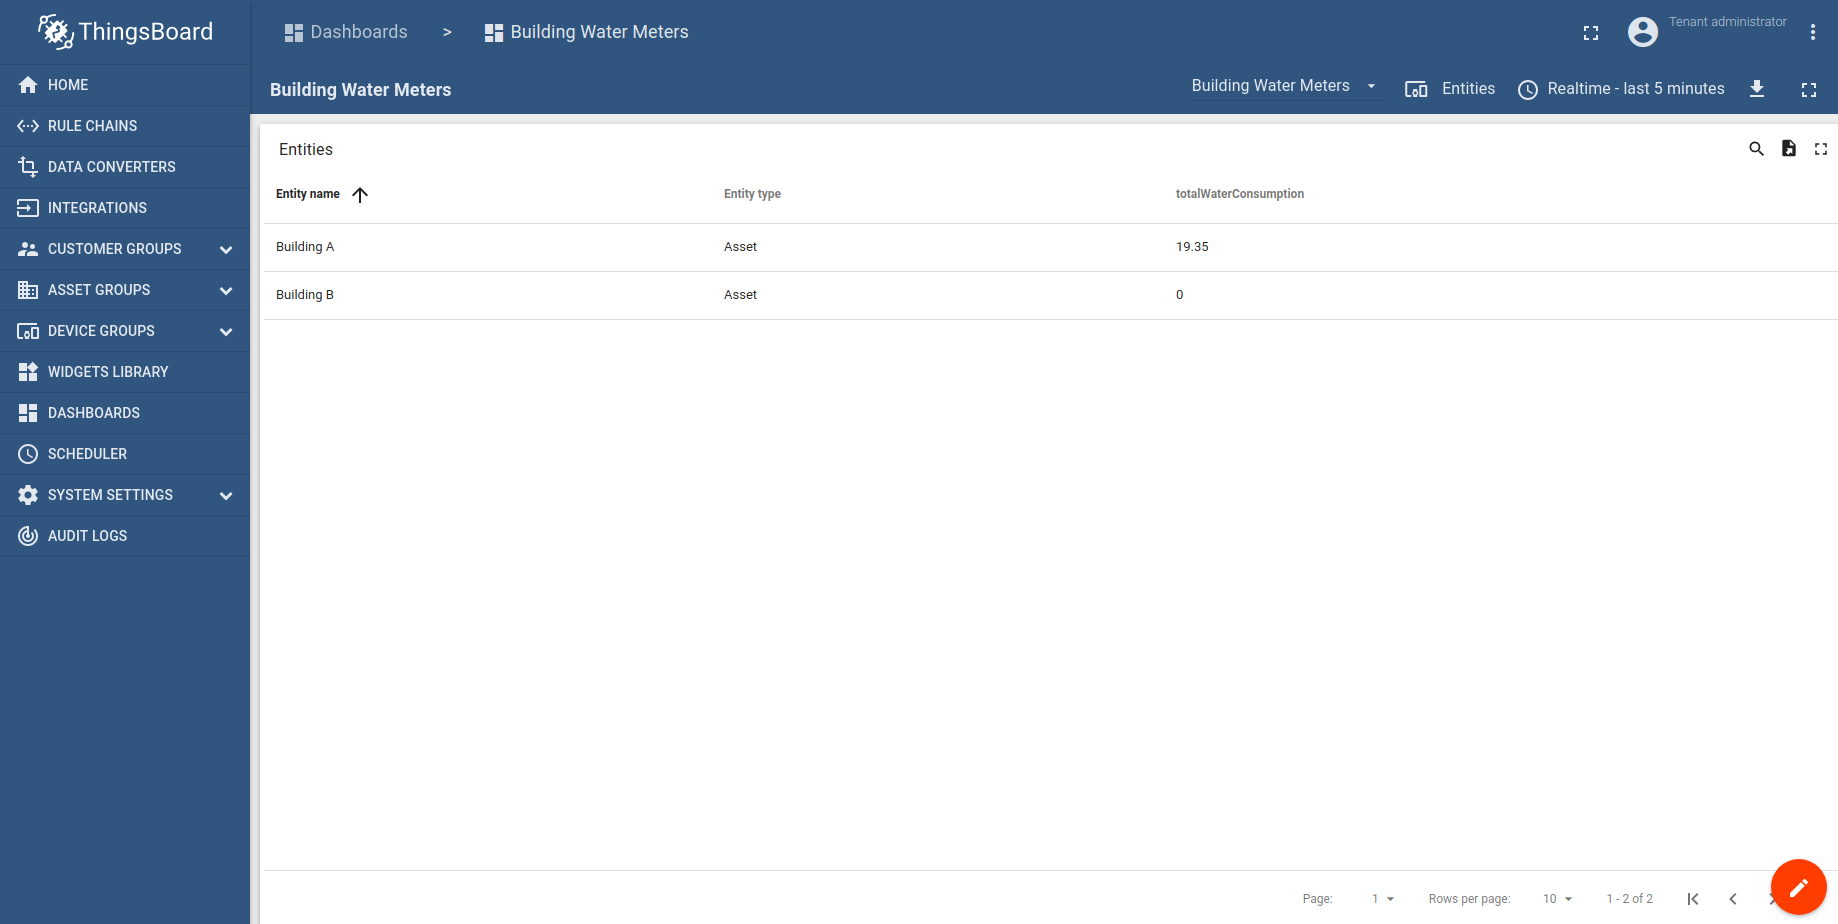
Note that you can drill down to the chart for particular warehouse by clicking on the corresponding row.
Next steps
-
Getting started guides - These guides provide quick overview of main ThingsBoard features. Designed to be completed in 15-30 minutes.
-
Connect your device - Learn how to connect devices based on your connectivity technology or solution.
-
Data visualization - These guides contain instructions on how to configure complex ThingsBoard dashboards.
-
Data processing & actions - Learn how to use ThingsBoard Rule Engine.
-
Advanced features - Learn about advanced ThingsBoard features.
-
Contribution and Development - Learn about contribution and development in ThingsBoard.