Related entities aggregation collects the latest telemetry or attribute values from multiple entities (devices, assets, customer, or tenant) related to the target entity, applies one or more aggregation functions, and stores the aggregated result on the target entity.
Aggregation is performed only across direct (single-level) relations, ensuring predictable selection of entities.
Use “Related entities aggregation” when you need to compute a “group-level” metric from many entities, for example:
- Fleet / building dashboards: average temperature across all sensors, total power across all meters, max vibration across machines
- Operational KPIs: number of active devices, count of alarms, percentage of online units
- Occupancy / presence tracking: count how many devices are in a certain state (e.g., motion = true)
- Energy and usage totals: sum energy consumption across multiple devices or zones
- Quality monitoring: detect min/max readings across a group (e.g., lowest freezer temperature, highest humidity)
- Filtered aggregation: aggregate only a subset of entities (e.g., only “active” devices or only readings above a threshold)
Configuration
Open the create calculated field dialog and specify:
- the calculated field title,
- the entity or entity profile to which the calculated field will be applied,
- Select “Related entities aggregation” as a calculated field type.
Aggregation path to related entities
ThingsBoard will collect data for aggregation from all entities that match the selected relationship direction and relationship type.
Relation direction
Define the path to the entities from which the data will be read:
- Down to child — data is aggregated from child entities.
- Up to parent — data is aggregated from parent entities.
Aggregation works only with direct (single-level) relationships, without recursion or multi-level traversal.
Relation type
Define the relationship type between the target entity and the related entities (for example, Contains, Manages, or any relation type).
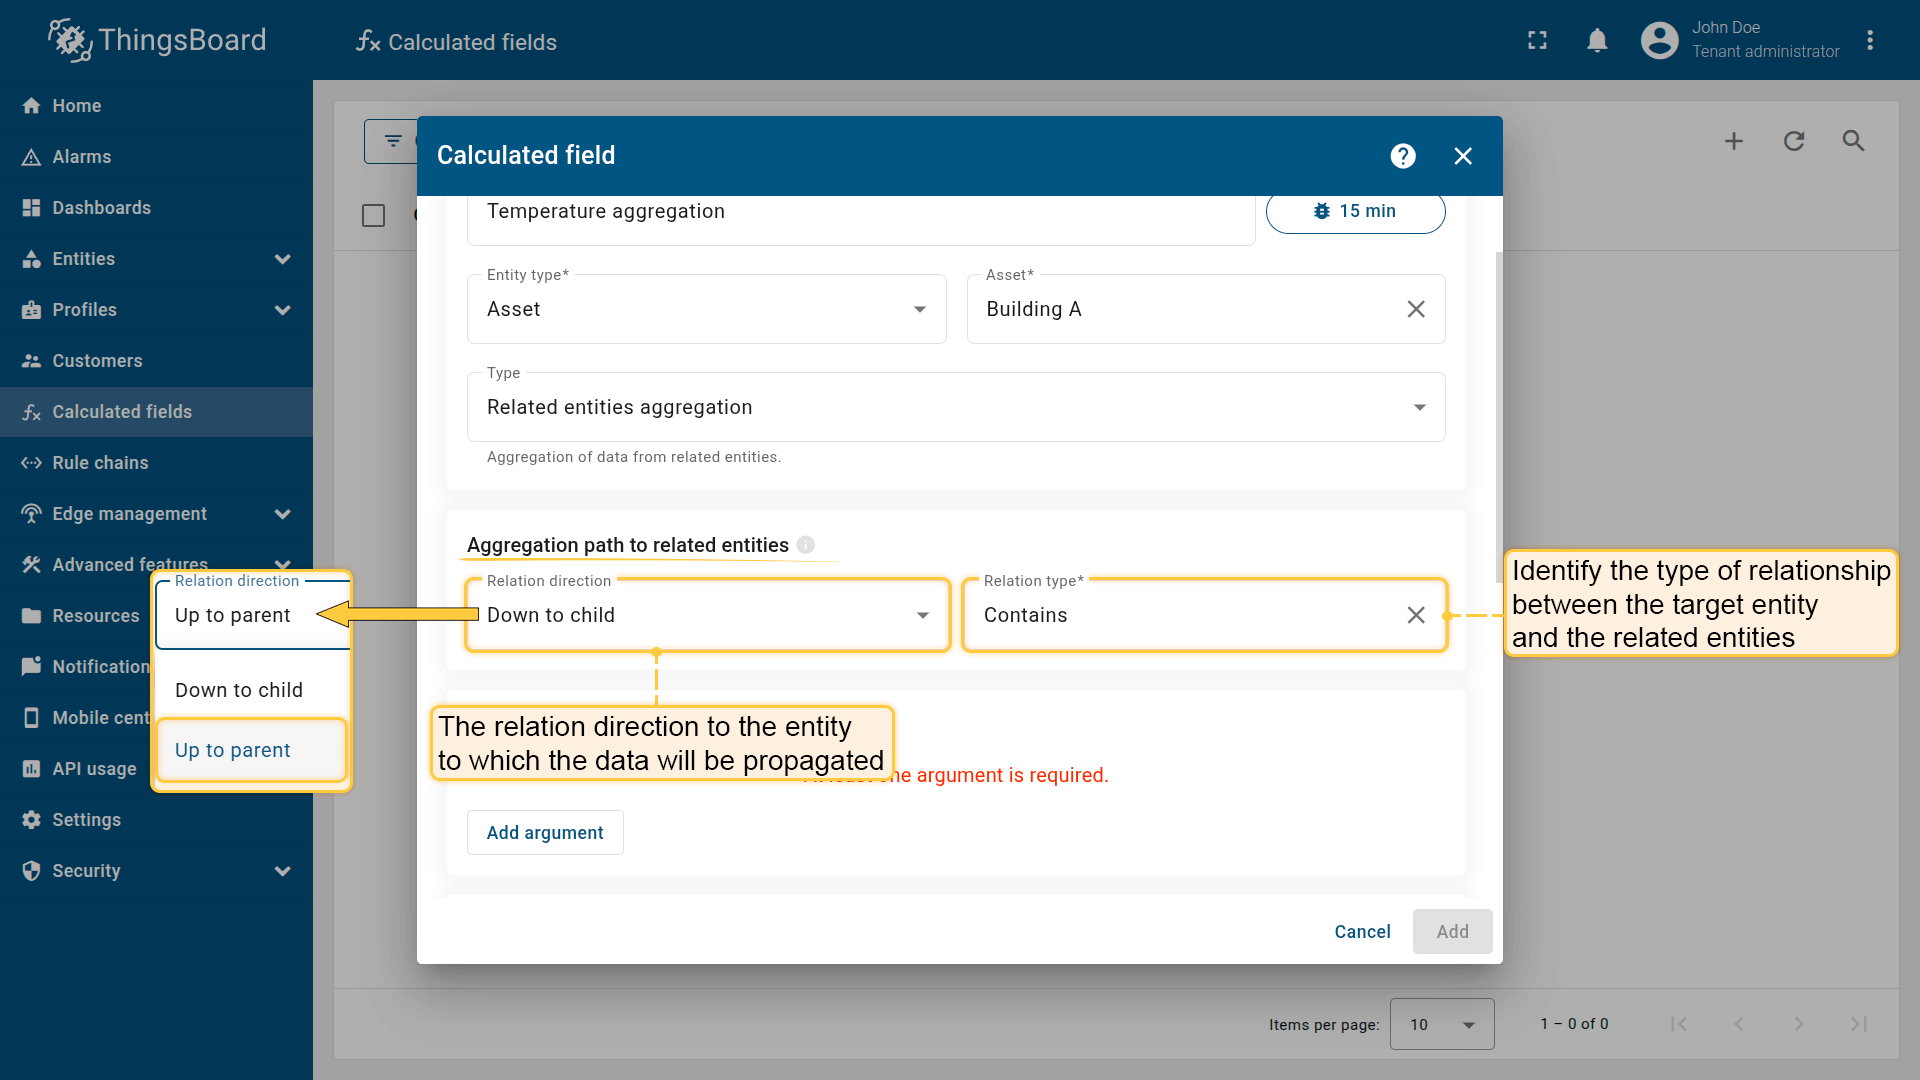
Define the path to the entities from which the data will be read for aggregation, as well as the relationship type between the target entity and the related entities.
Arguments
The arguments define the data that will be retrieved from each related entity for aggregation.
Click Add argument and fill in the required fields:
- Argument type: Latest telemetry or Attribute
- Time series key / Attribute key: the key to read
- Argument name: variable name used in metrics
- Default value: fallback if data is missing
For more details about arguments and configuration, see the Arguments section.
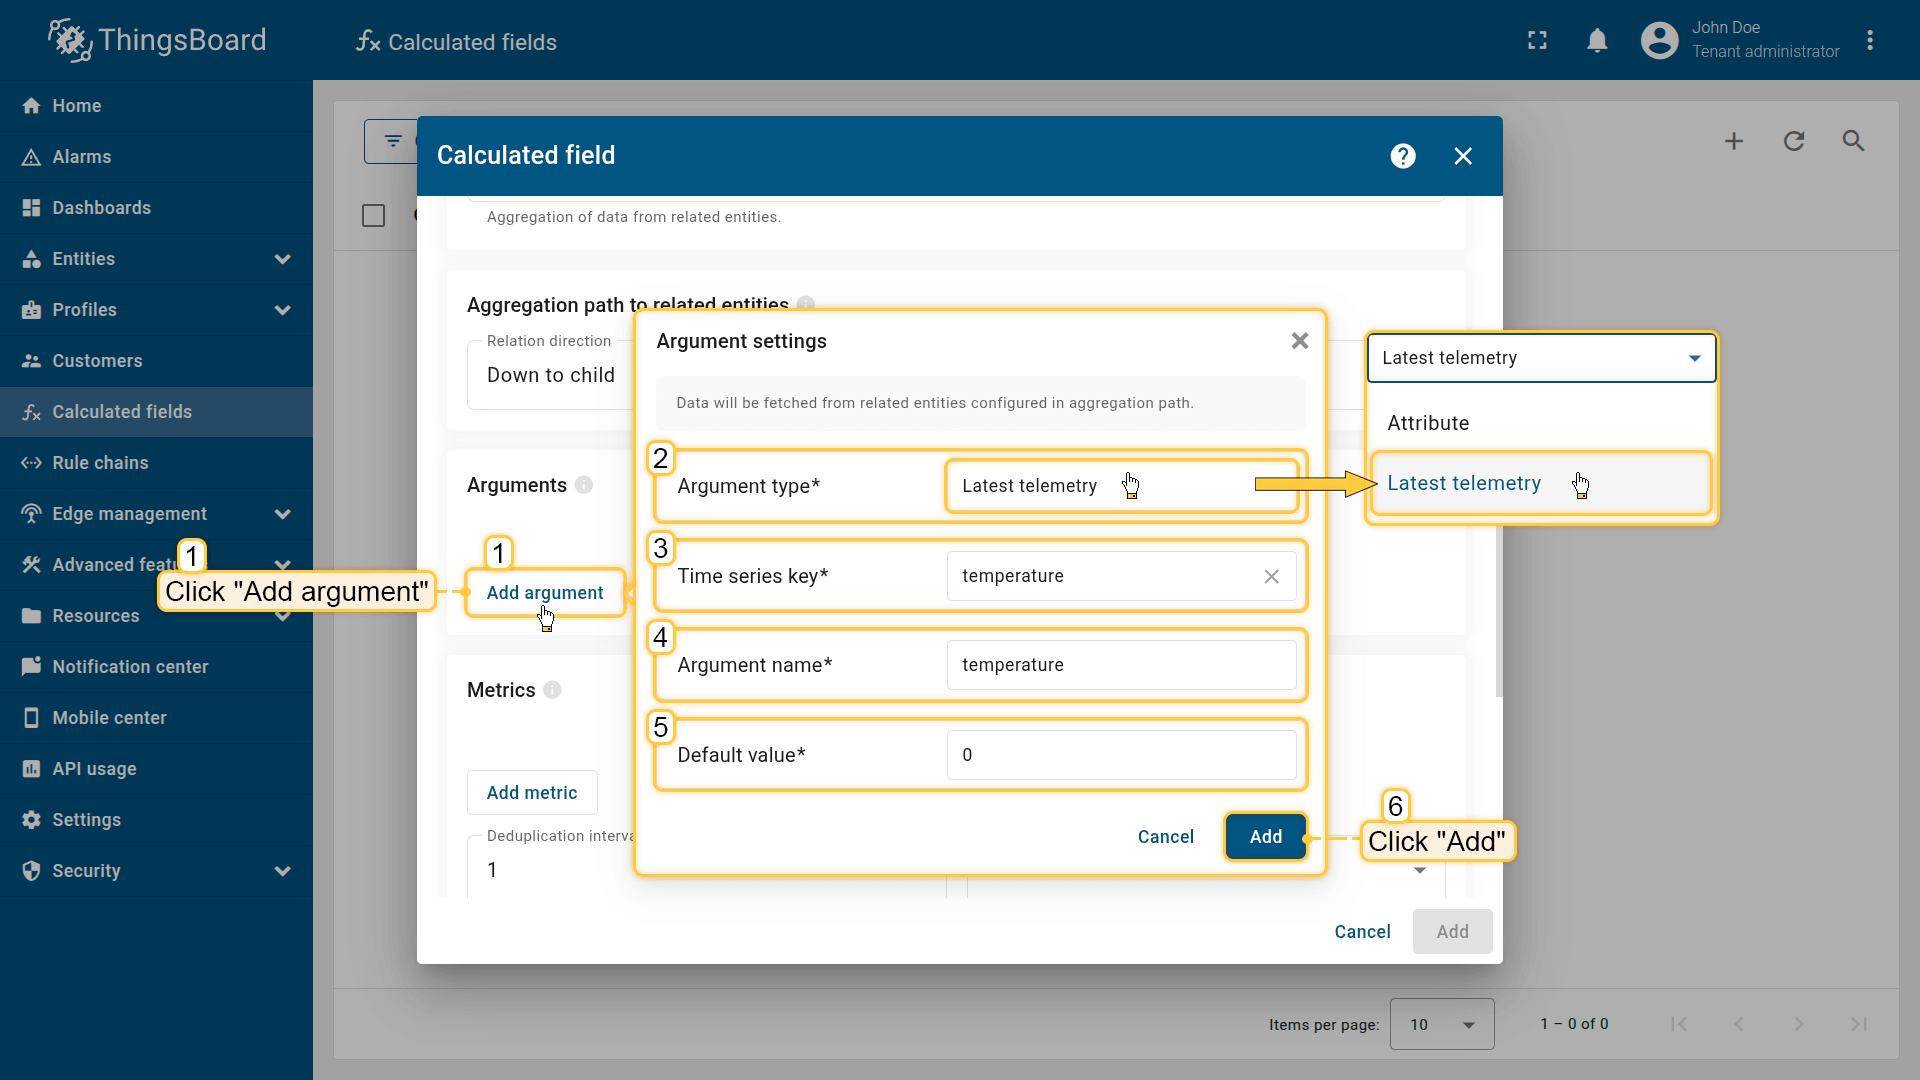
Click Add argument (1) and fill in the required fields:
select the Argument type (2), specify the Time series key / Attribute key (3) to read data from, enter the Argument name (4) that will be used in the metrics, and set the Default value (5).
Then click Add (6).”
Metrics
Define the function type (aggregation) that will be applied to the data specified in the arguments, and the key under which the aggregated result will be stored.
Each metric includes:
- Metric name: the output key name under which the aggregated result will be stored on the target entity.
- Aggregation: Average / Min / Max / Sum / Count / Count unique
- Filter (optional): include/exclude entity values before aggregation
- Value source: use a direct argument value (Key) or a function result (Function)
- Argument name: the argument whose data is being aggregated
Filter
The filter is a function that returns true/false and can use any defined arguments. If it returns true, the entity value is included in the aggregation; otherwise, it is skipped.
Example:
1
return temperature > 10 && status == "active";
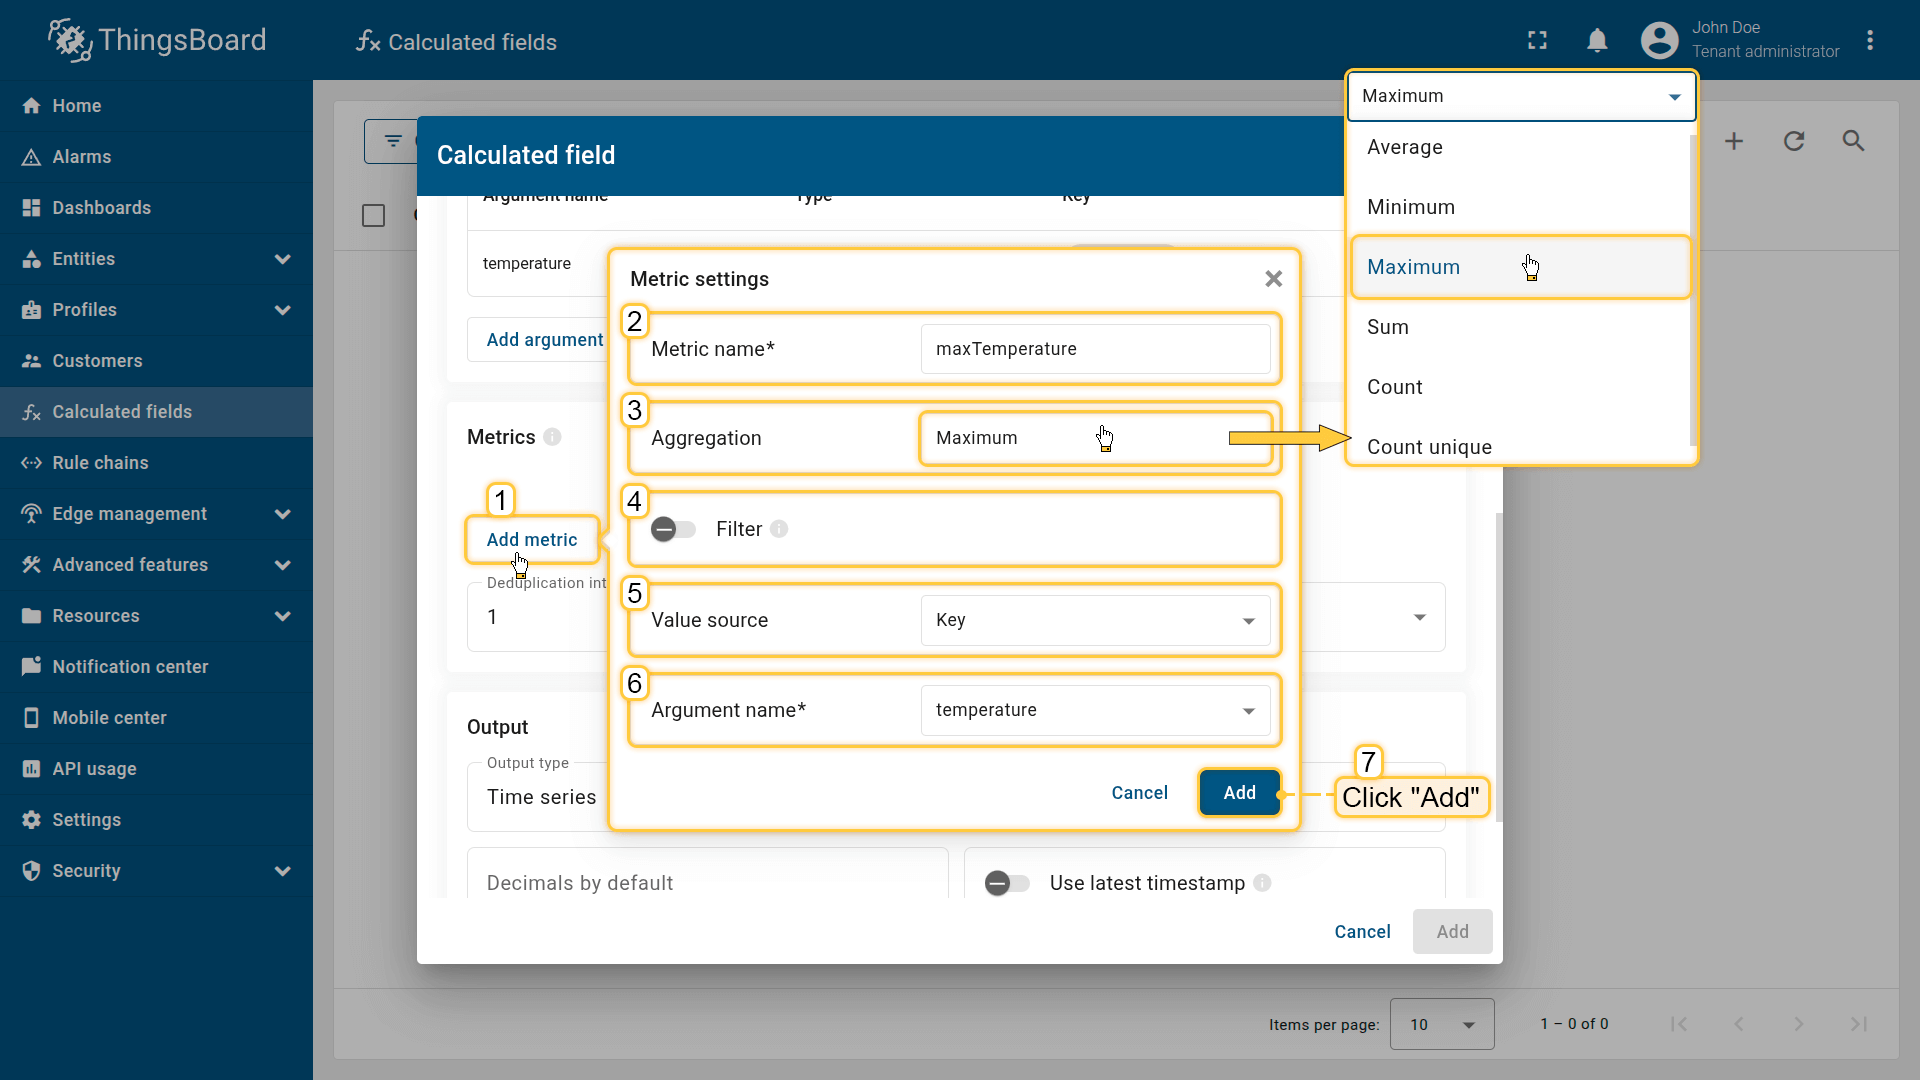
Click Add metric (1) and configure the following:
specify the metric name (2), select the aggregation type (3), optionally enable a filter (4), choose the value source (Key or Function) (5), and enter the argument name (6) that will be used as the data source.
Then click Add (7).
Deduplication interval
The Deduplication interval limits how often aggregation is executed when many related entities send frequent updates.
How it works:
- the first update triggers aggregation
- additional updates arriving within the interval do not trigger aggregation again
- after the interval ends, aggregation run again using the latest available data
Minimum time between telemetry aggregations: 10 seconds.
This prevents excessive reprocessing and reduces system load in high-frequency environments.
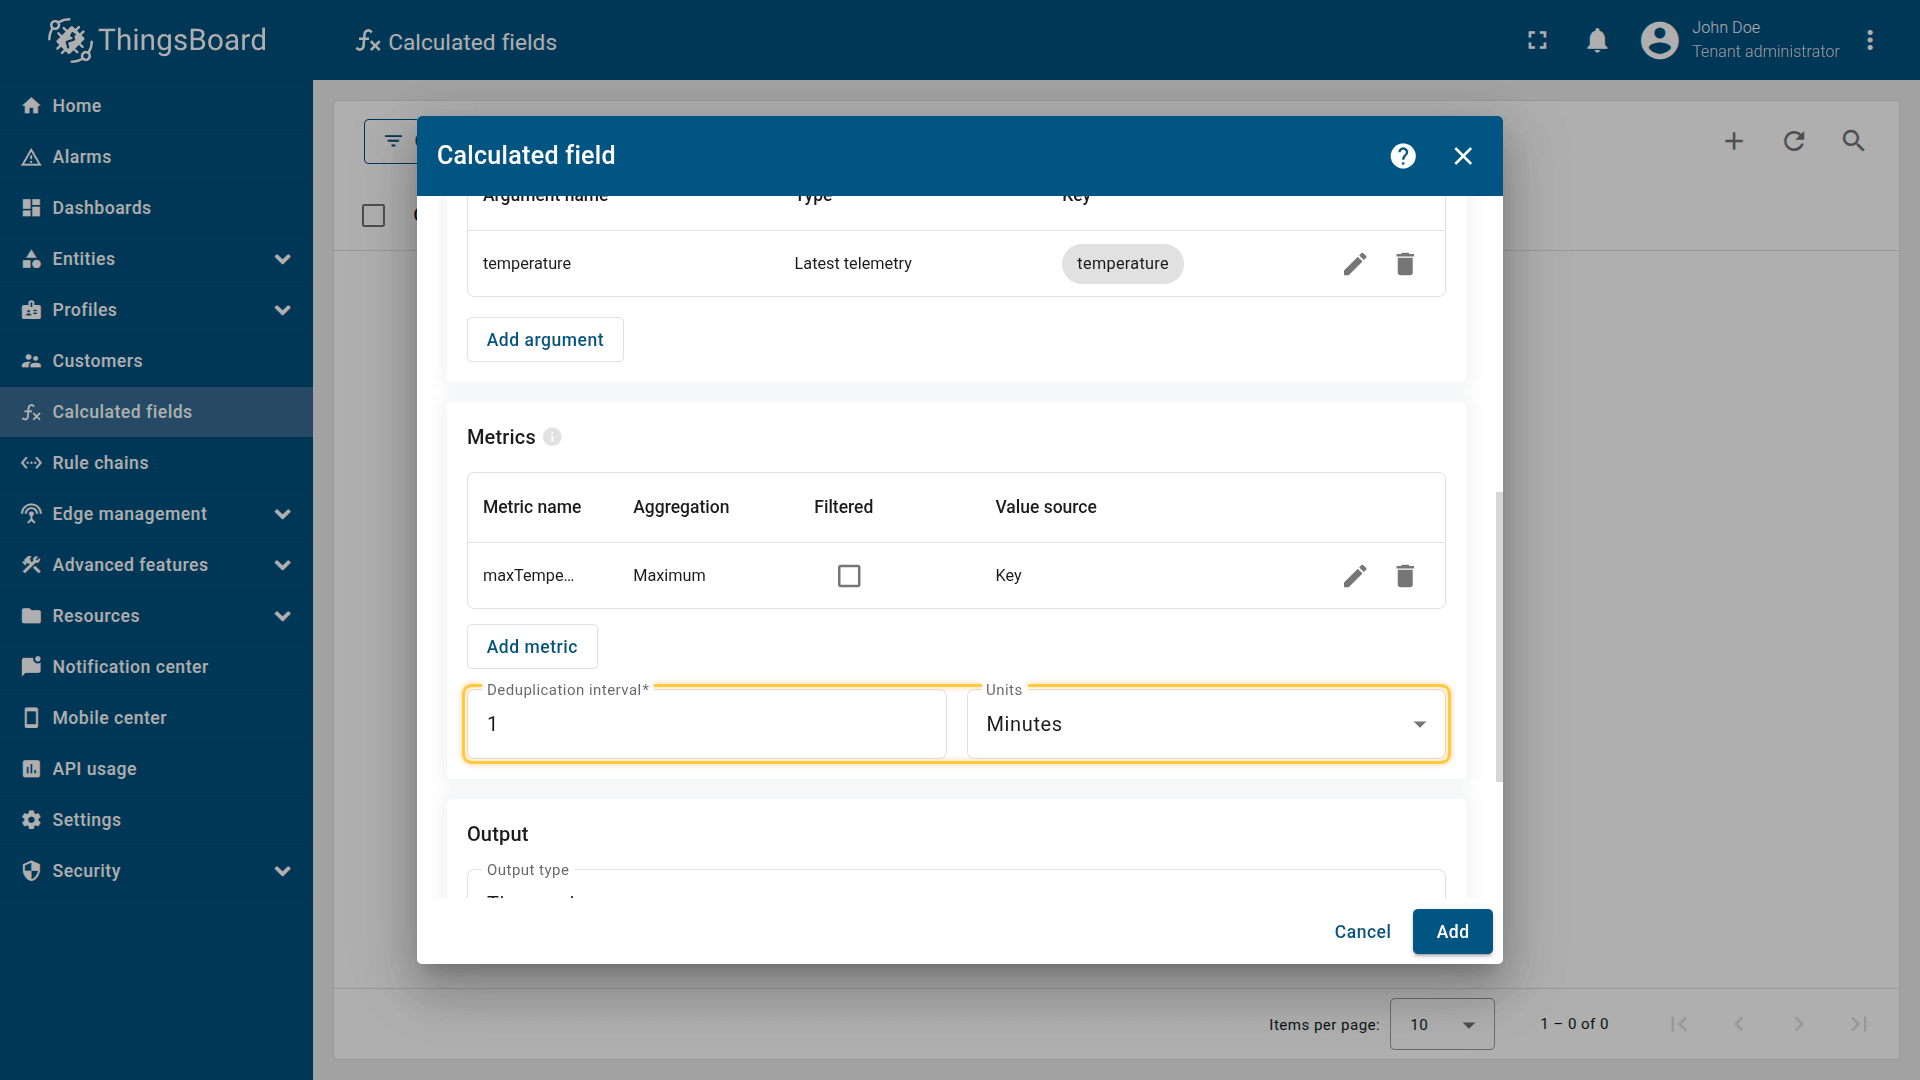
Deduplication interval is the minimum time period between repeated aggregations. It limits how often a calculated field can re-aggregate data from related entities in response to frequent updates.
Output
The calculation result is stored either as a time series or an attribute.
If needed, set Decimals to round the value.
[Only for Time series]
Enable Use latest timestamp to store the result using the most recent argument timestamp instead of server time.
For more details about output types and processing strategies, see the Output section.
Example: Aggregate temperature values from multiple child devices
Scenario
Multiple temperature sensor devices are installed in Building A and continuously publish telemetry values.
Goal
Collect temperature telemetry from all sensors related to Building A and compute:
- avgTemperature — average temperature in the building
- maxTemperature — maximum temperature in the building
Store both values as telemetry on the Building A asset.
What you will configure
You will apply an “Aggregation” calculated field to the Building A asset that:
- reads the latest temperature value from related devices (child sensors)
- computes average and maximum
- writes the results back to Building A as telemetry keys avgTemperature and maxTemperature.
Calculated field configuration
Download the “Related entities aggregation” calculated field configuration (JSON).
Configuration steps
1. Import demo devices
Import multiple smart devices that publish temperature telemetry.
- Download the CSV file: device-data-with-temperature-telemetry.csv
- Go to the Devices and import the CSV file
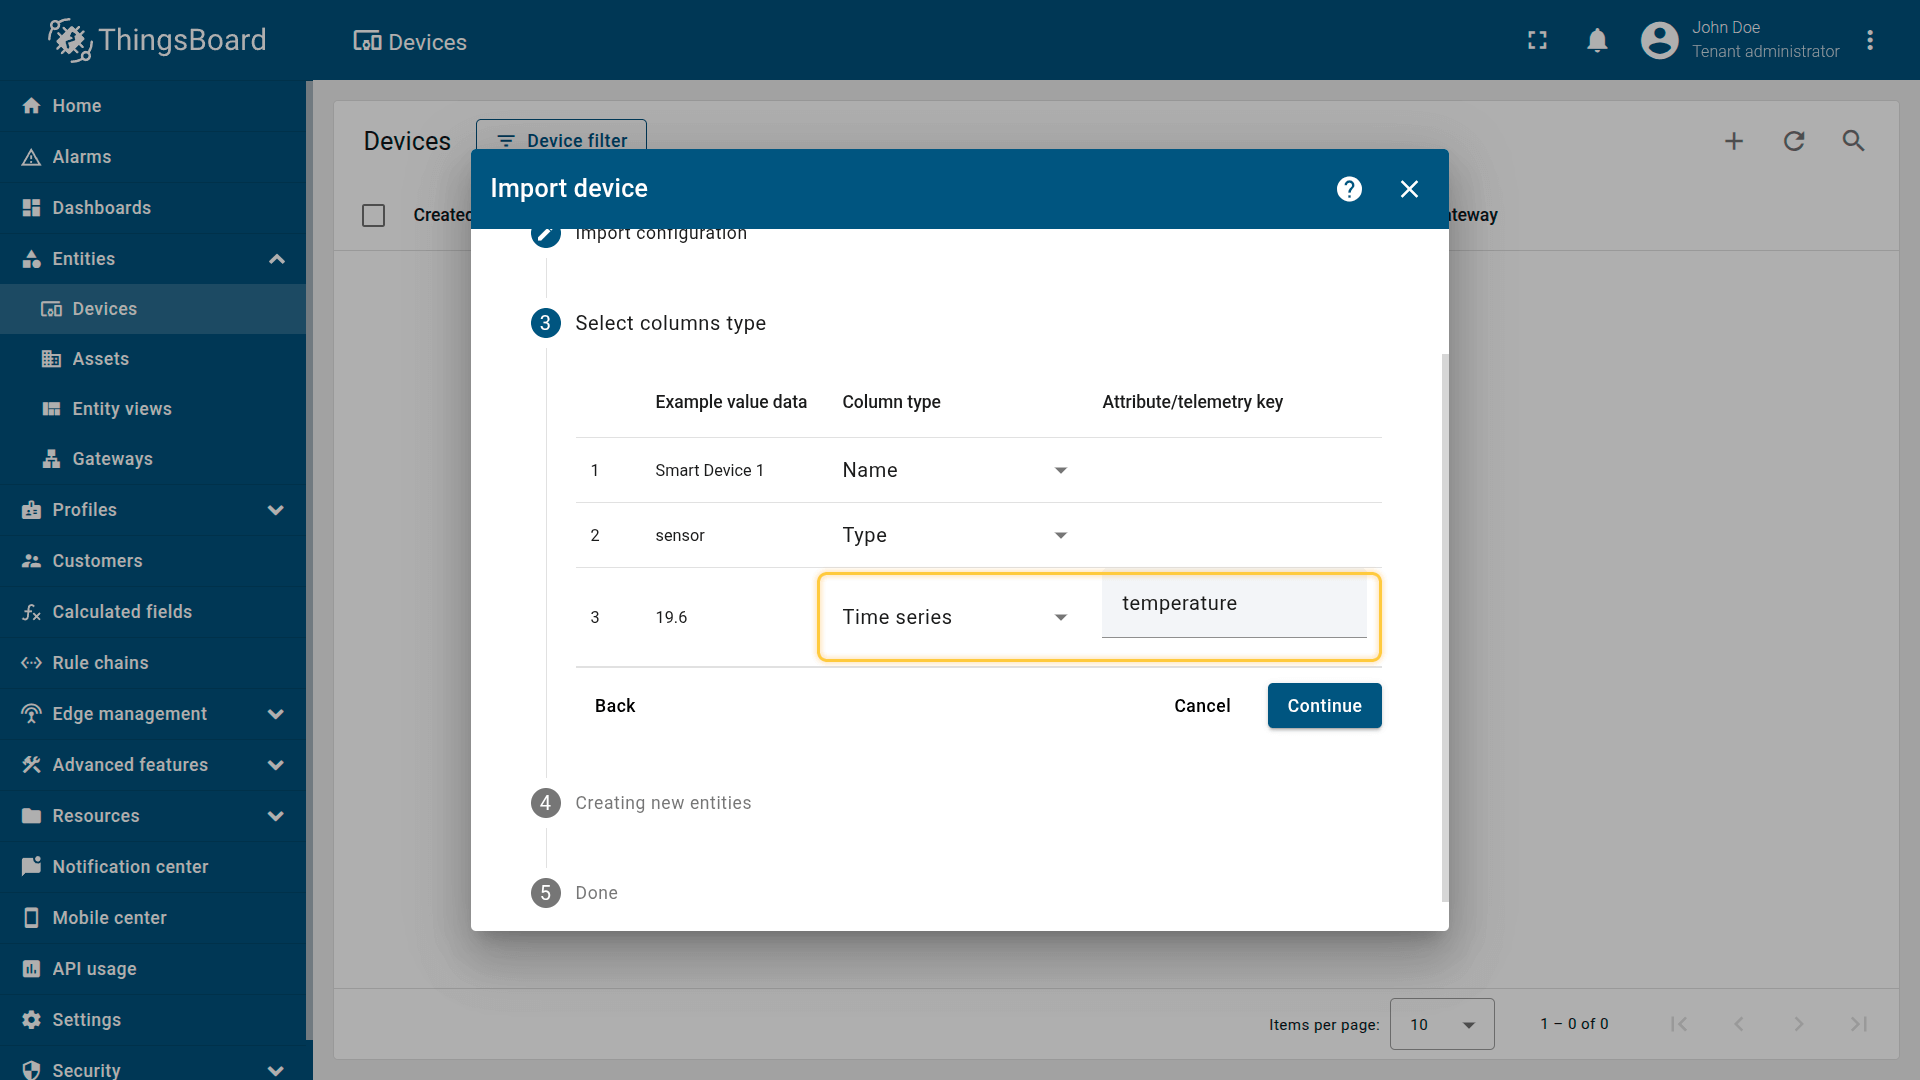
CSV includes:
- Name: Smart Device 1
- Type: sensor
- Time series: temperature
Important note about the CSV: the column type for the temperature key must be set to “Time series”.
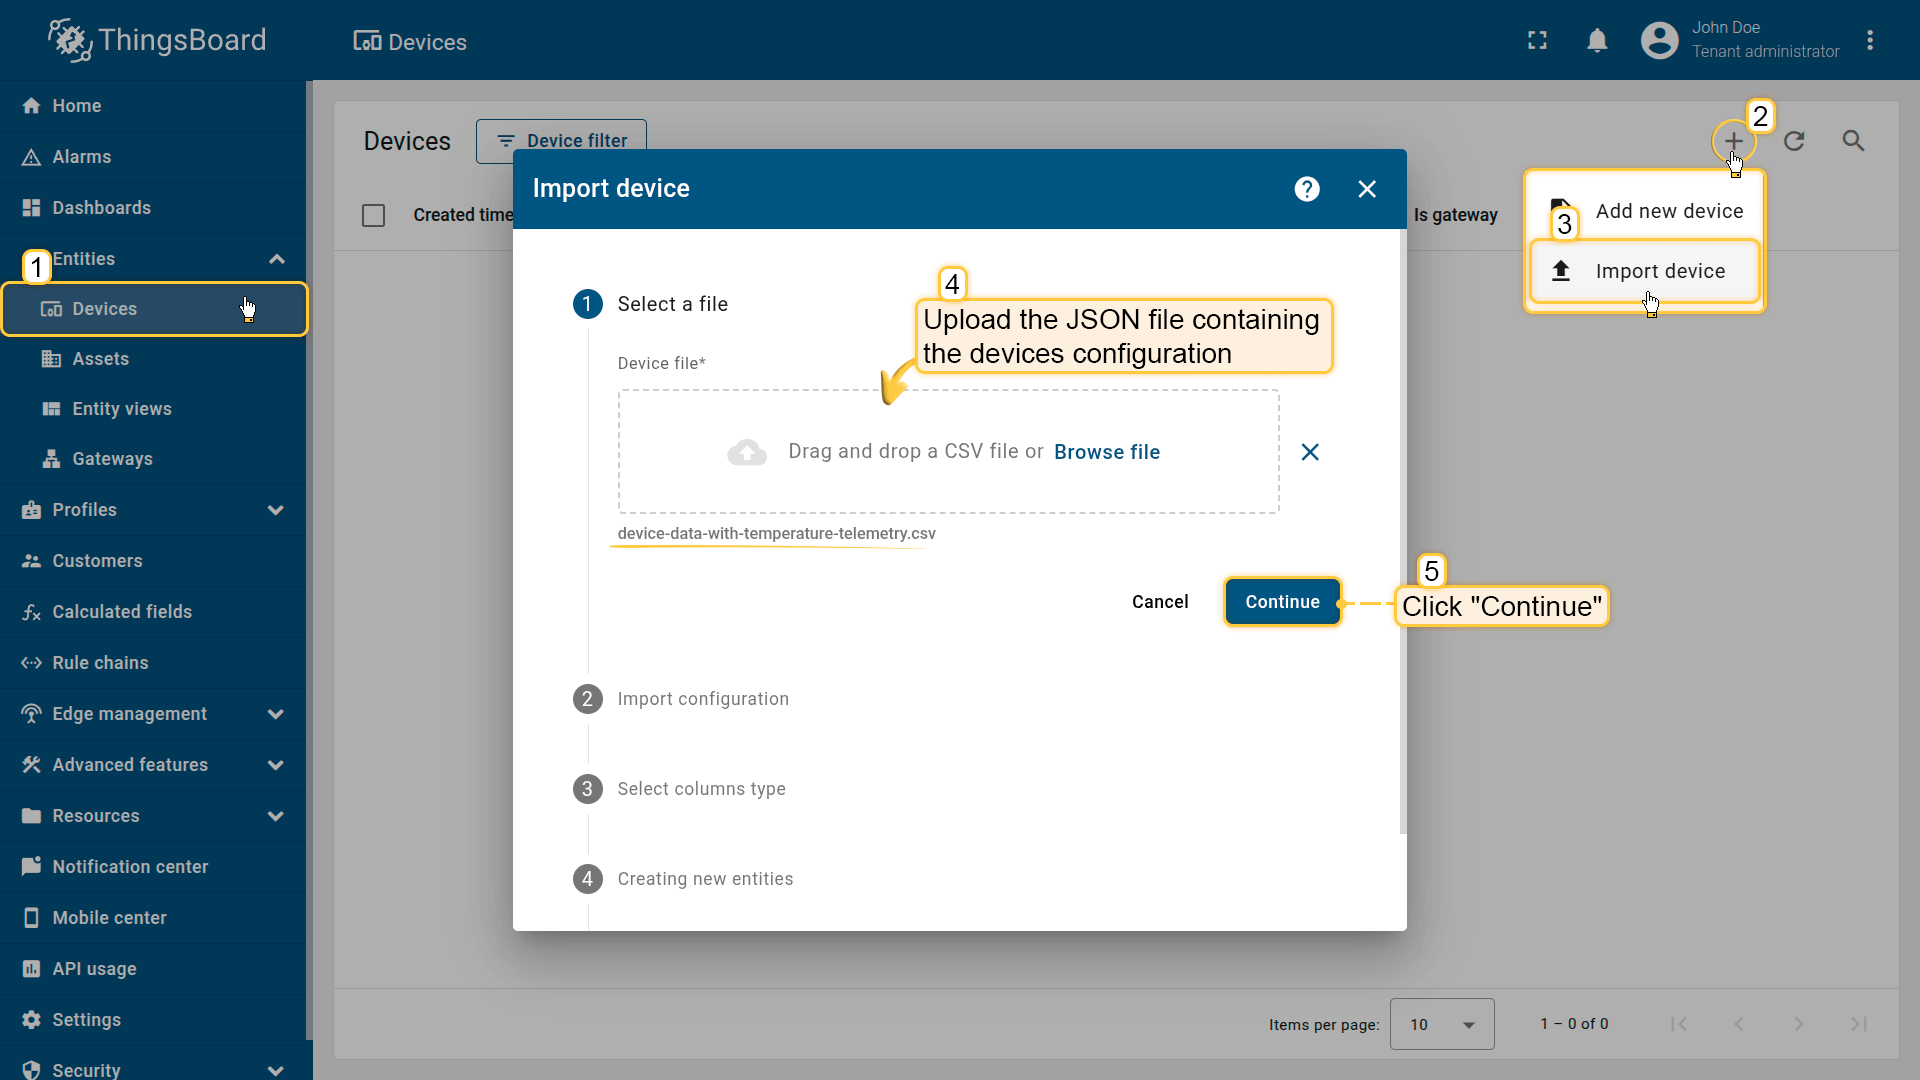
Go to the Devices and import device configurations from a CSV file.
Name: Smart Device 1
Type: sensor
Time series: temperature
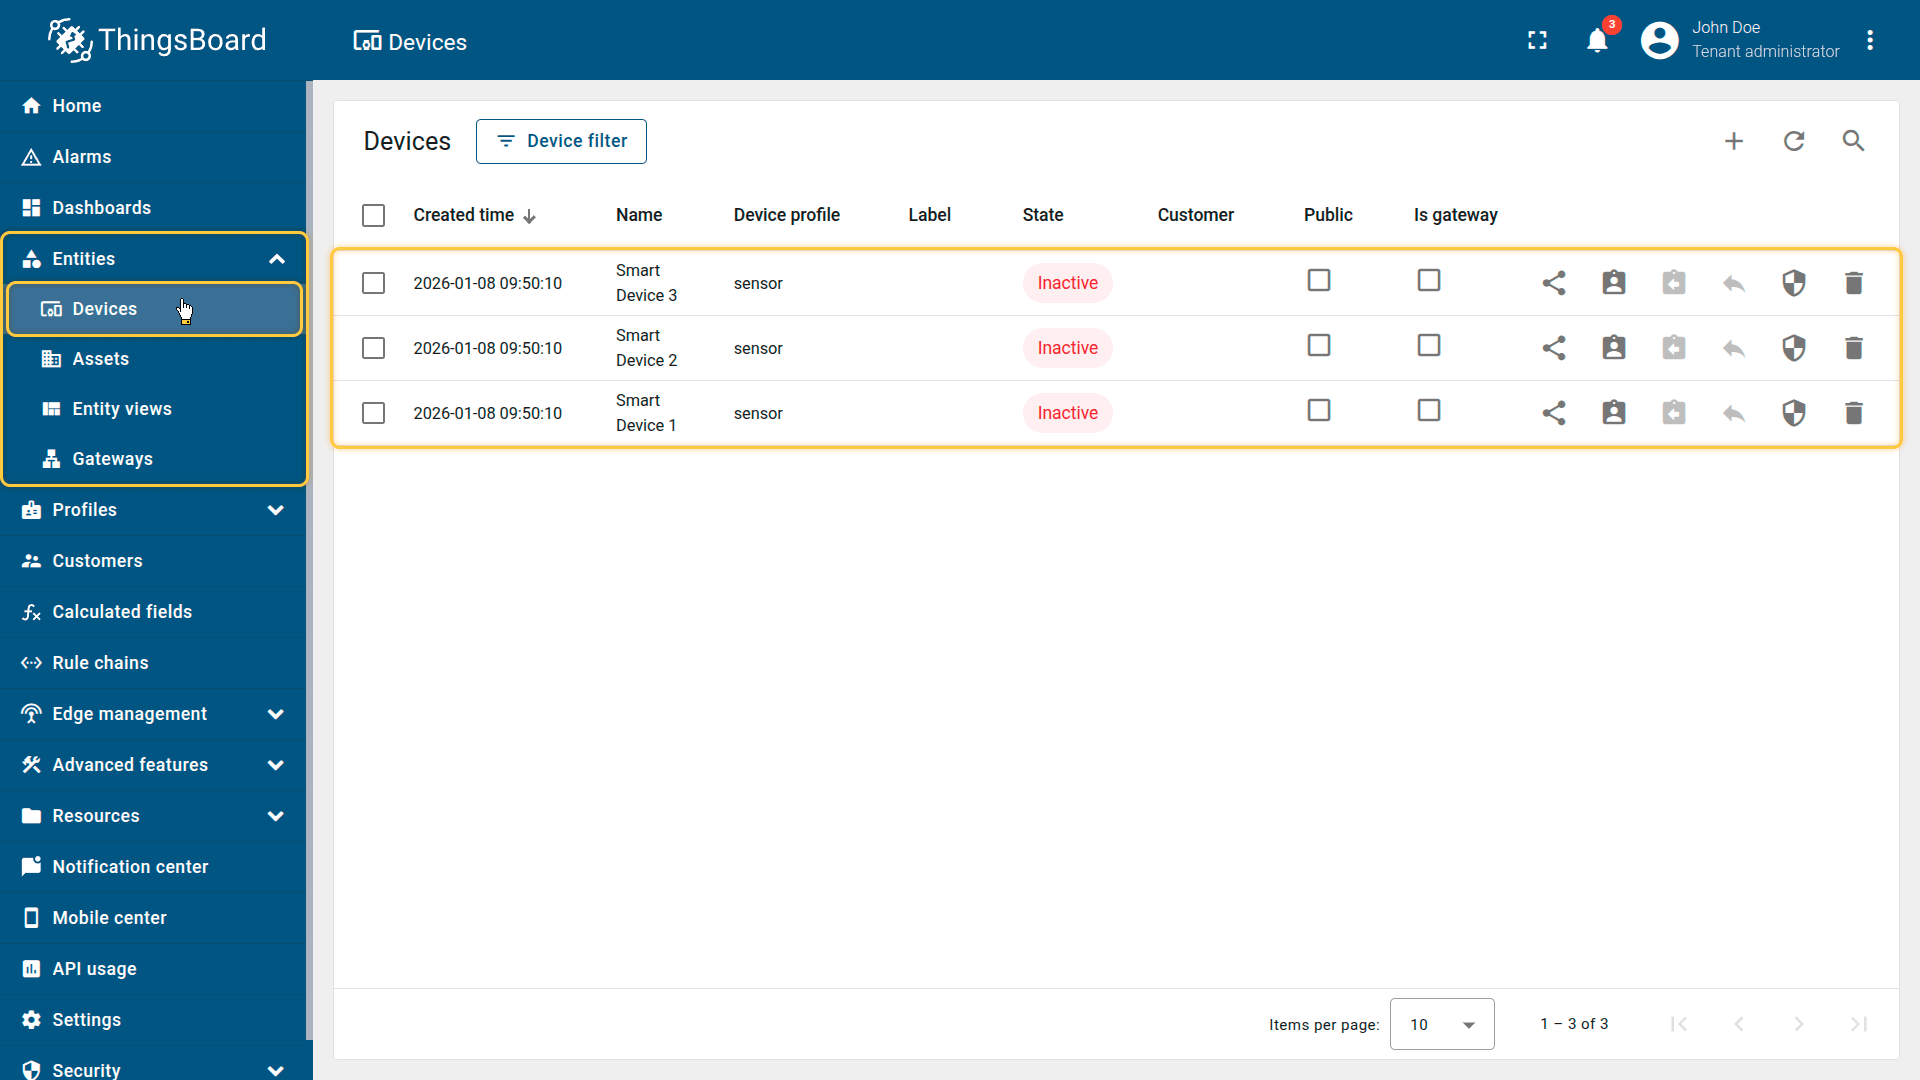
Imported smart devices that publish temperature telemetry.
2. Import demo asset
Import the asset that represents the building.
- Download the CSV file: building-asset-data.csv
- Go to Assets and import the CSV file.
CSV includes:
- Name: Building A
- Type: building

Import the demonstration asset Building A.
3. Create relations between the asset and devices
Create relationships between Building A and all smart sensors:
- Relation direction: From (Device ⇾ Building A)
- Relation type: Manages
These relations define the set of related entities whose telemetry will be aggregated.
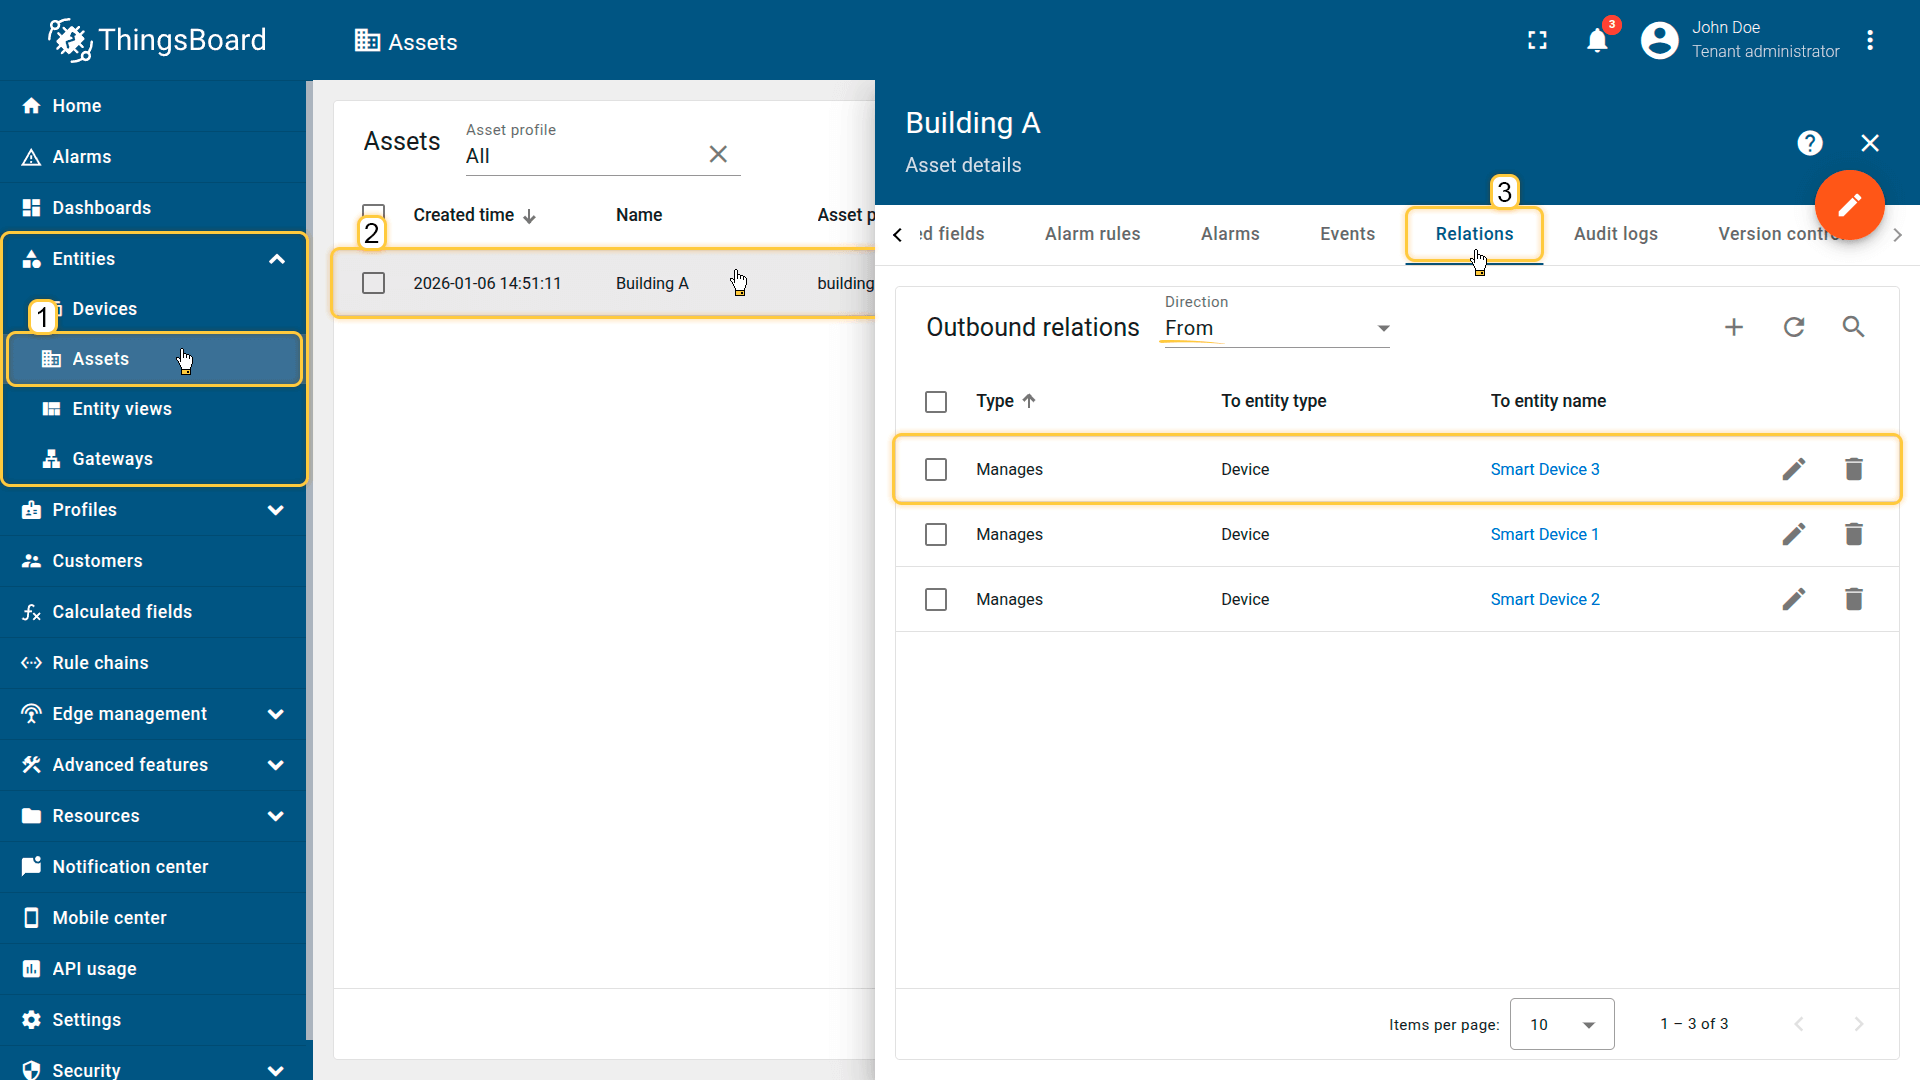
Create relationships between Building A and all smart sensors: Relationship direction: From (Devices ⇾ Building A); Relationship type: Manages
4. Apply the calculated field to the asset
Apply the Related Entities Aggregation calculated field to the Building A asset.
- Download the calculated field configuration file.
- Go to the “Calculated fields” tab and import the configuration.
The field will:
- read latest temperature value from all child devices
- compute avg/max
- store results on Building A
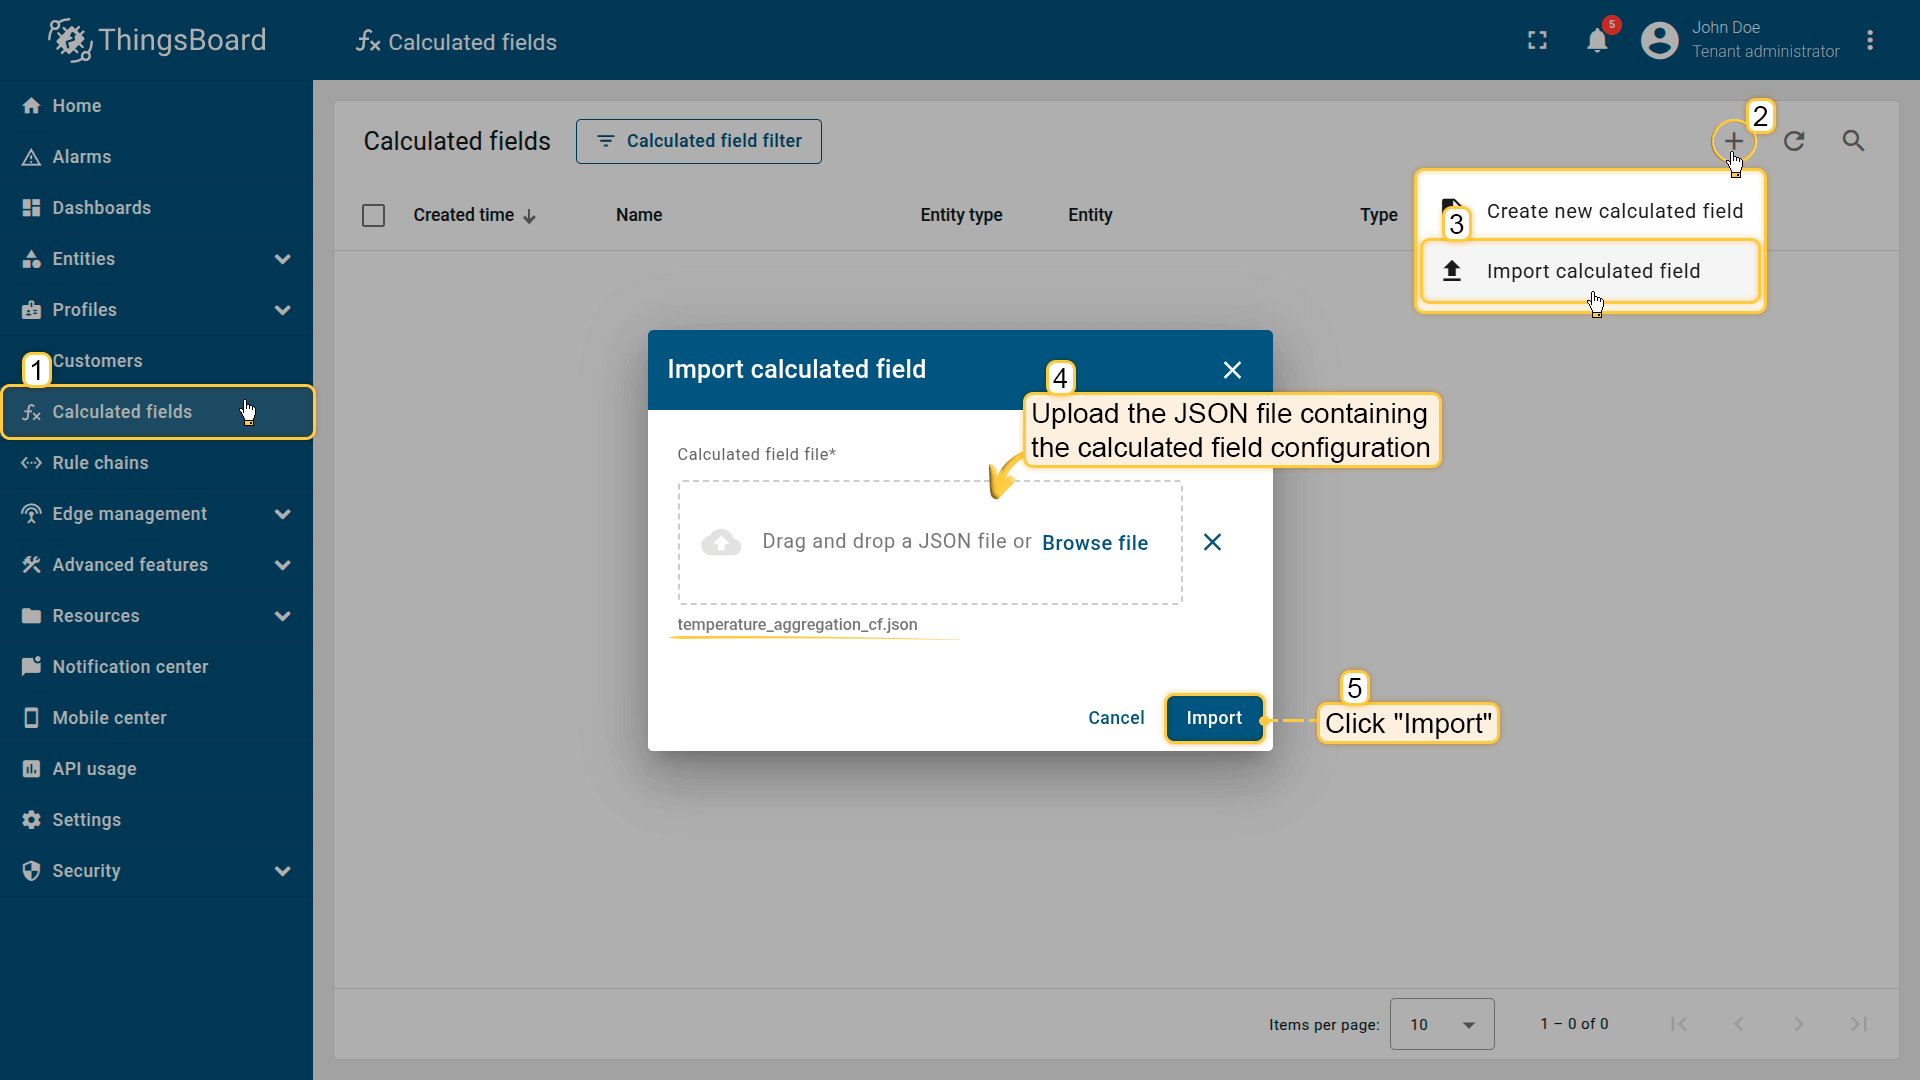
Go to the Calculated fields tab and import the calculated field configuration.
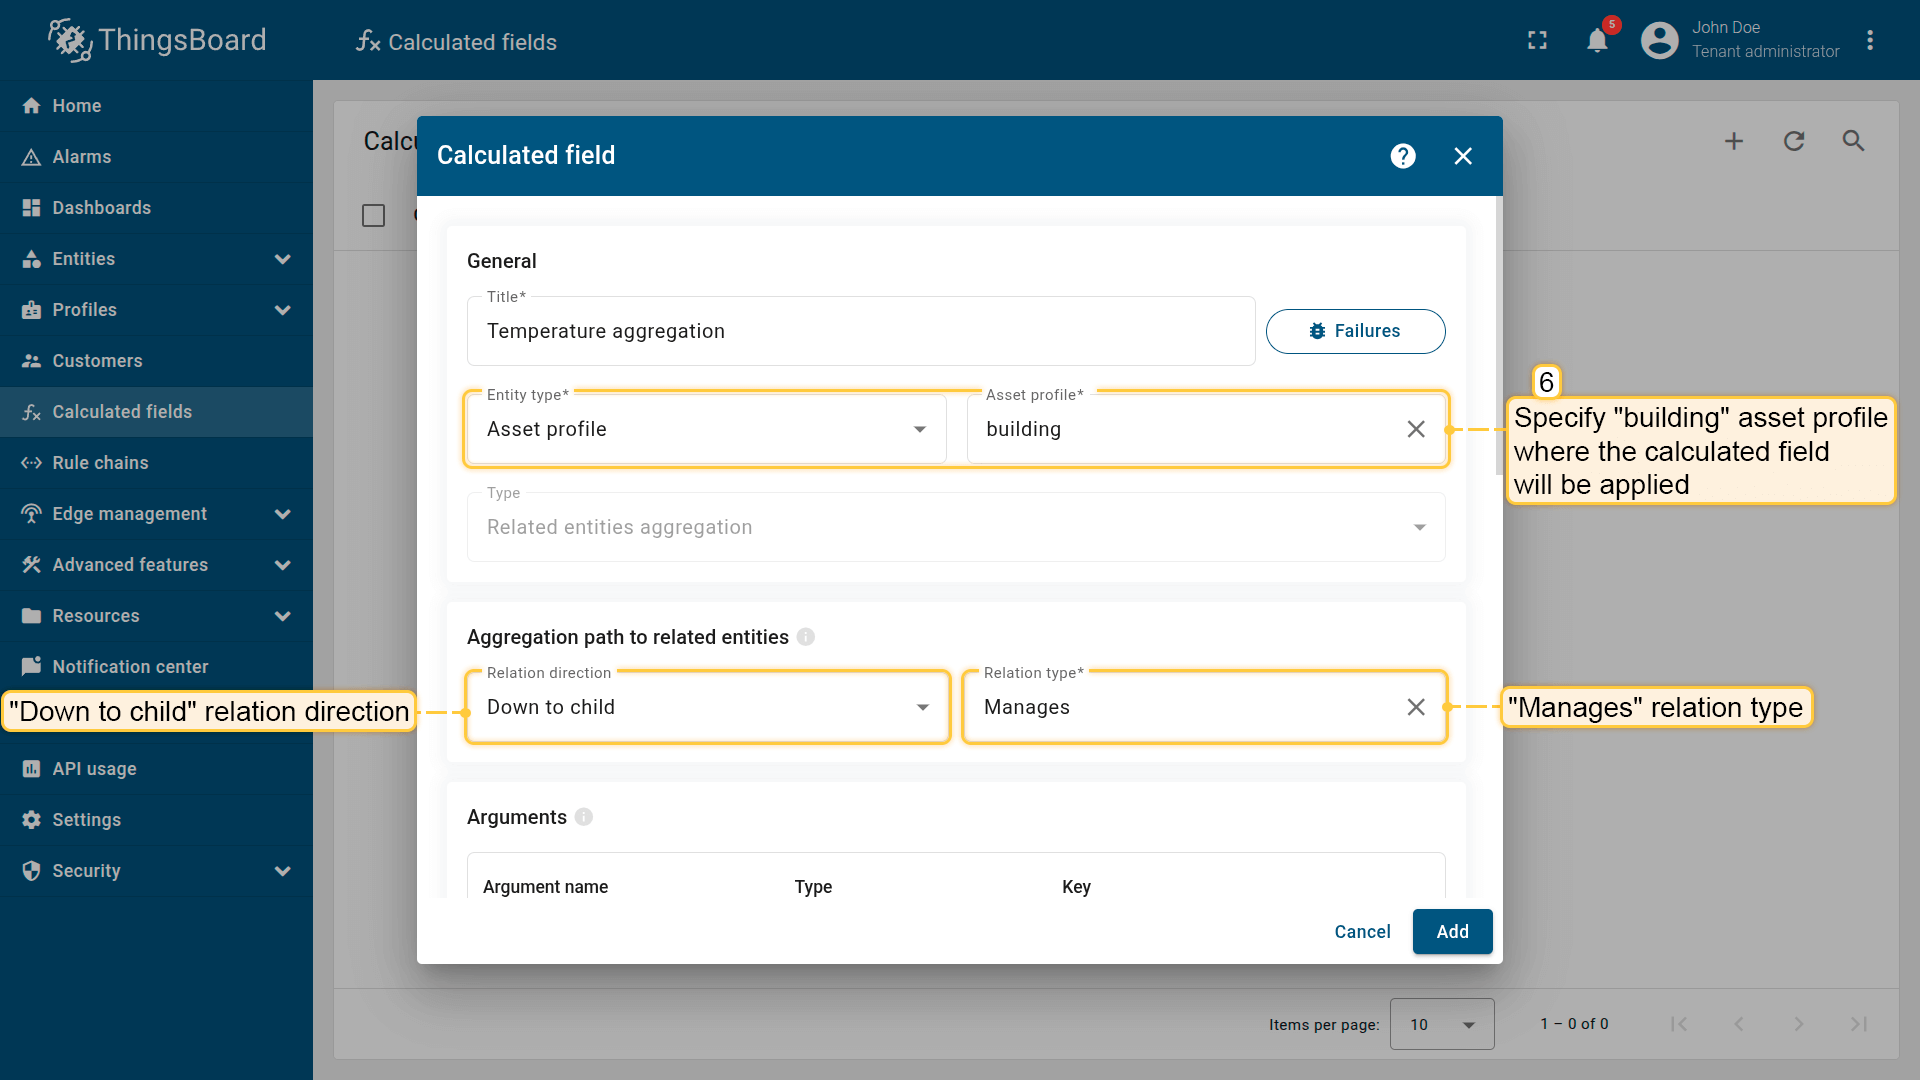
Apply the calculated field to the building asset profile.
Propagation path to related entities: Relation direction: Down to child; Relation type: Manages.
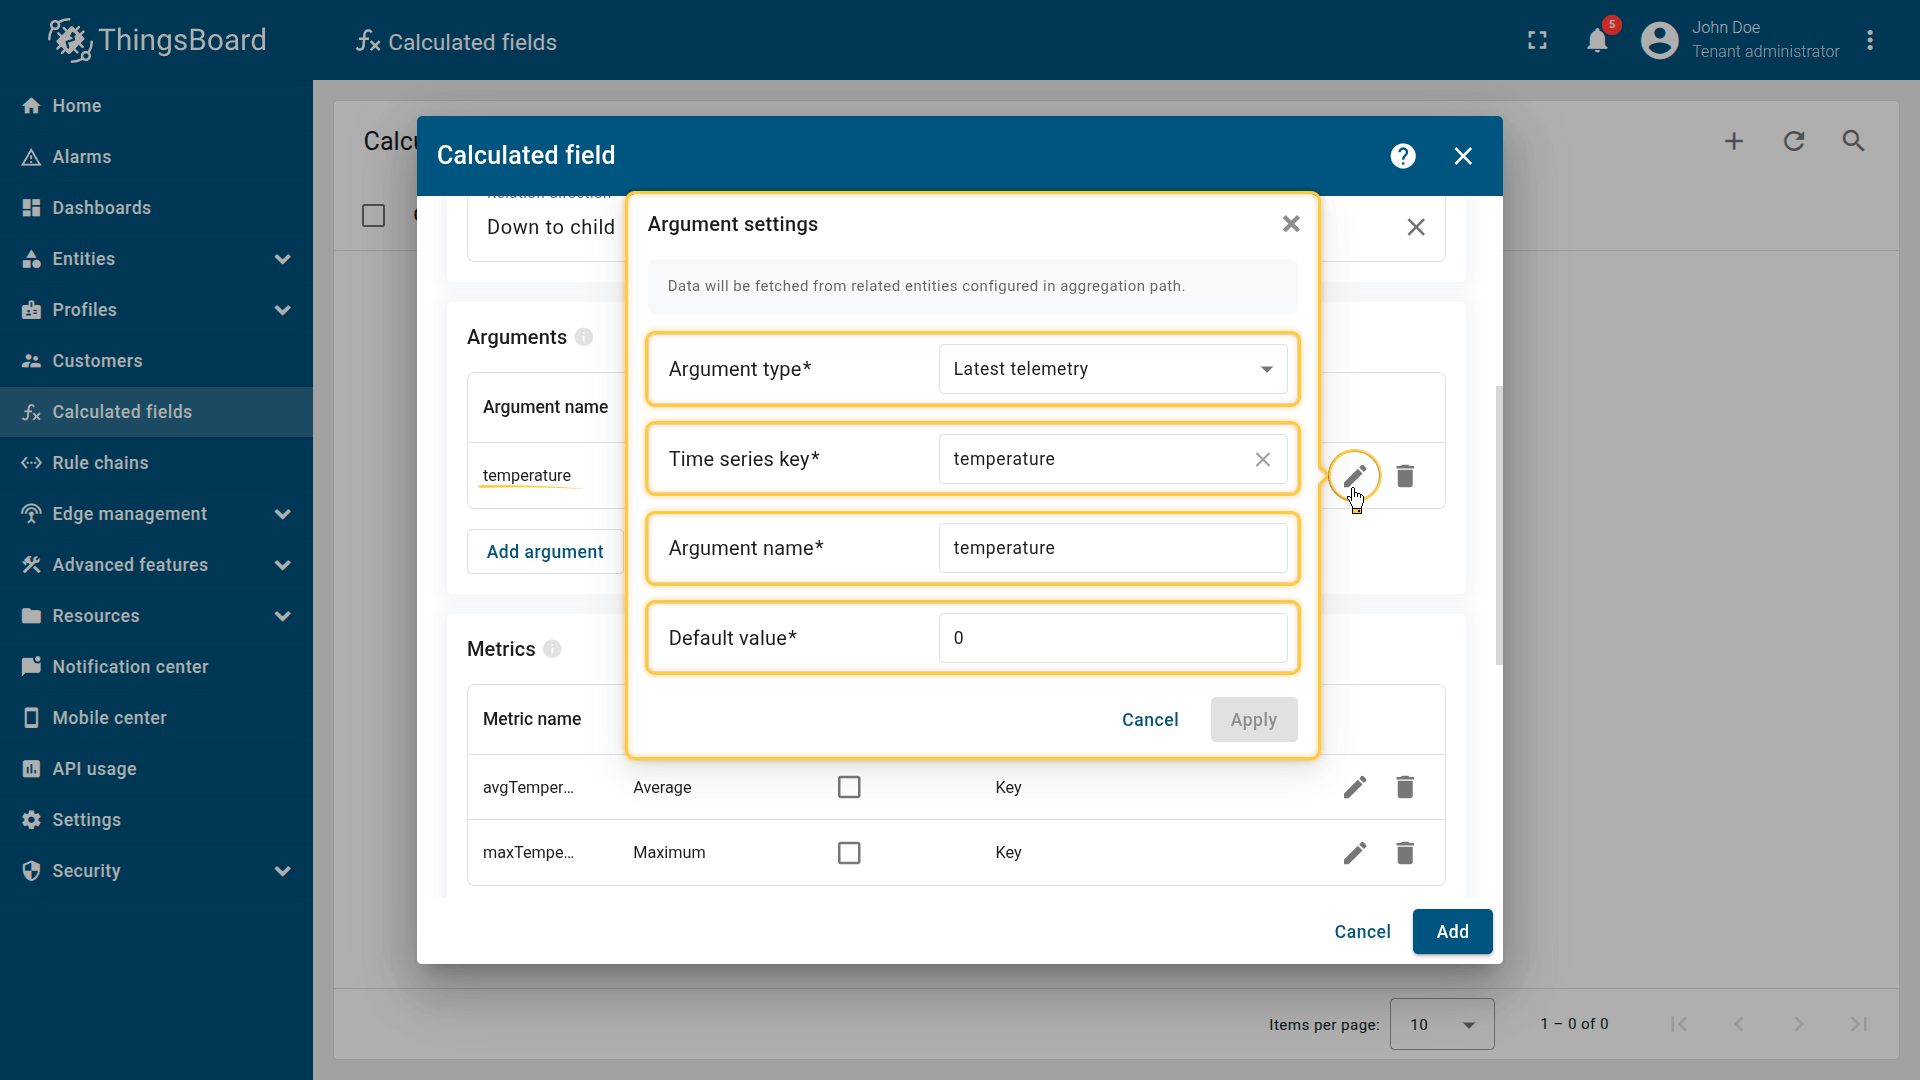
Argument settings:
- Argument type: Latest telemetry
- Time series key: temperature
- Argument name: temperature
- Default value: 0.
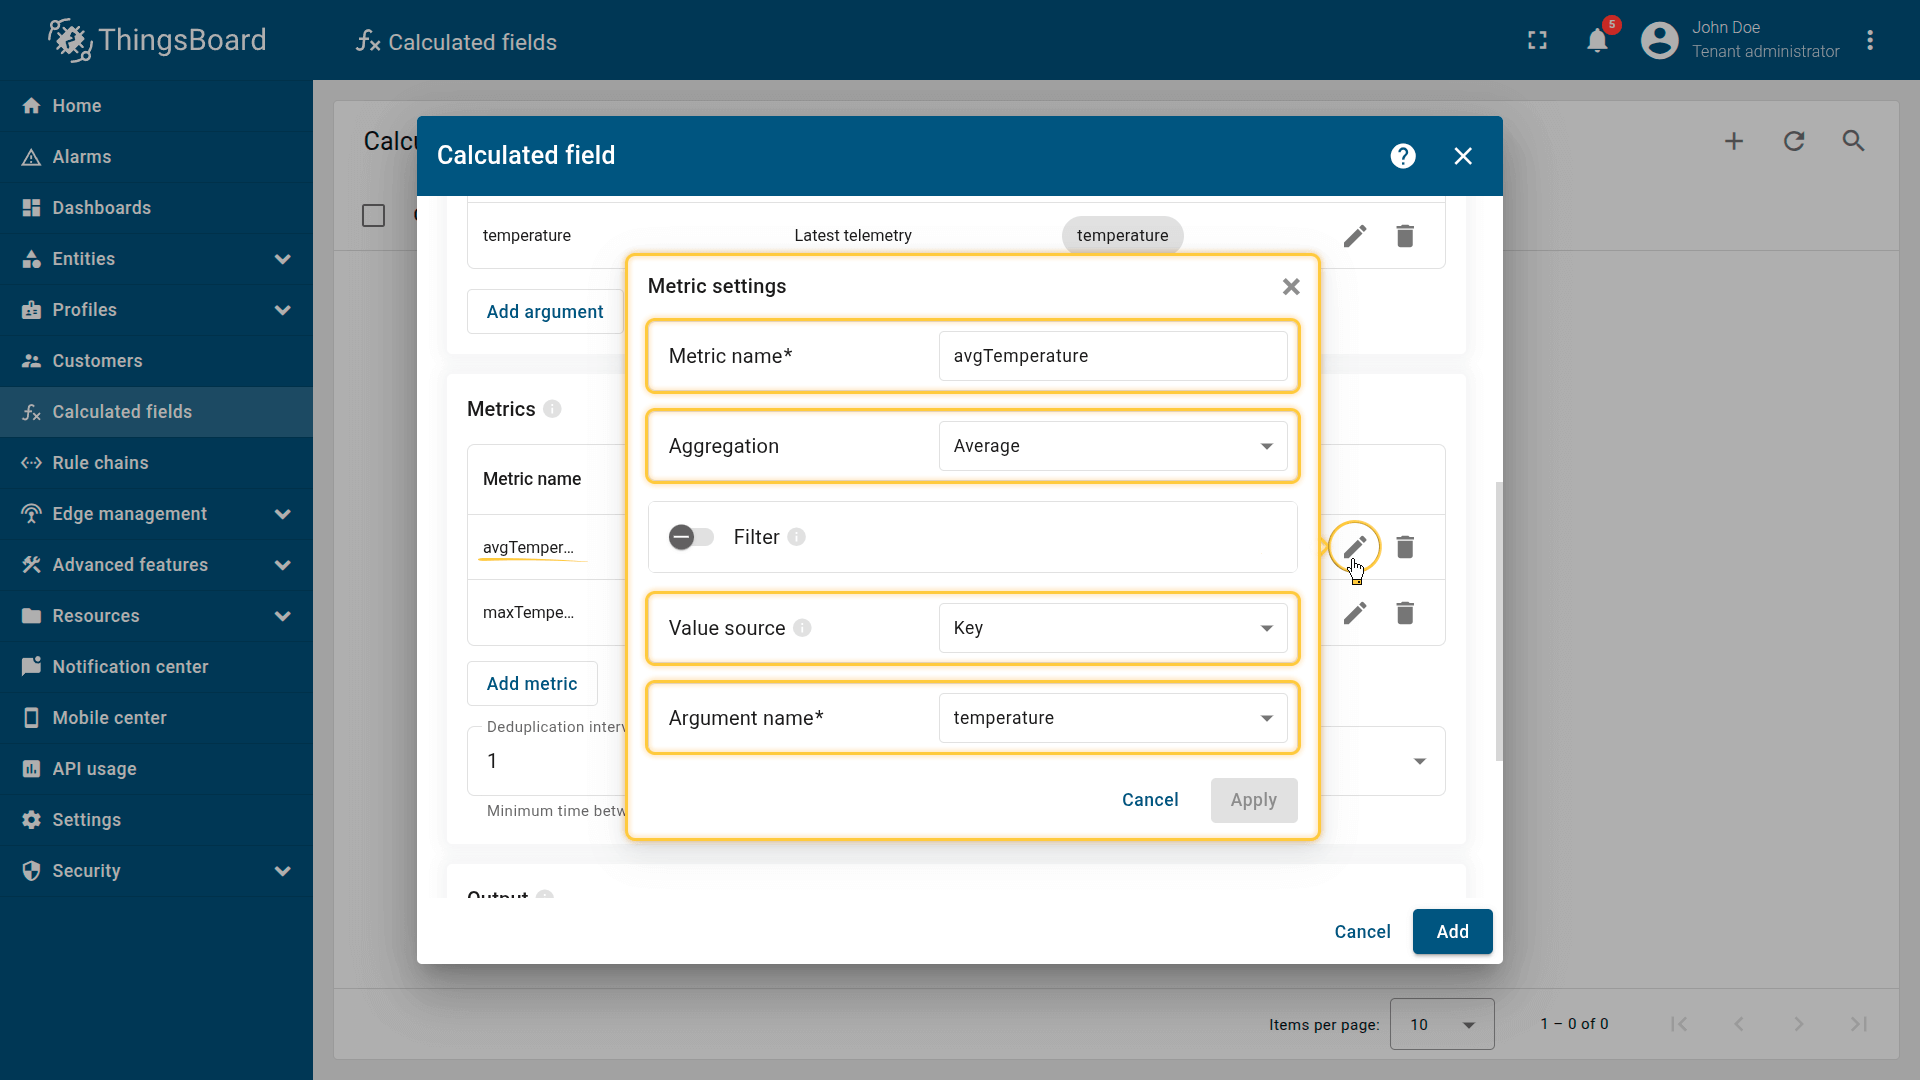
First metric settings:
- Metric name: avgTemperature
- Aggregation: Average
- Value source: key
- Argument name: temperature.
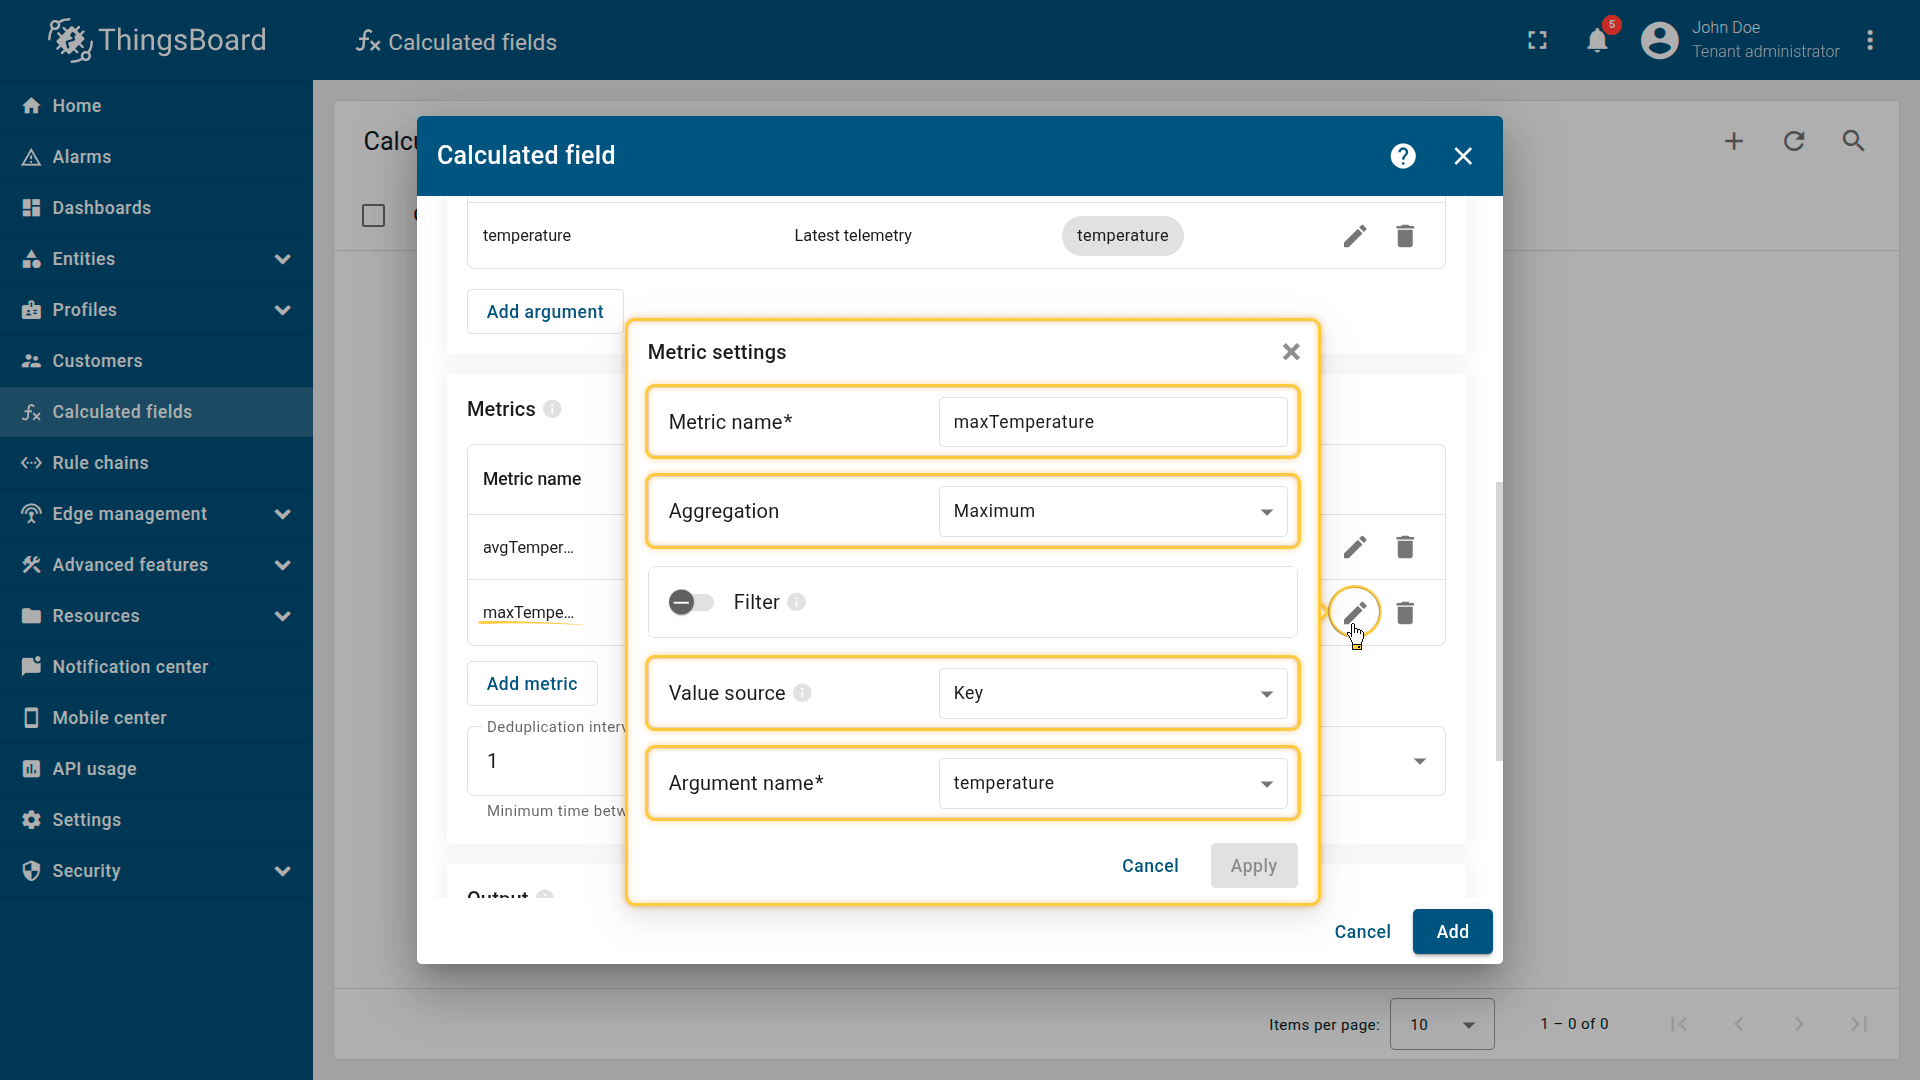
Second metric settings:
- Metric name: maxTemperature
- Aggregation: Maximum
- Value source: key
- Argument name: temperature.
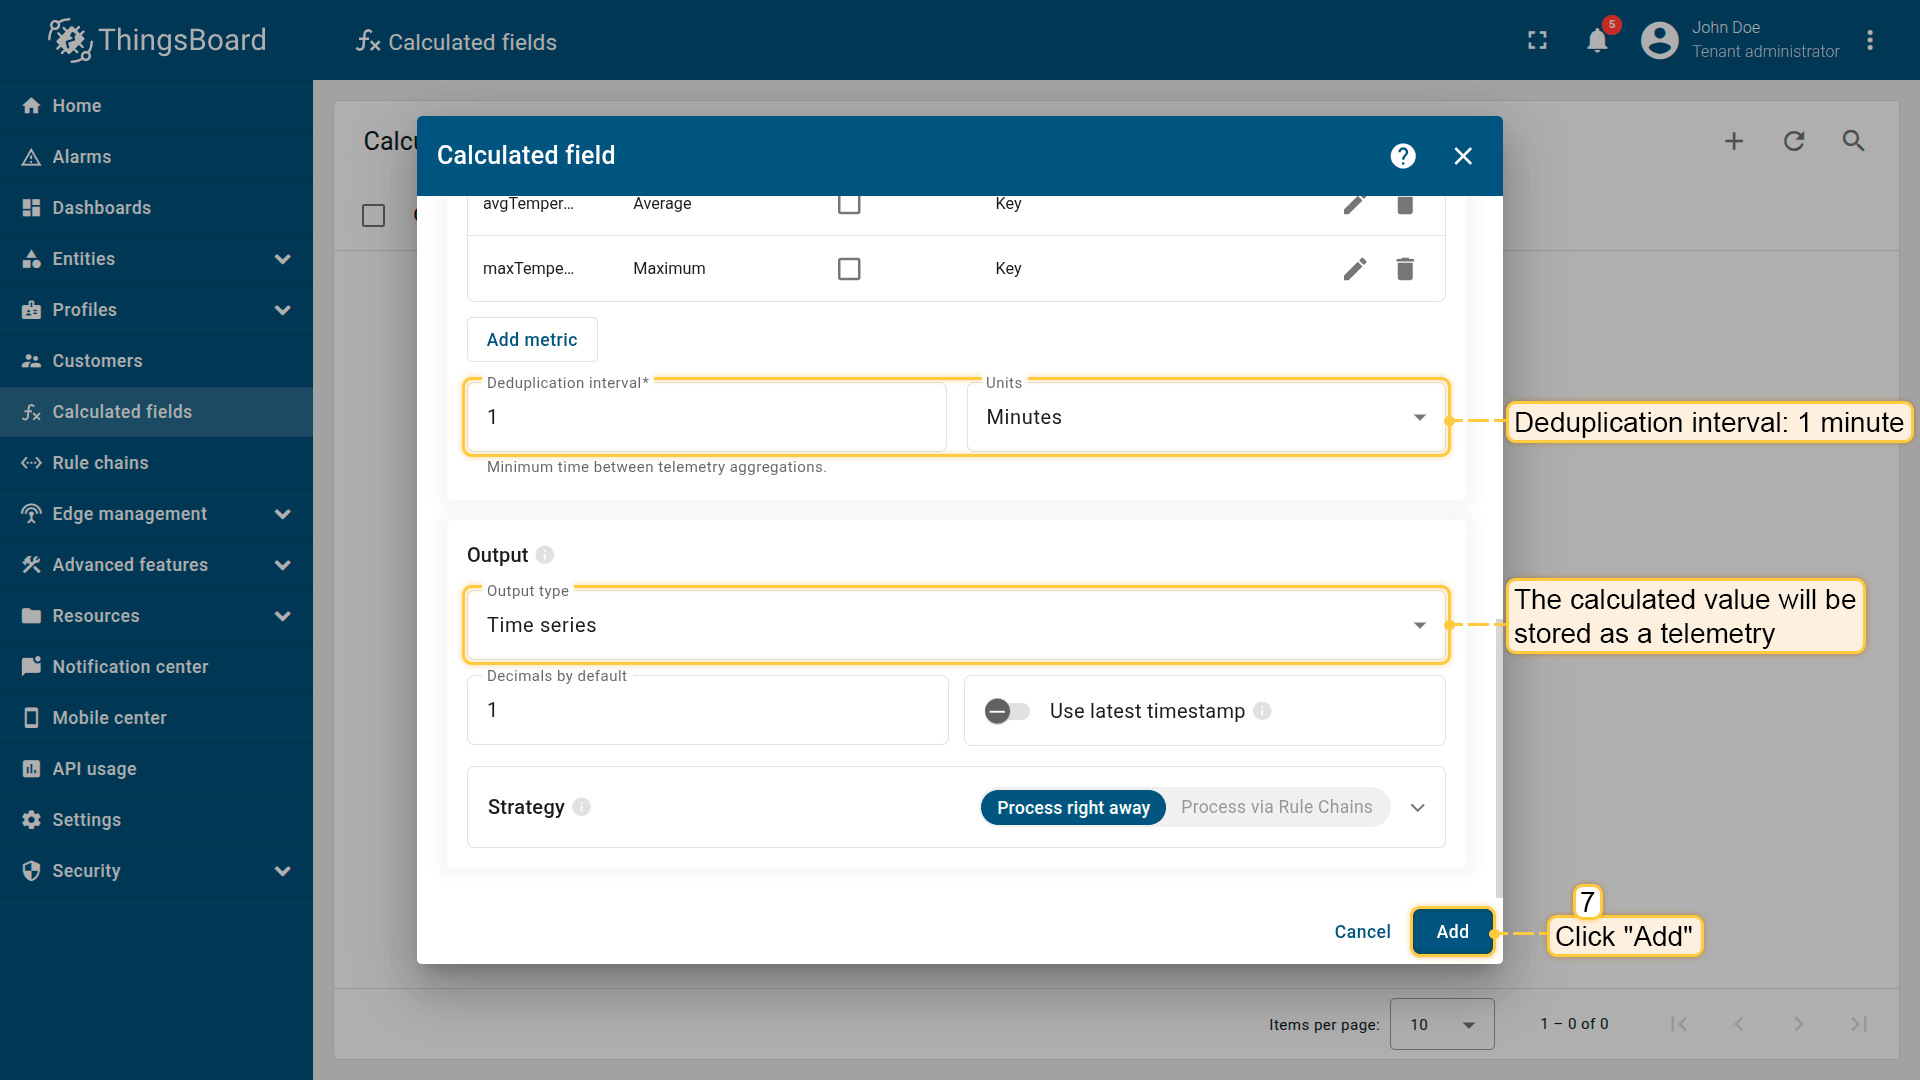
Deduplication interval: 10 seconds.
The output value will be stored as a telemetry. Click Add to save the calculation field.
(Optional) Enable Debug mode and review execution events using the Events icon.
Result
The Building A asset stores aggregated telemetry such as:
- avgTemperature — average temperature across all sensors
- maxTemperature — maximum temperature reported by any sensor
Example:
1
{ "avgTemperature": 22.7, "maxTemperature": 25.1 }
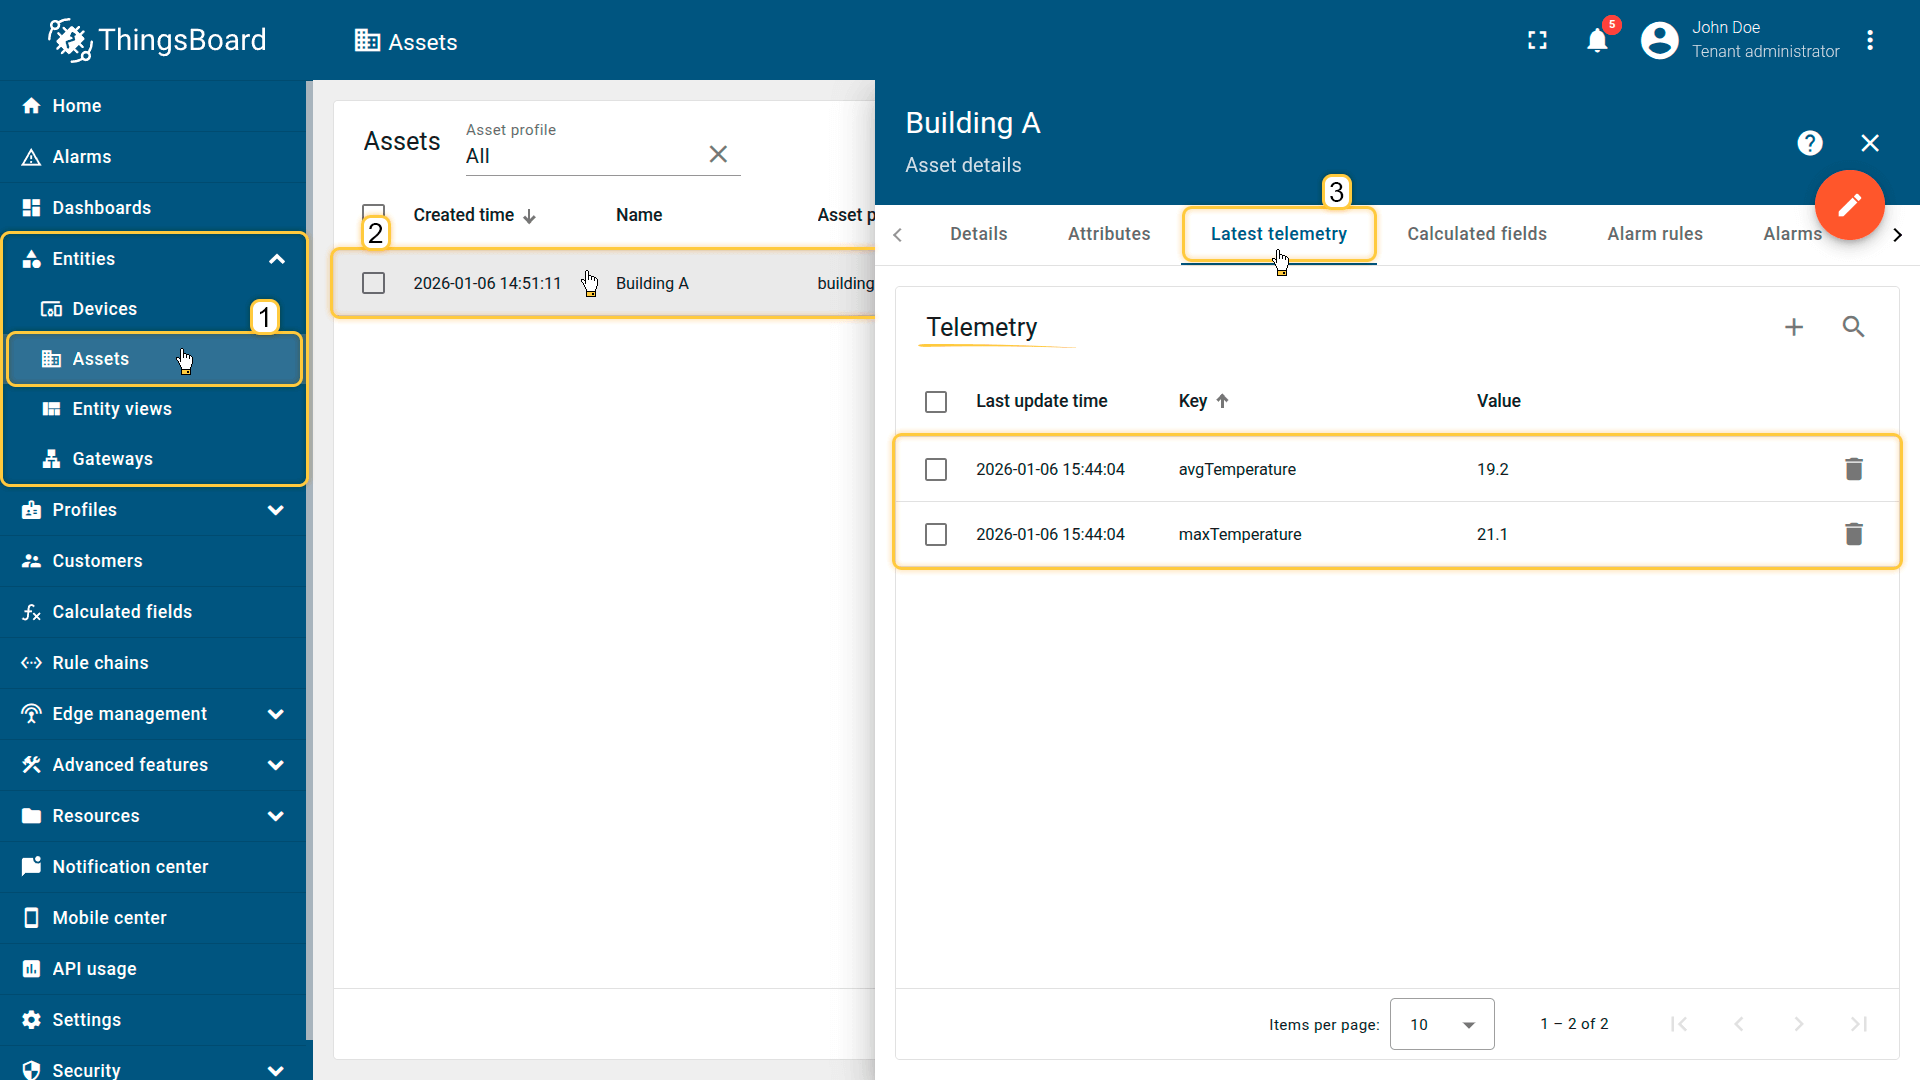
The Building A asset stores the aggregated telemetry values, such as:
- avgTemperature — average temperature across all sensors
- maxTemperature — maximum temperature measured by one of the sensors
Your feedback
Don't hesitate to star ThingsBoard on github to help us spread the word. If you have any questions about this sample, please contact us.