Calculated fields in Trendz offer the ability to compute various metrics based on existing telemetry and attributes. These metrics can serve different purposes, from visualization in reports to triggering actions or reuse in other computations. What’s more, Trendz allows you to save these calculated metrics as device or asset telemetry back to ThingsBoard, enhancing the functionality of your IoT application. Let’s explore a few examples of how this feature can be utilized:
- By using the calculated metrics as input parameters for further calculations or predictions, you can enhance the accuracy and effectiveness of subsequent analyses. This empowers you to make more informed decisions based on reliable data.
- Creating alarms based on the calculated telemetry enables proactive monitoring and timely response. By setting thresholds or conditions, you can trigger alerts when the calculated values reach critical levels. This ensures that appropriate actions are taken promptly.
- Utilizing the calculated telemetry, you can set up notifications that provide real-time updates or alerts to relevant stakeholders.
- Performance Optimization - Once the metrics are computed and saved as telemetry, you can optimize the performance of the Trendz server. Instead of loading raw telemetry and recomputing metrics each time when they are required, the pre-computed metrics can be loaded directly from ThingsBoard. This reduces the load on the server, resulting in faster and more efficient operations.
Calculation Jobs
When you save a calculated field, it can be activated to initiate two main tasks and store the data in ThingsBoard as telemetry:
- Reprocess Historical Data:
- This task runs once to analyze the data within the chosen time frame.
- It starts immediately after activation.
- Real-Time Refresh:
- This task allows you to specify the data update frequency and select items to be refreshed.
- The task is scheduled to run at regular intervals, ensuring the data remains current in real-time.
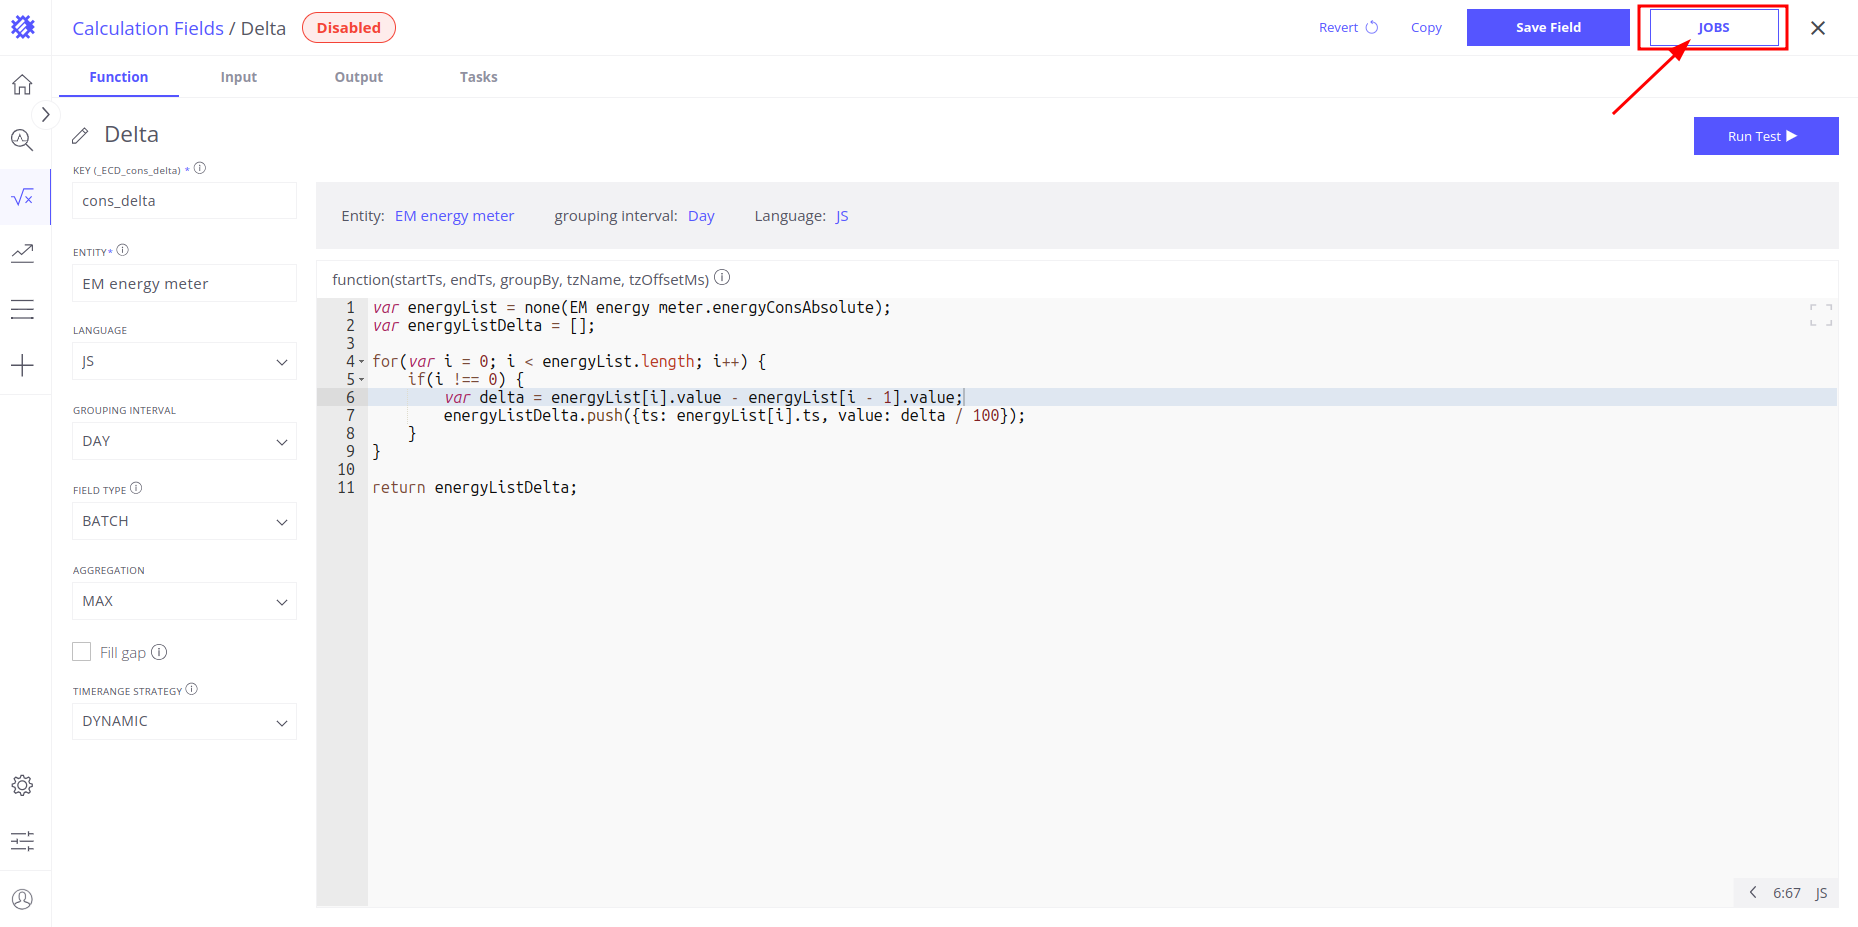
To schedule a task for saving calculation results, follow these steps:
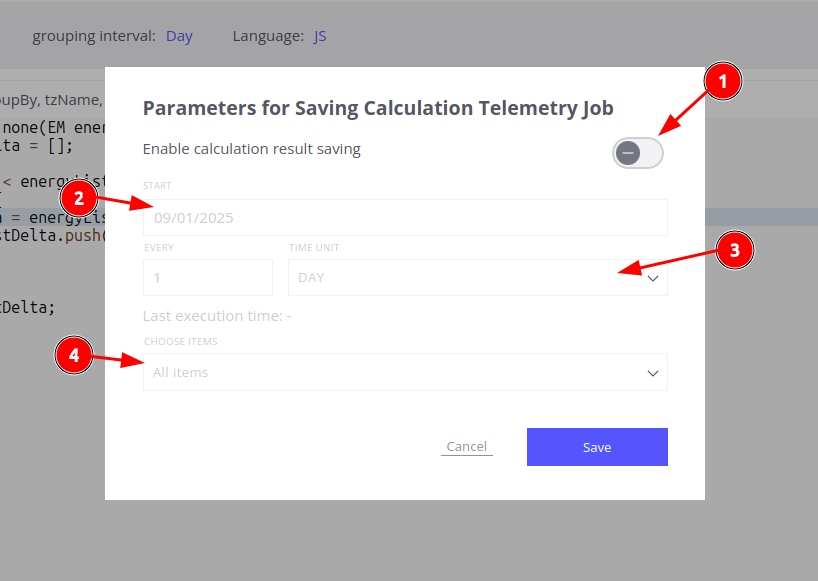
- Click on the JOBS button to open the Parameters for Saving Calculation Telemetry Job modal.
- In the modal, you can configure the following parameters:
- Enable/disable saving calculation results to ThingsBoard.
- Specify the starting point for saving the calculated telemetry.
- Define how often the telemetry should be updated.
- Select the specific devices for which the calculated telemetry will be saved.
- After configuring the parameters, click Save to apply the changes.
Storing Calculations as Telemetry
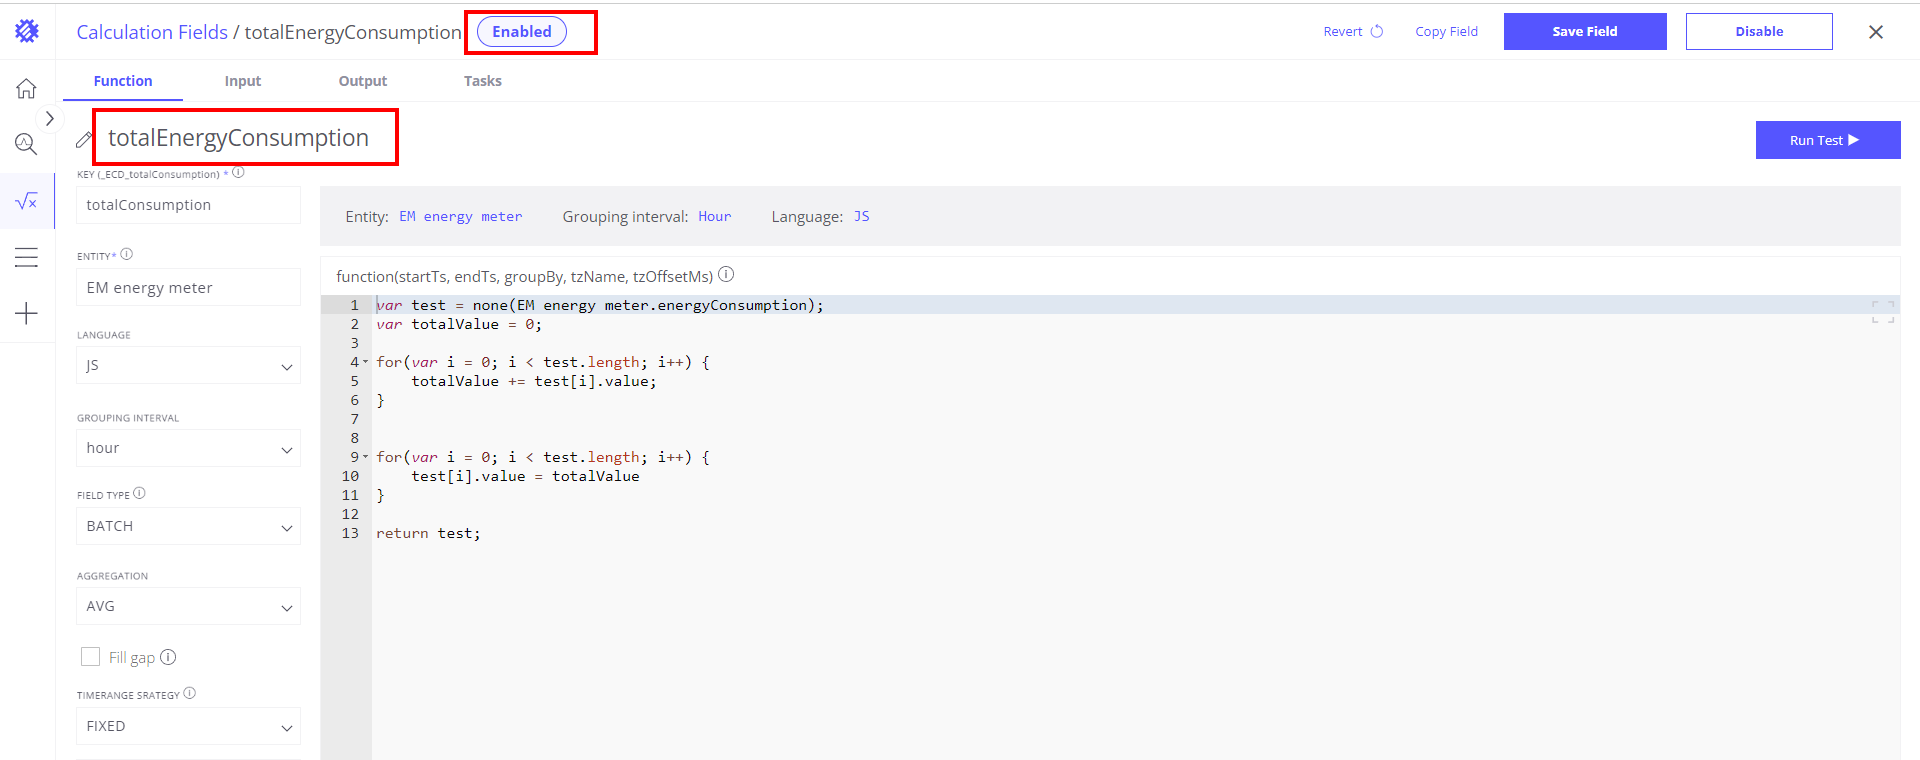
When these settings are saved, your calculations are recorded in ThingsBoard as telemetry with a key name prefixed by _ECD_, and the status of the calculation is set to “enabled”
The data generated appears in the construction of view fields in the list of business entities under the name assigned to the calculation at the time of creation and, if activated, will be updated according to the specified frequency when creating the task. The created calculation will appear in the view fields under the name given to the calculation during its creation.
If the calculation is not activated, it can still be used when constructing view fields, but users will receive a reminder indicating that no task has been created for this calculation.
You can activate the calculated field at any time after saving by using the ENABLE button.
Next Steps
-
Getting started guide - These guide provide quick overview of main Trendz features.
-
Installation guides - Learn how to setup ThingsBoard on various available operating systems.
-
States - Learn how to define and analyse states for assets based on raw telemetry.
-
Prediction - Learn how to make forecasts and predict telemetry behavior.
-
Anomaly Detection - Learn how to identify anomalies in the data.
-
Filters - Learn how filter dataset during analysis.
-
Available Visualizations - Learn about visualization widgets available in Trendz and how to configure them.
-
Share and embed Visualizations - Learn how to add Trendz visualizations on ThingsBoard dashboard or 3rd party web pages.
-
AI Assistant - Learn how to utilize Trendz AI capabilities.