All metrics created with Metric Explorer can be integrated into ThingsBoard. They can be used wherever telemetry is supported:
- Visualizations
- Rule Engine
- Alarm Profiles
Trendz allows you to automatically save metrics as telemetry to ThingsBoard or generate metrics from historical data and store them as telemetry. In this guide, we explore how to configure automatic saving of metrics to ThingsBoard and how to use this telemetry in ThingsBoard.
Save to ThingsBoard
Setting up saving a metric to ThingsBoard is divided into 3 parts:
- Create a calculation field: an entity that supports telemetry save to ThingsBoard.
- Run a reprocess task to process historical data.
- Run a refresh task to automatically update telemetry.
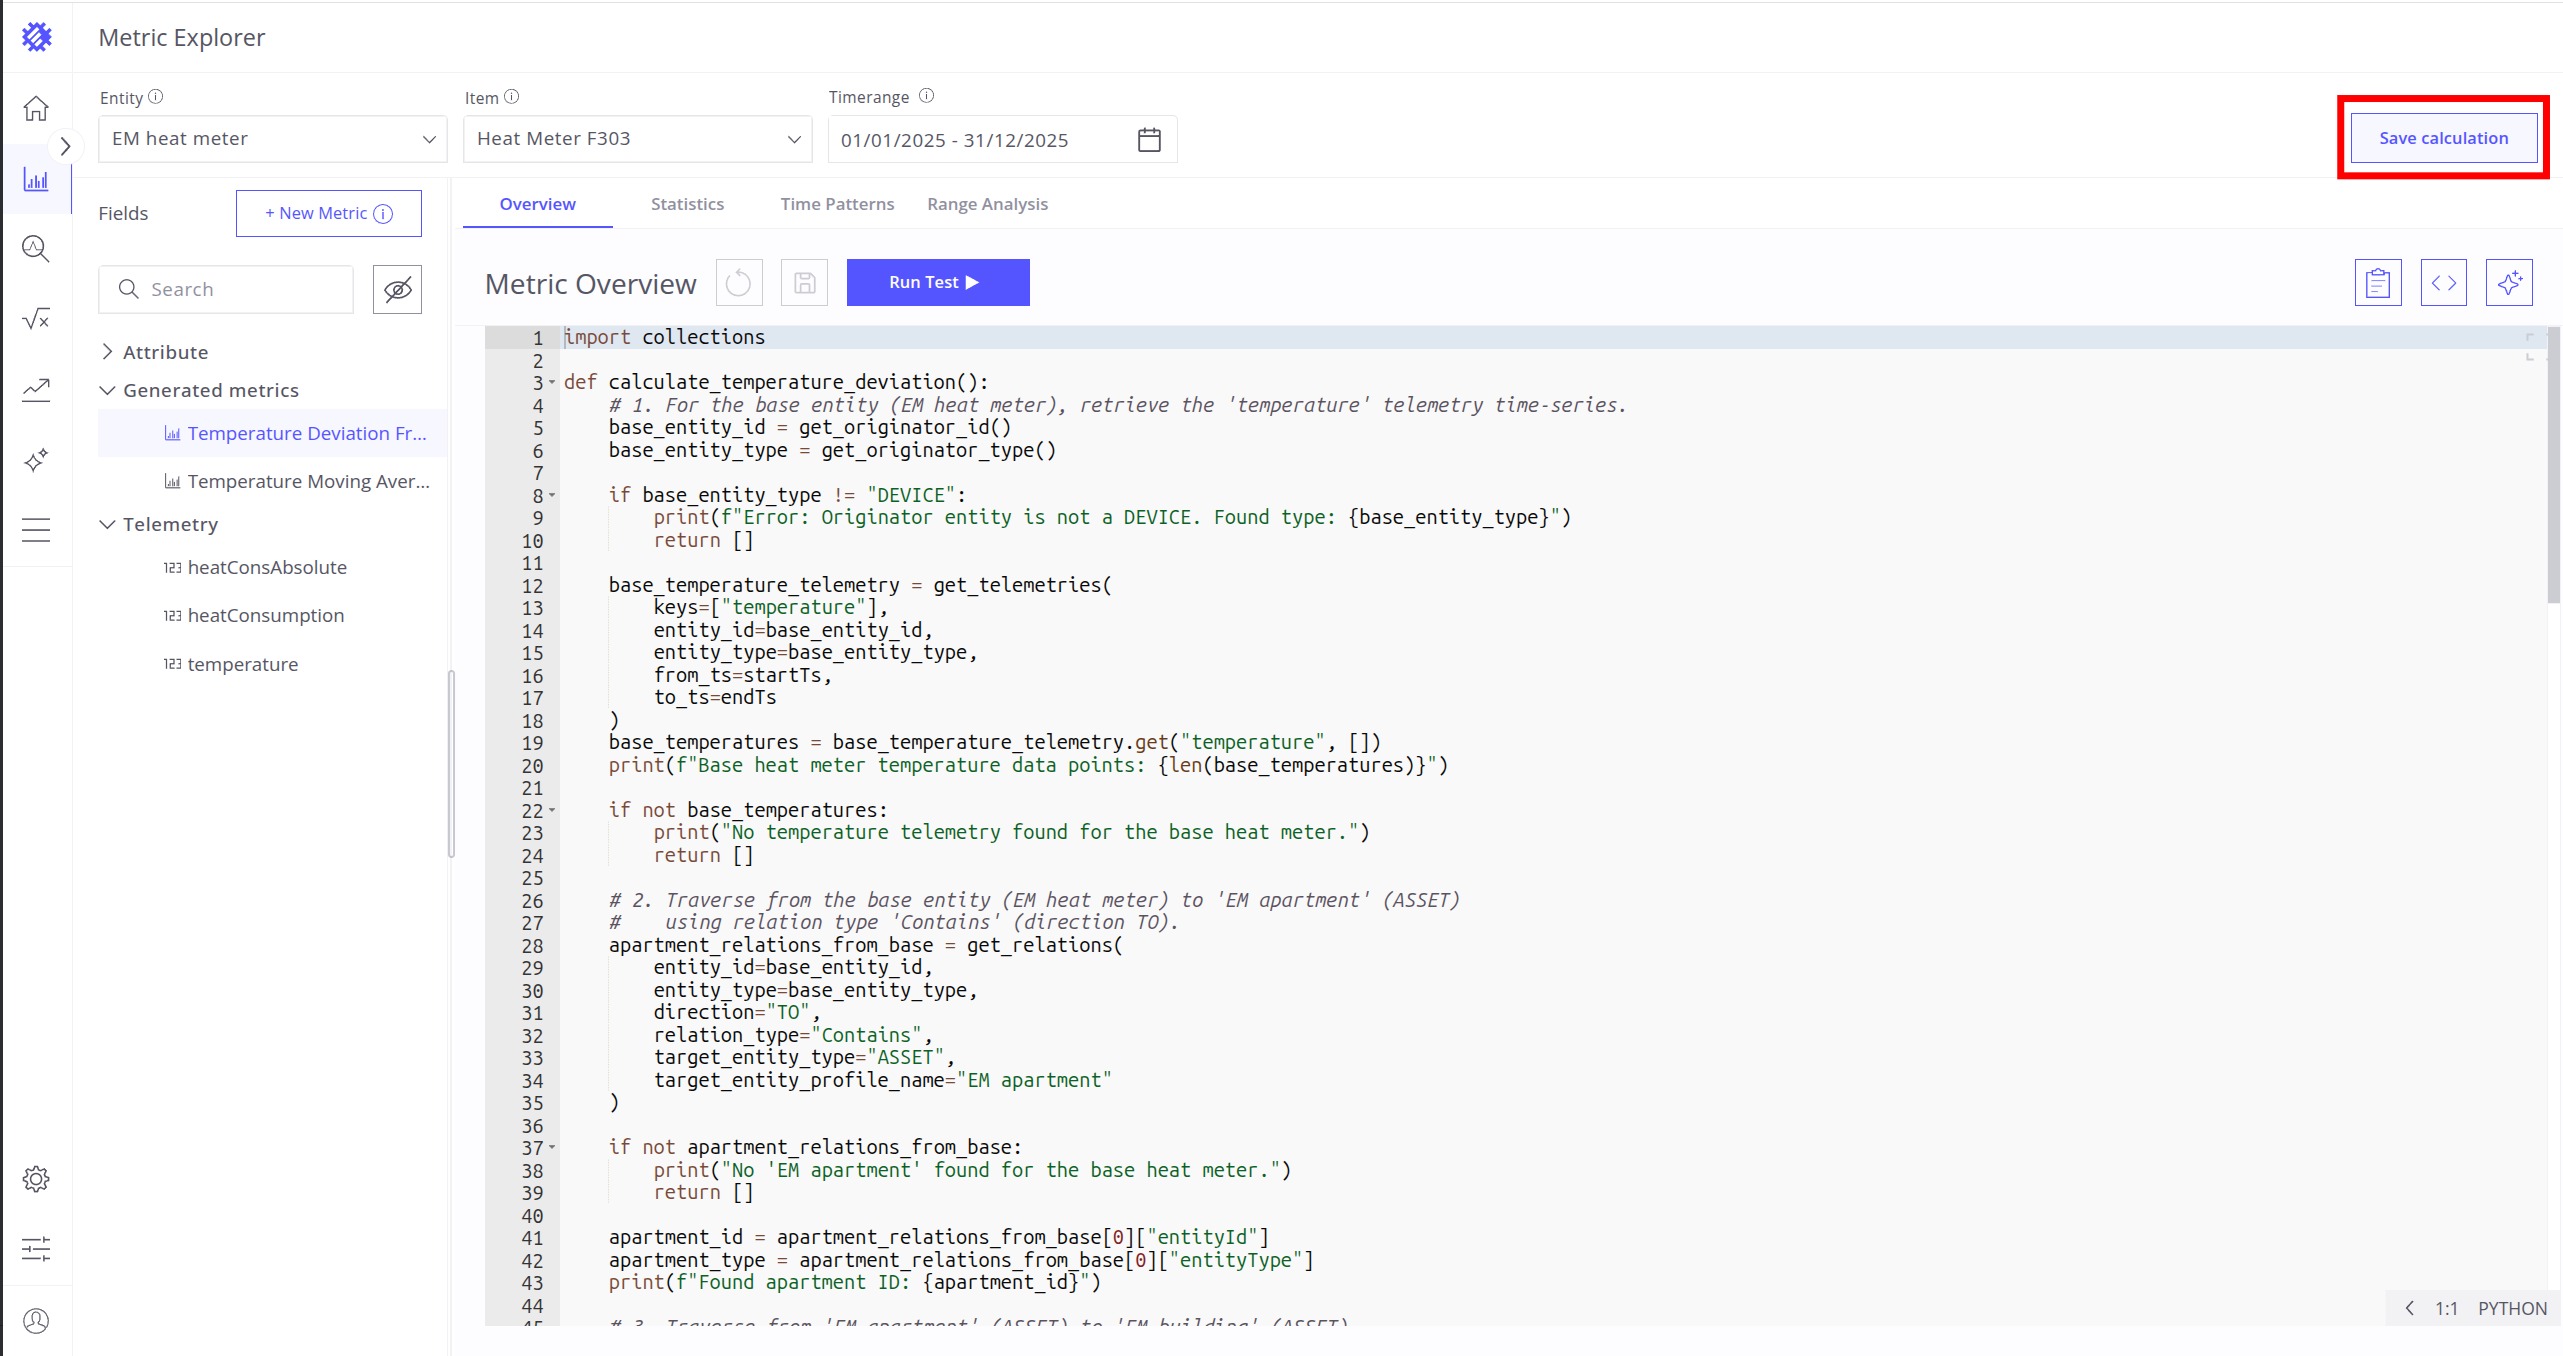
Create Calculation Field
You can create a calculation field from a metric by clicking Save Calculation.
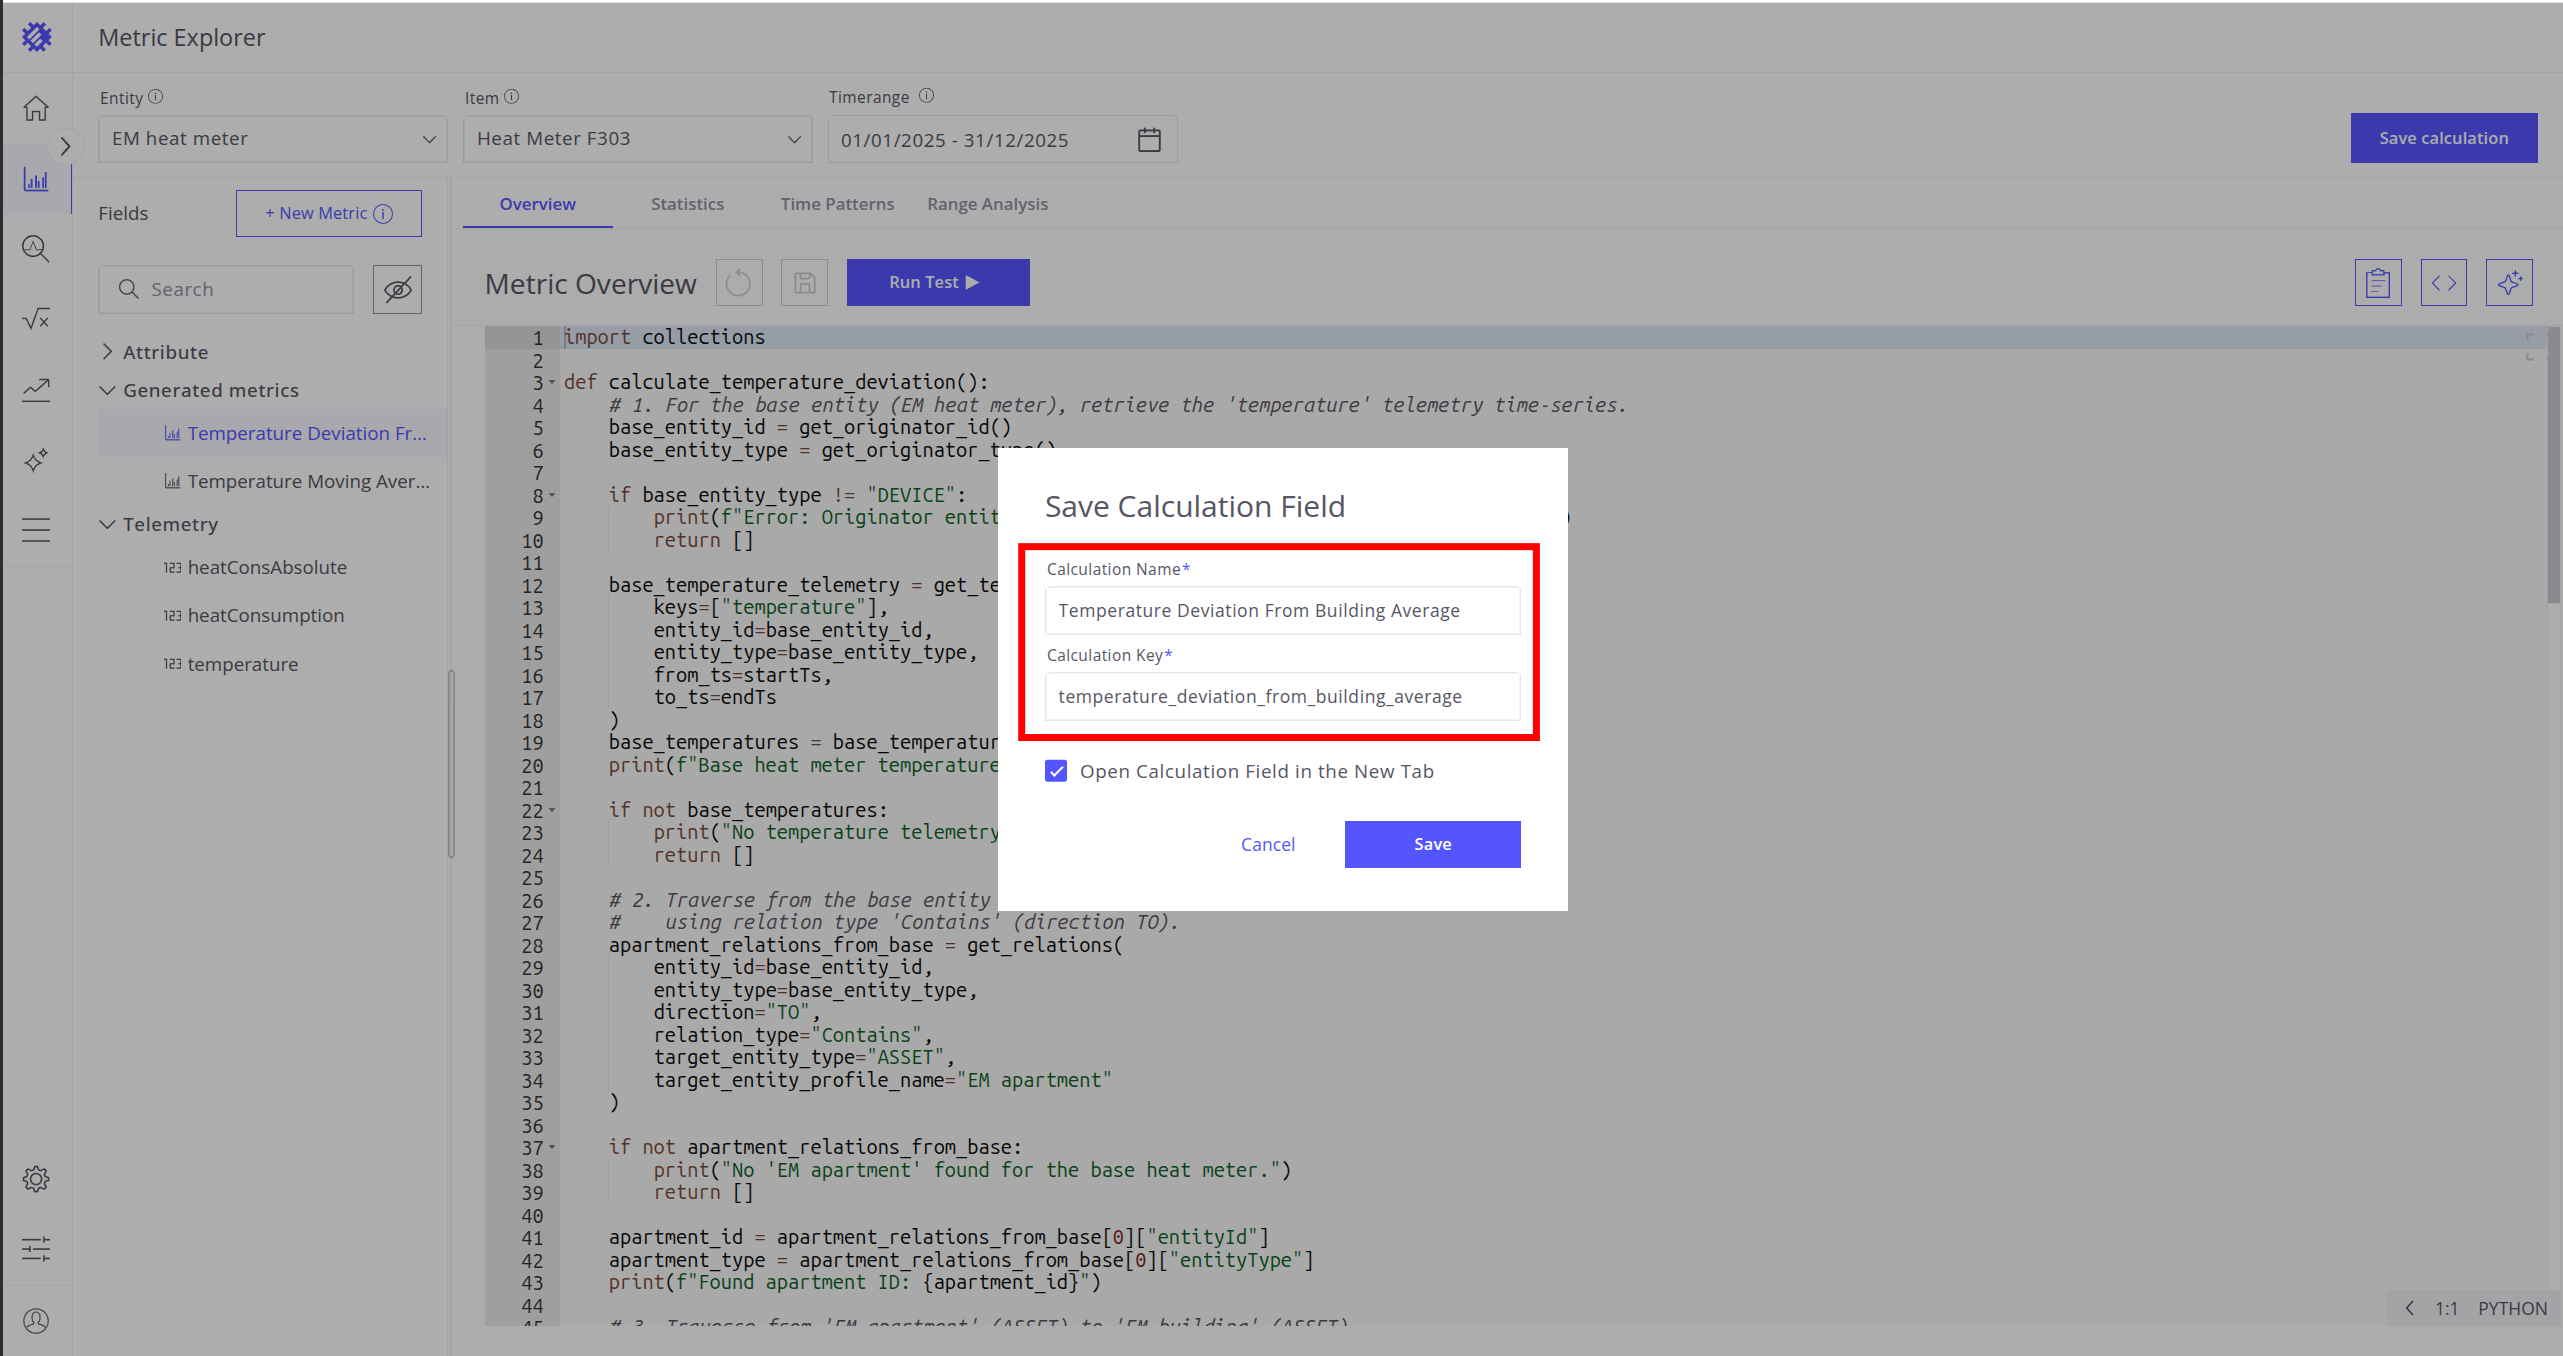
Specify the following parameters:
- Calculation Name – the name displayed in Trendz.
- Calculation Key – the telemetry key used in ThingsBoard (prefixed with
_ECD_).
Example:
If you save a calculation named Energy Consumption Rate with the key energy_consumption_rate:
- Trendz will show a new field called Energy Consumption Rate.
- Telemetry will be saved in ThingsBoard with the key
_ECD_energy_consumption_rate(once refresh and reprocess jobs are configured).
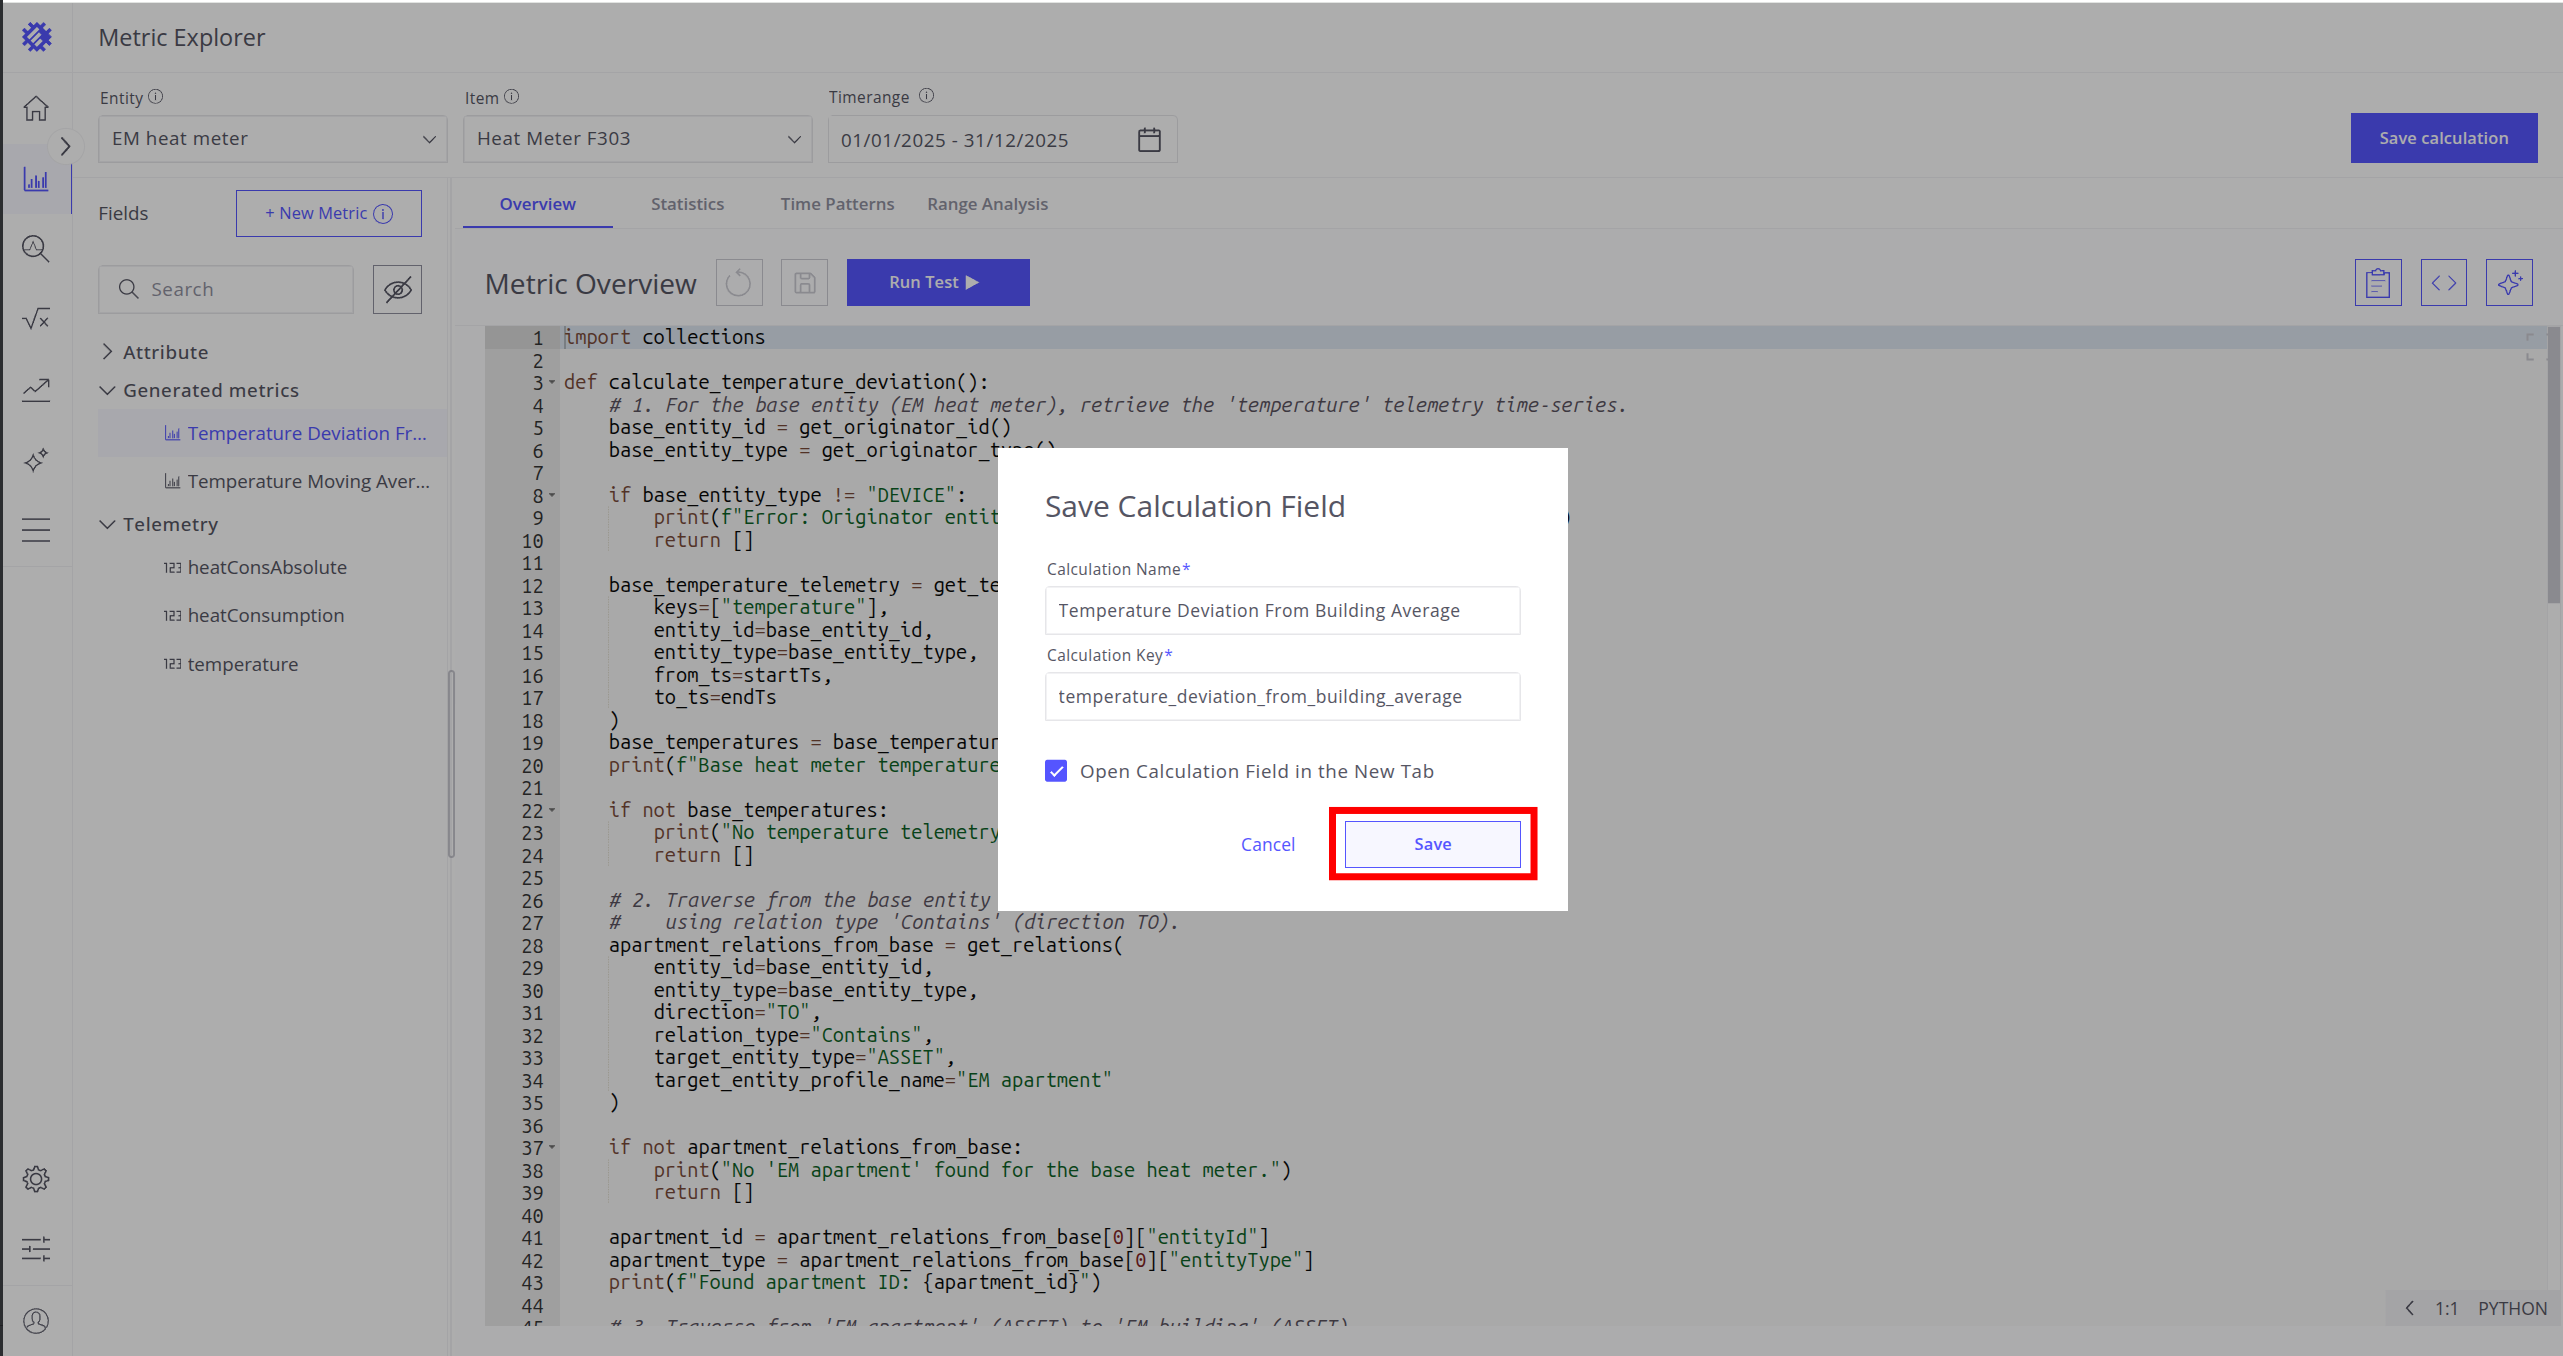
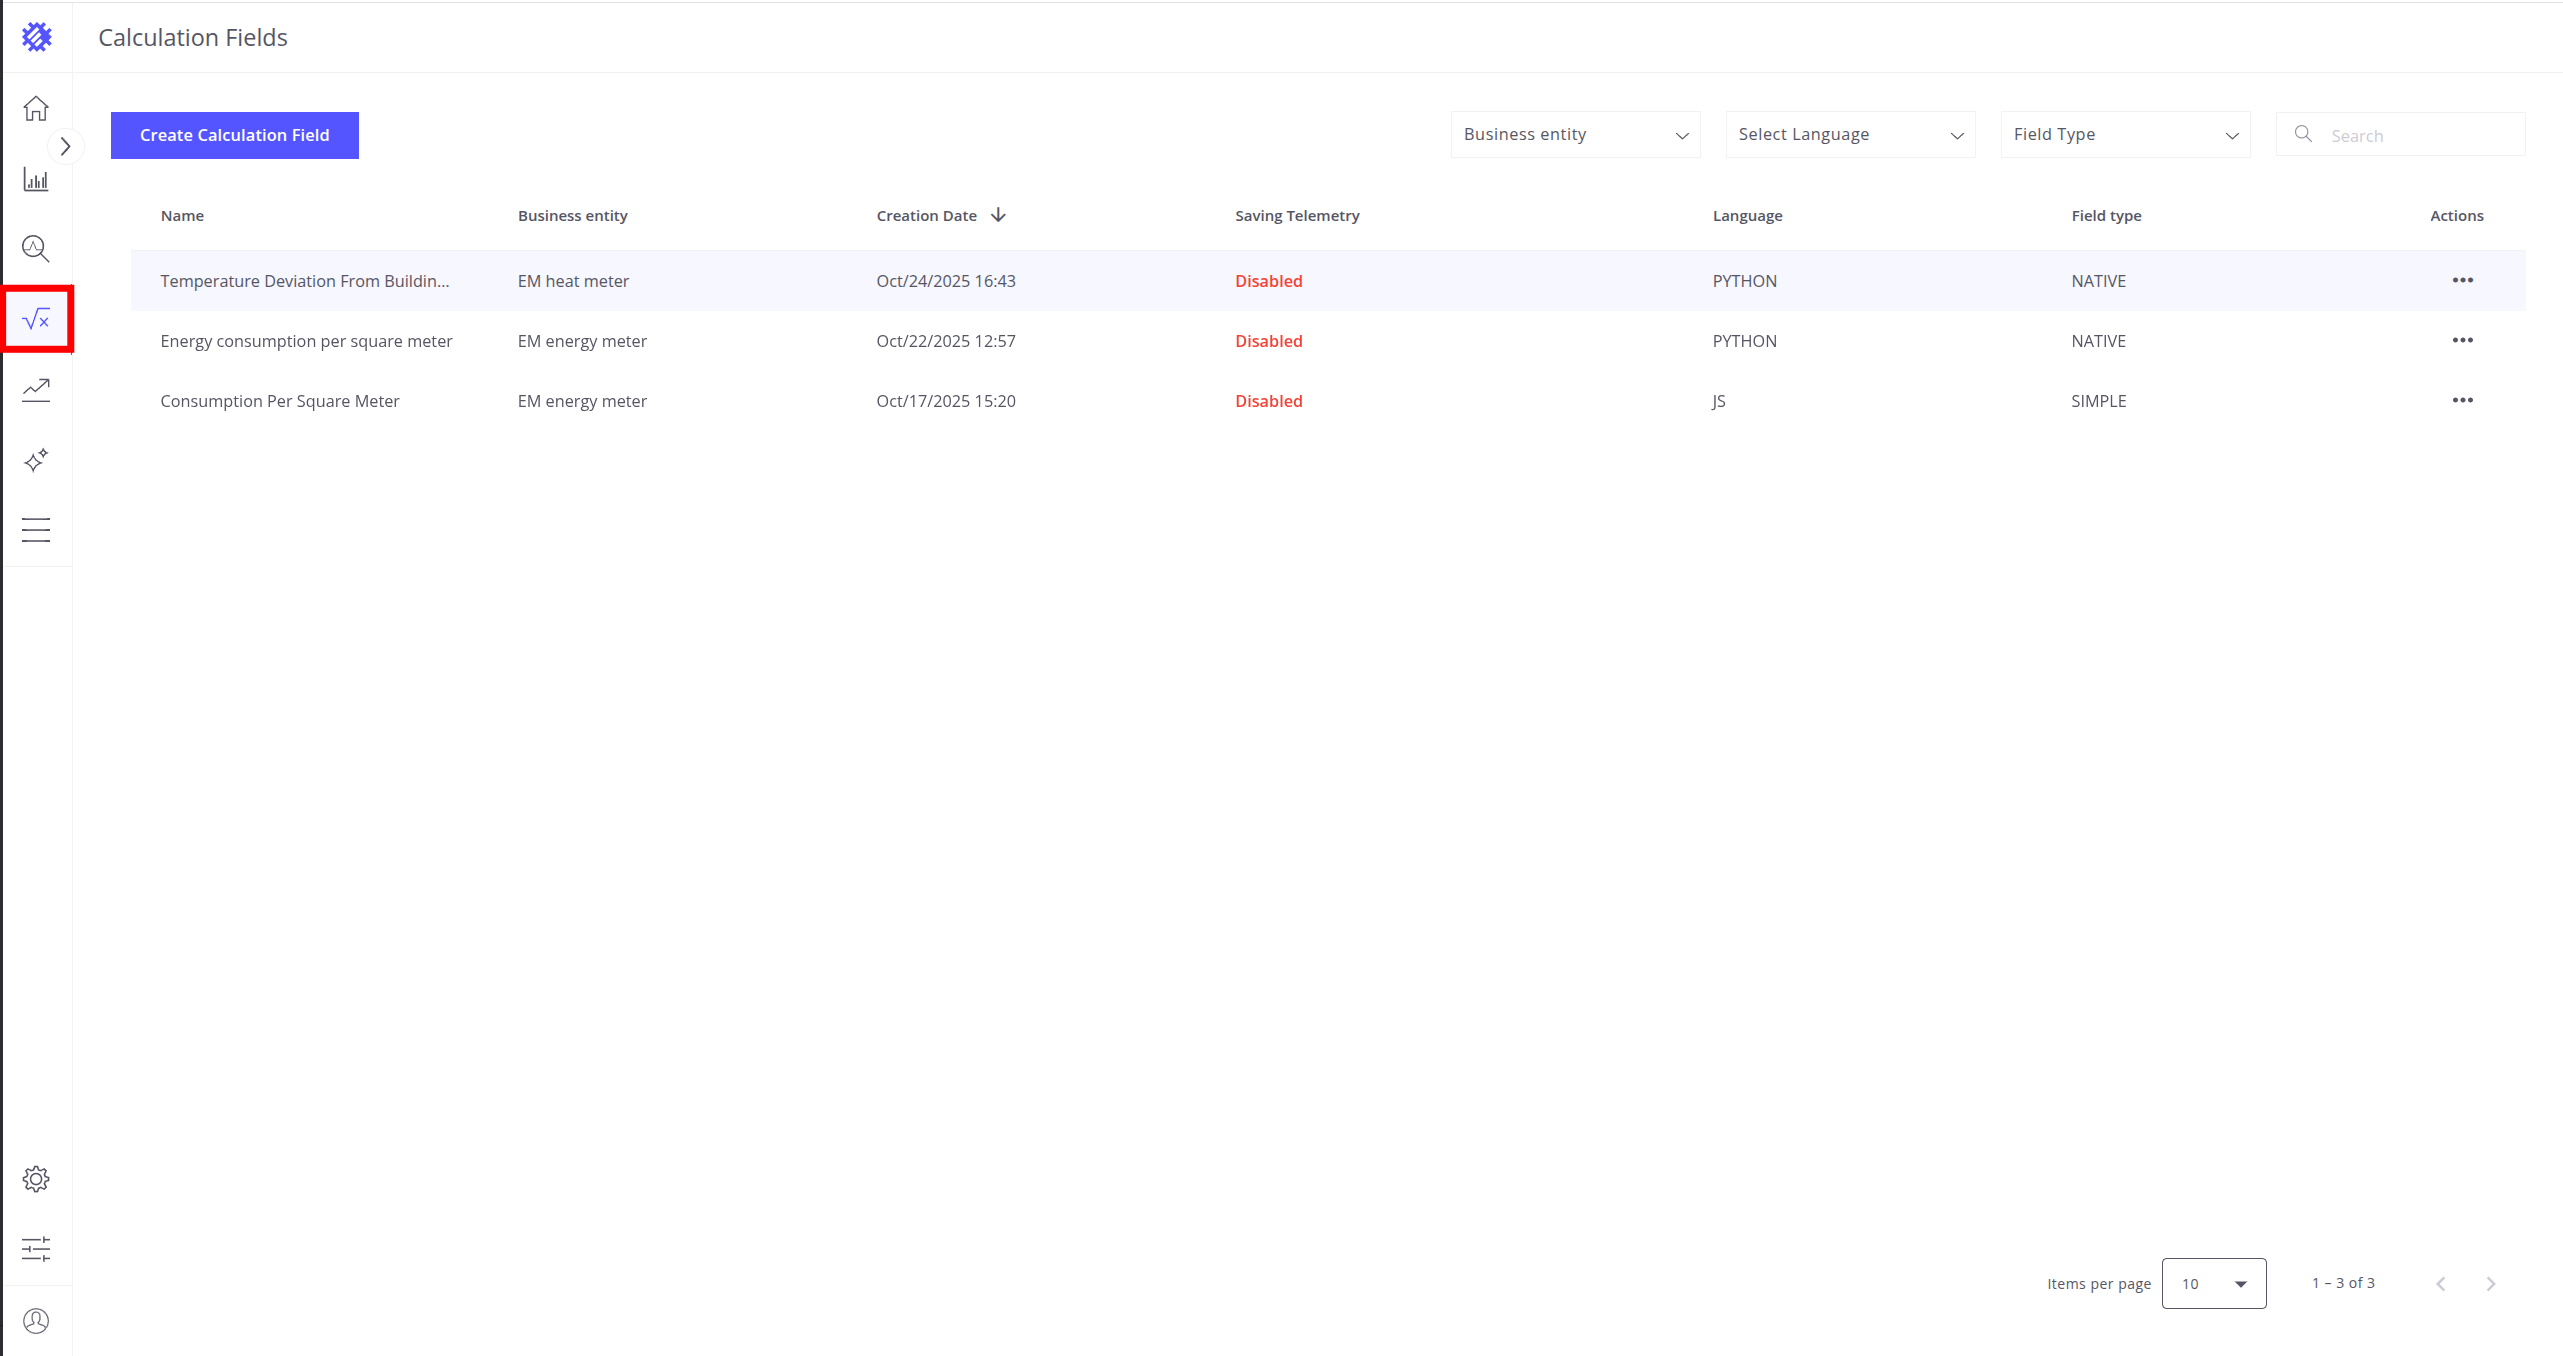
Then click Save — after that, the calculation field appears in the Calculation folder.
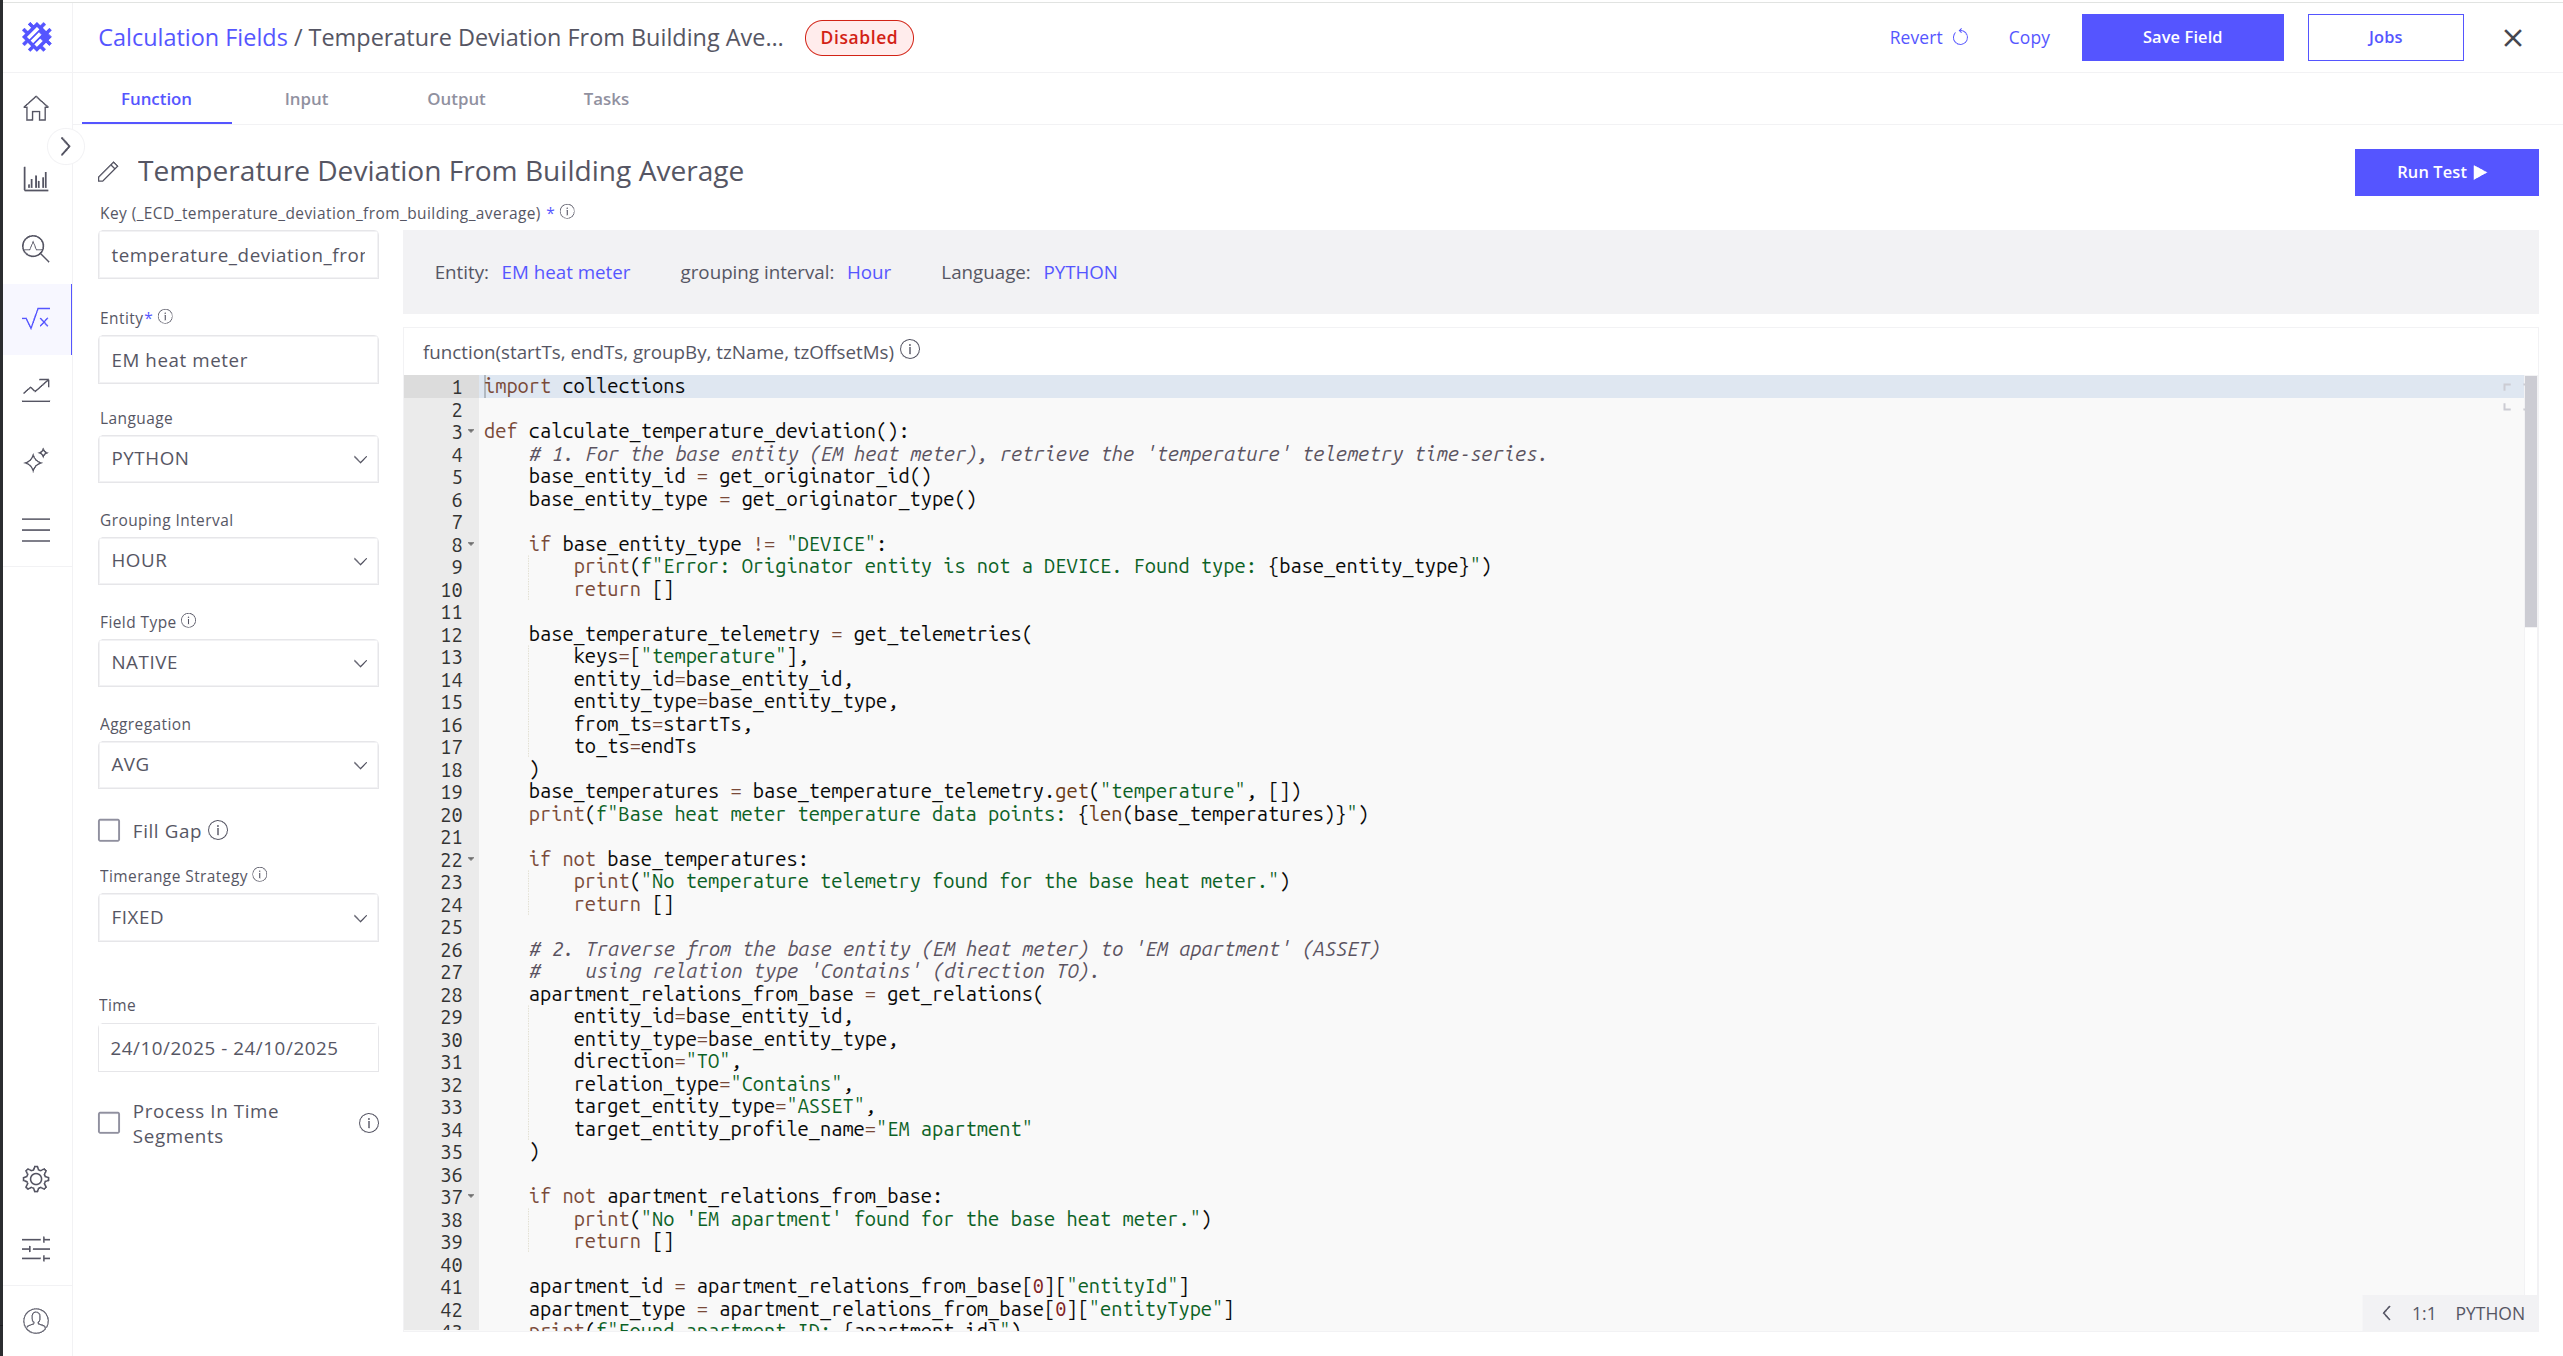
Before saving telemetry to ThingsBoard, verify the following parameters:
- Grouping Interval – defines how data is aggregated (e.g., HOUR means one point per hour in ThingsBoard).
- Aggregation – specifies how multiple values in the same interval are combined (e.g., SUM aggregates values within the same hour).
- Time – defines the time range used by refresh jobs (e.g., Last 7 Days for daily updates).
Recommended time settings:
- Today – for minute or hourly jobs.
- Last 7 Days – for daily jobs.
- Last 14 Days – for weekly jobs.
- Last 3 Months – for monthly jobs.
You can also adjust additional parameters as needed. Read more about the calculation field interface here.
Click Save Field and confirm saving by clicking the Save button to apply changes.
You will be prompted to enable the calculation field (run refresh task). You can do it right away or later.
The process of running the refresh task is described in another article.
Run Reprocess Task
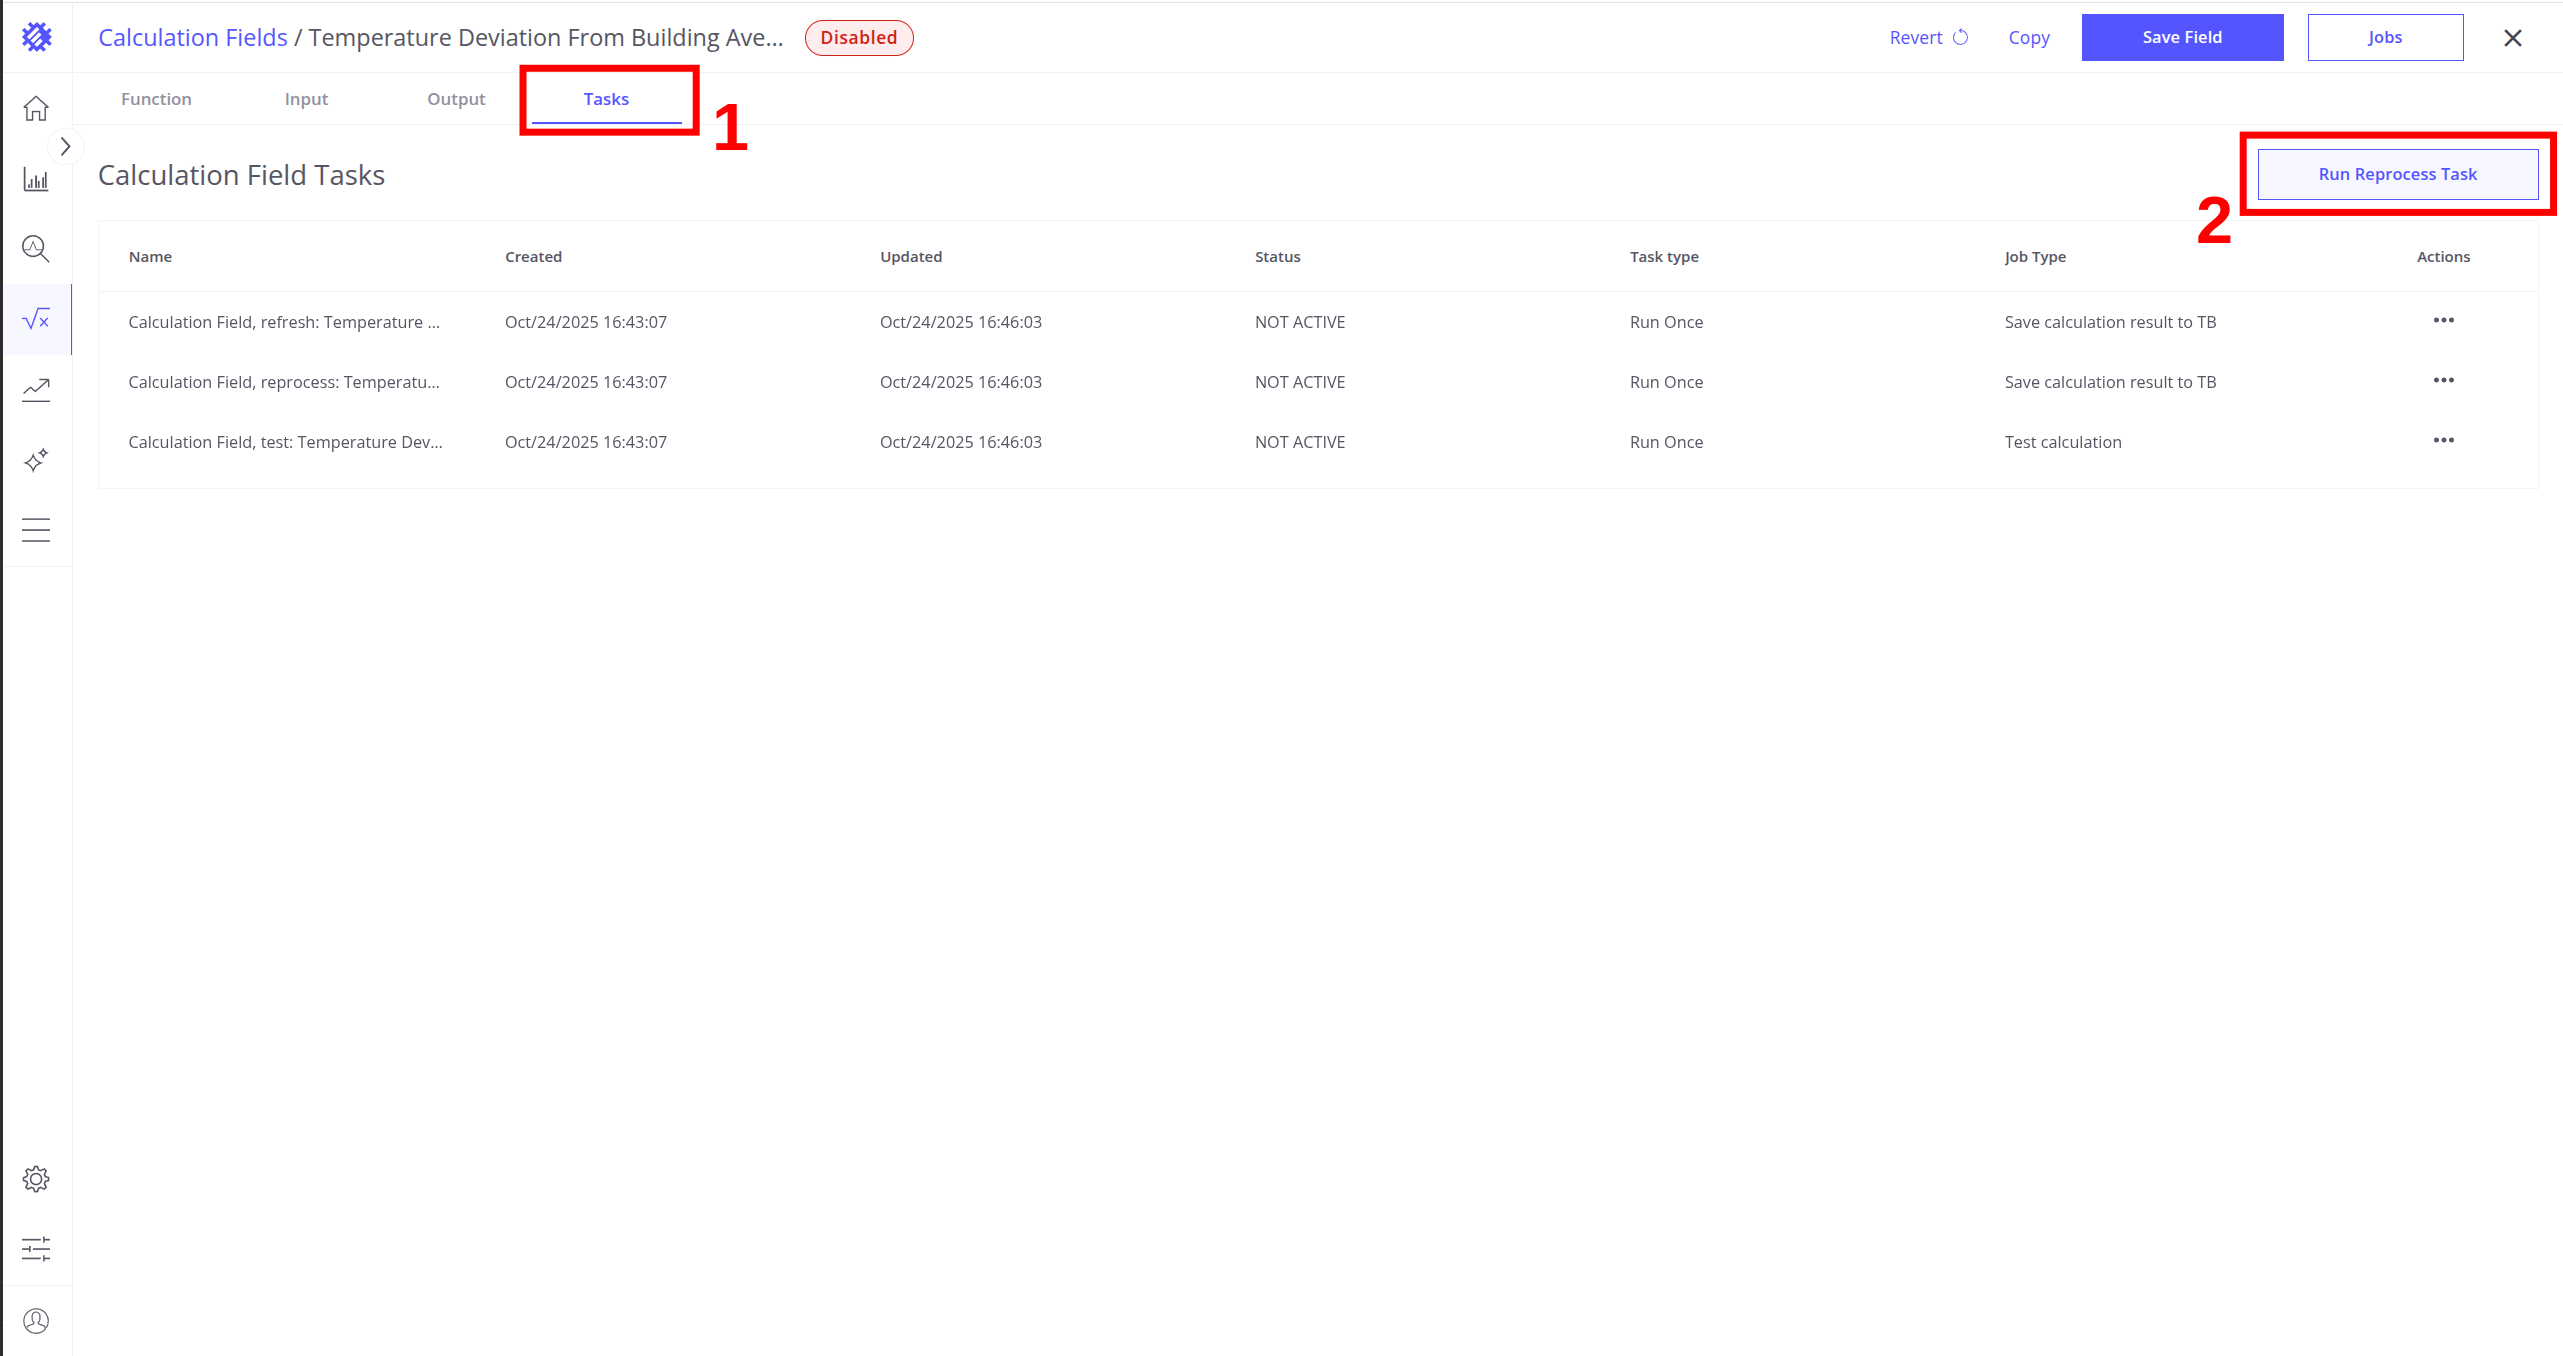
Once the calculation field is created and all parameters are set up, you can run a Reprocess Job to save historical data to ThingsBoard.
Steps:
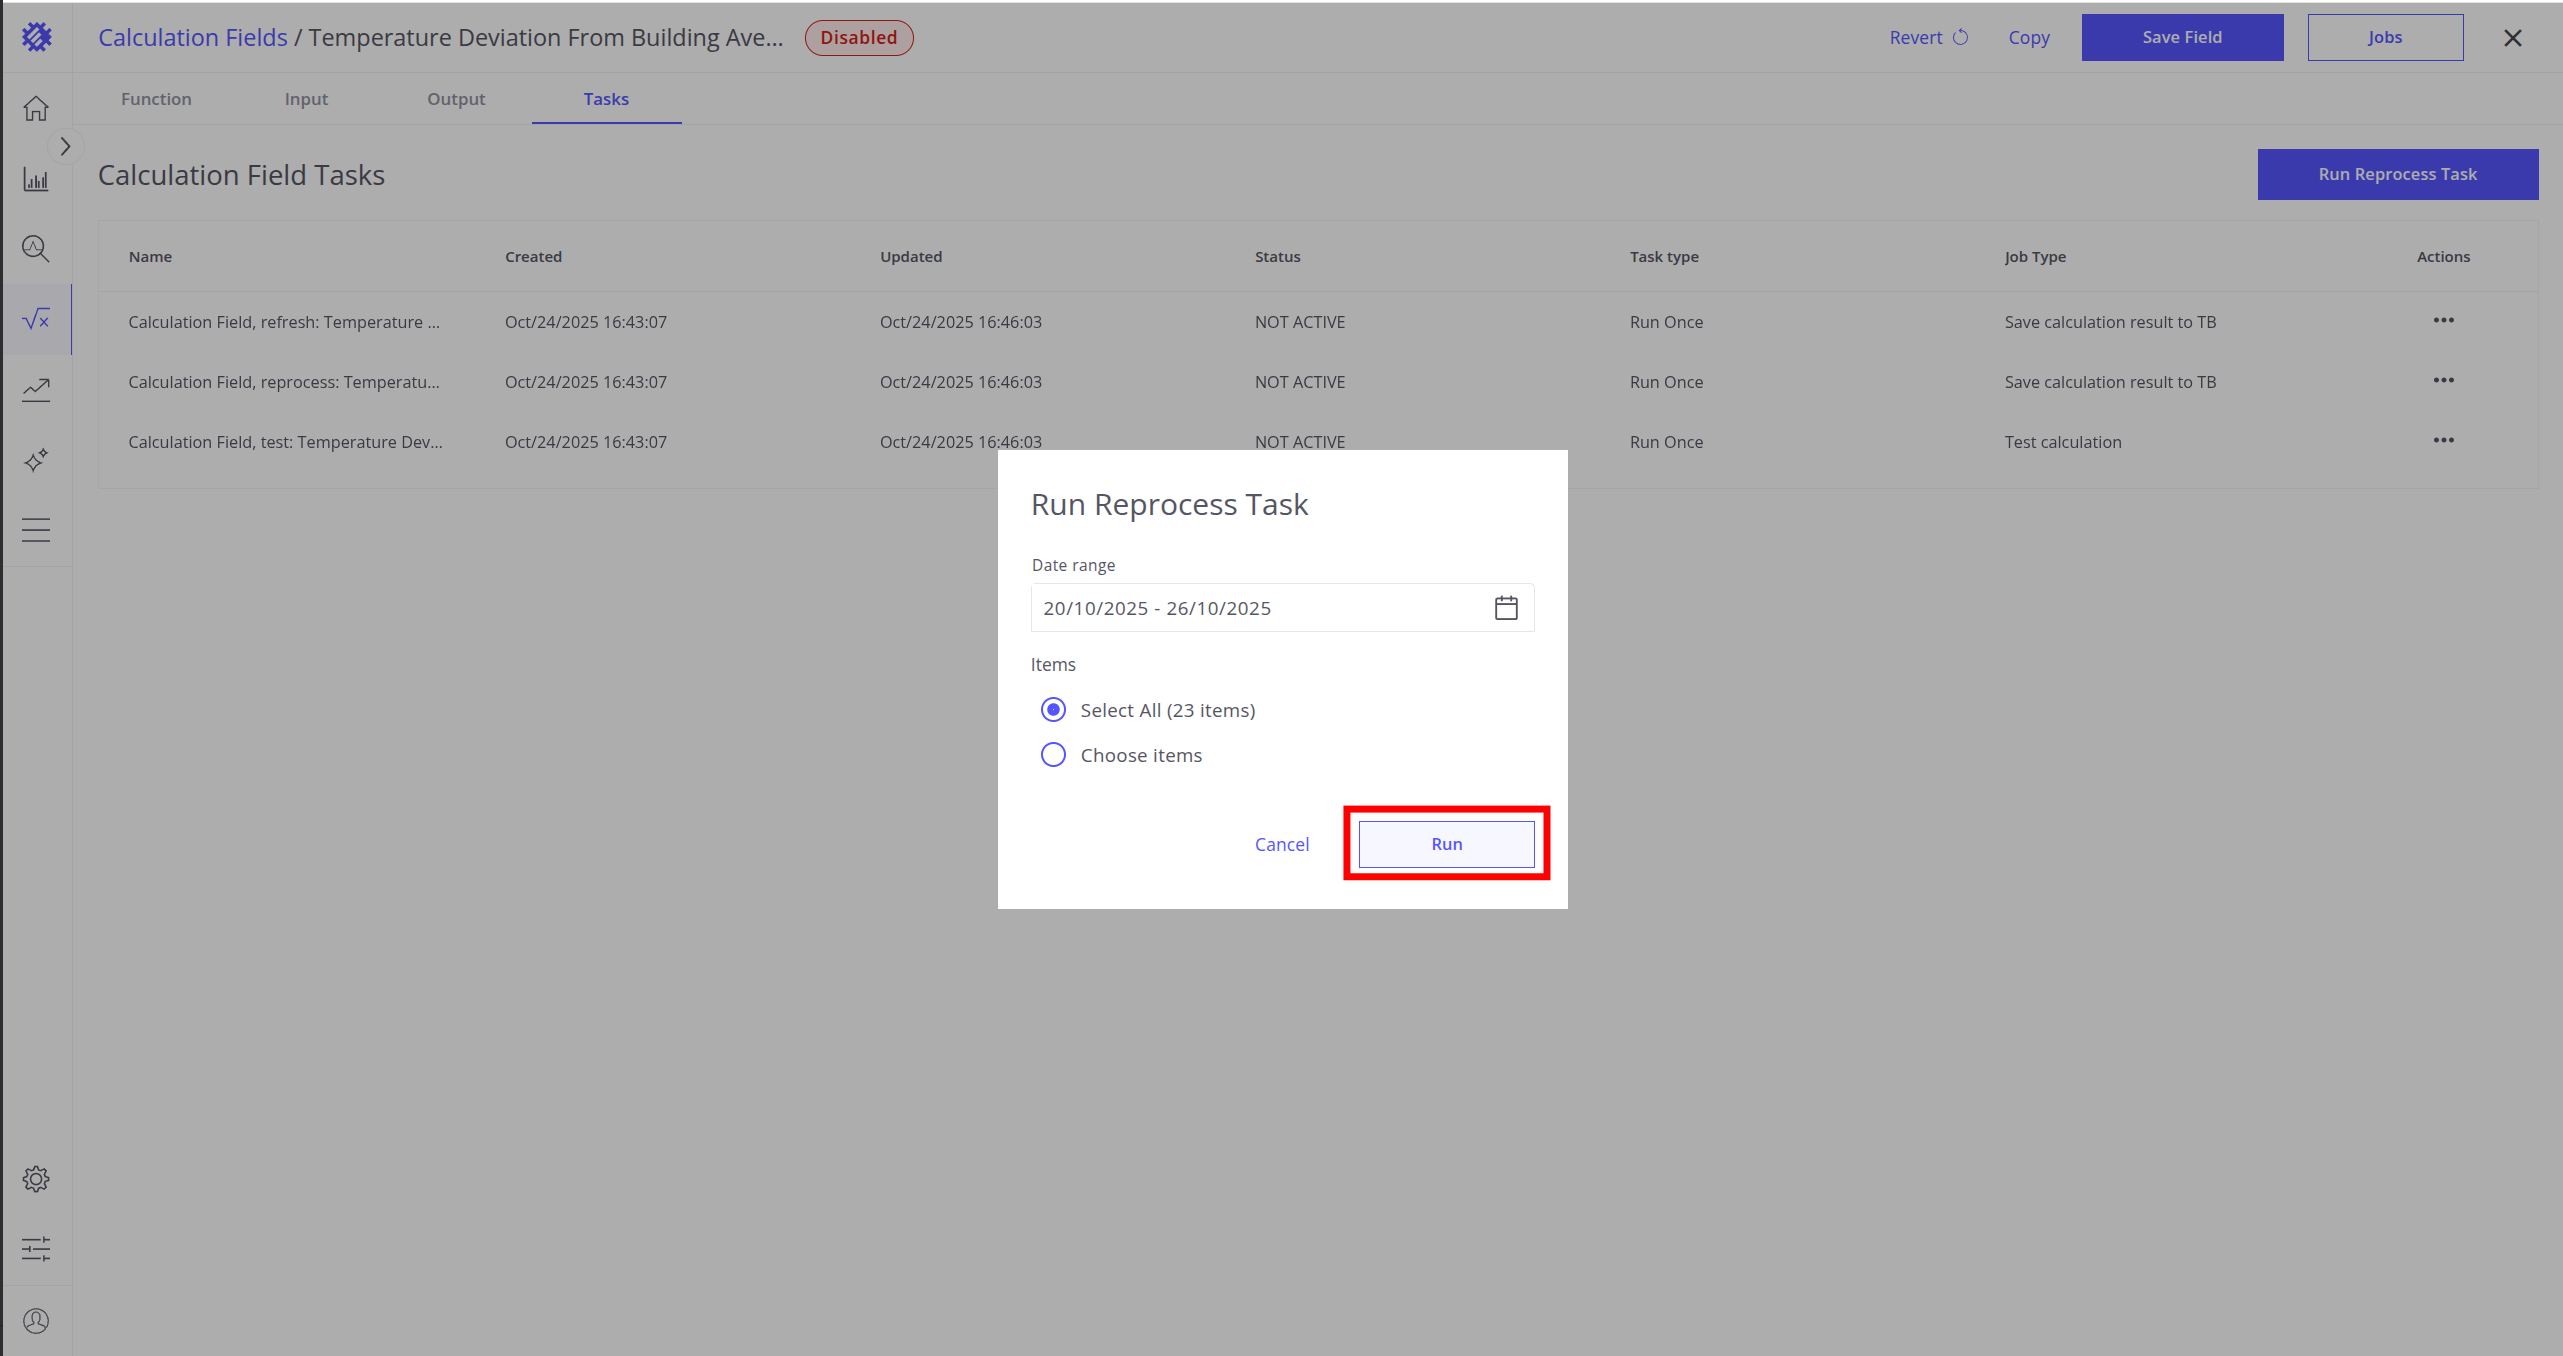
- Open the Tasks tab.
- Click Run Reprocess Task button.
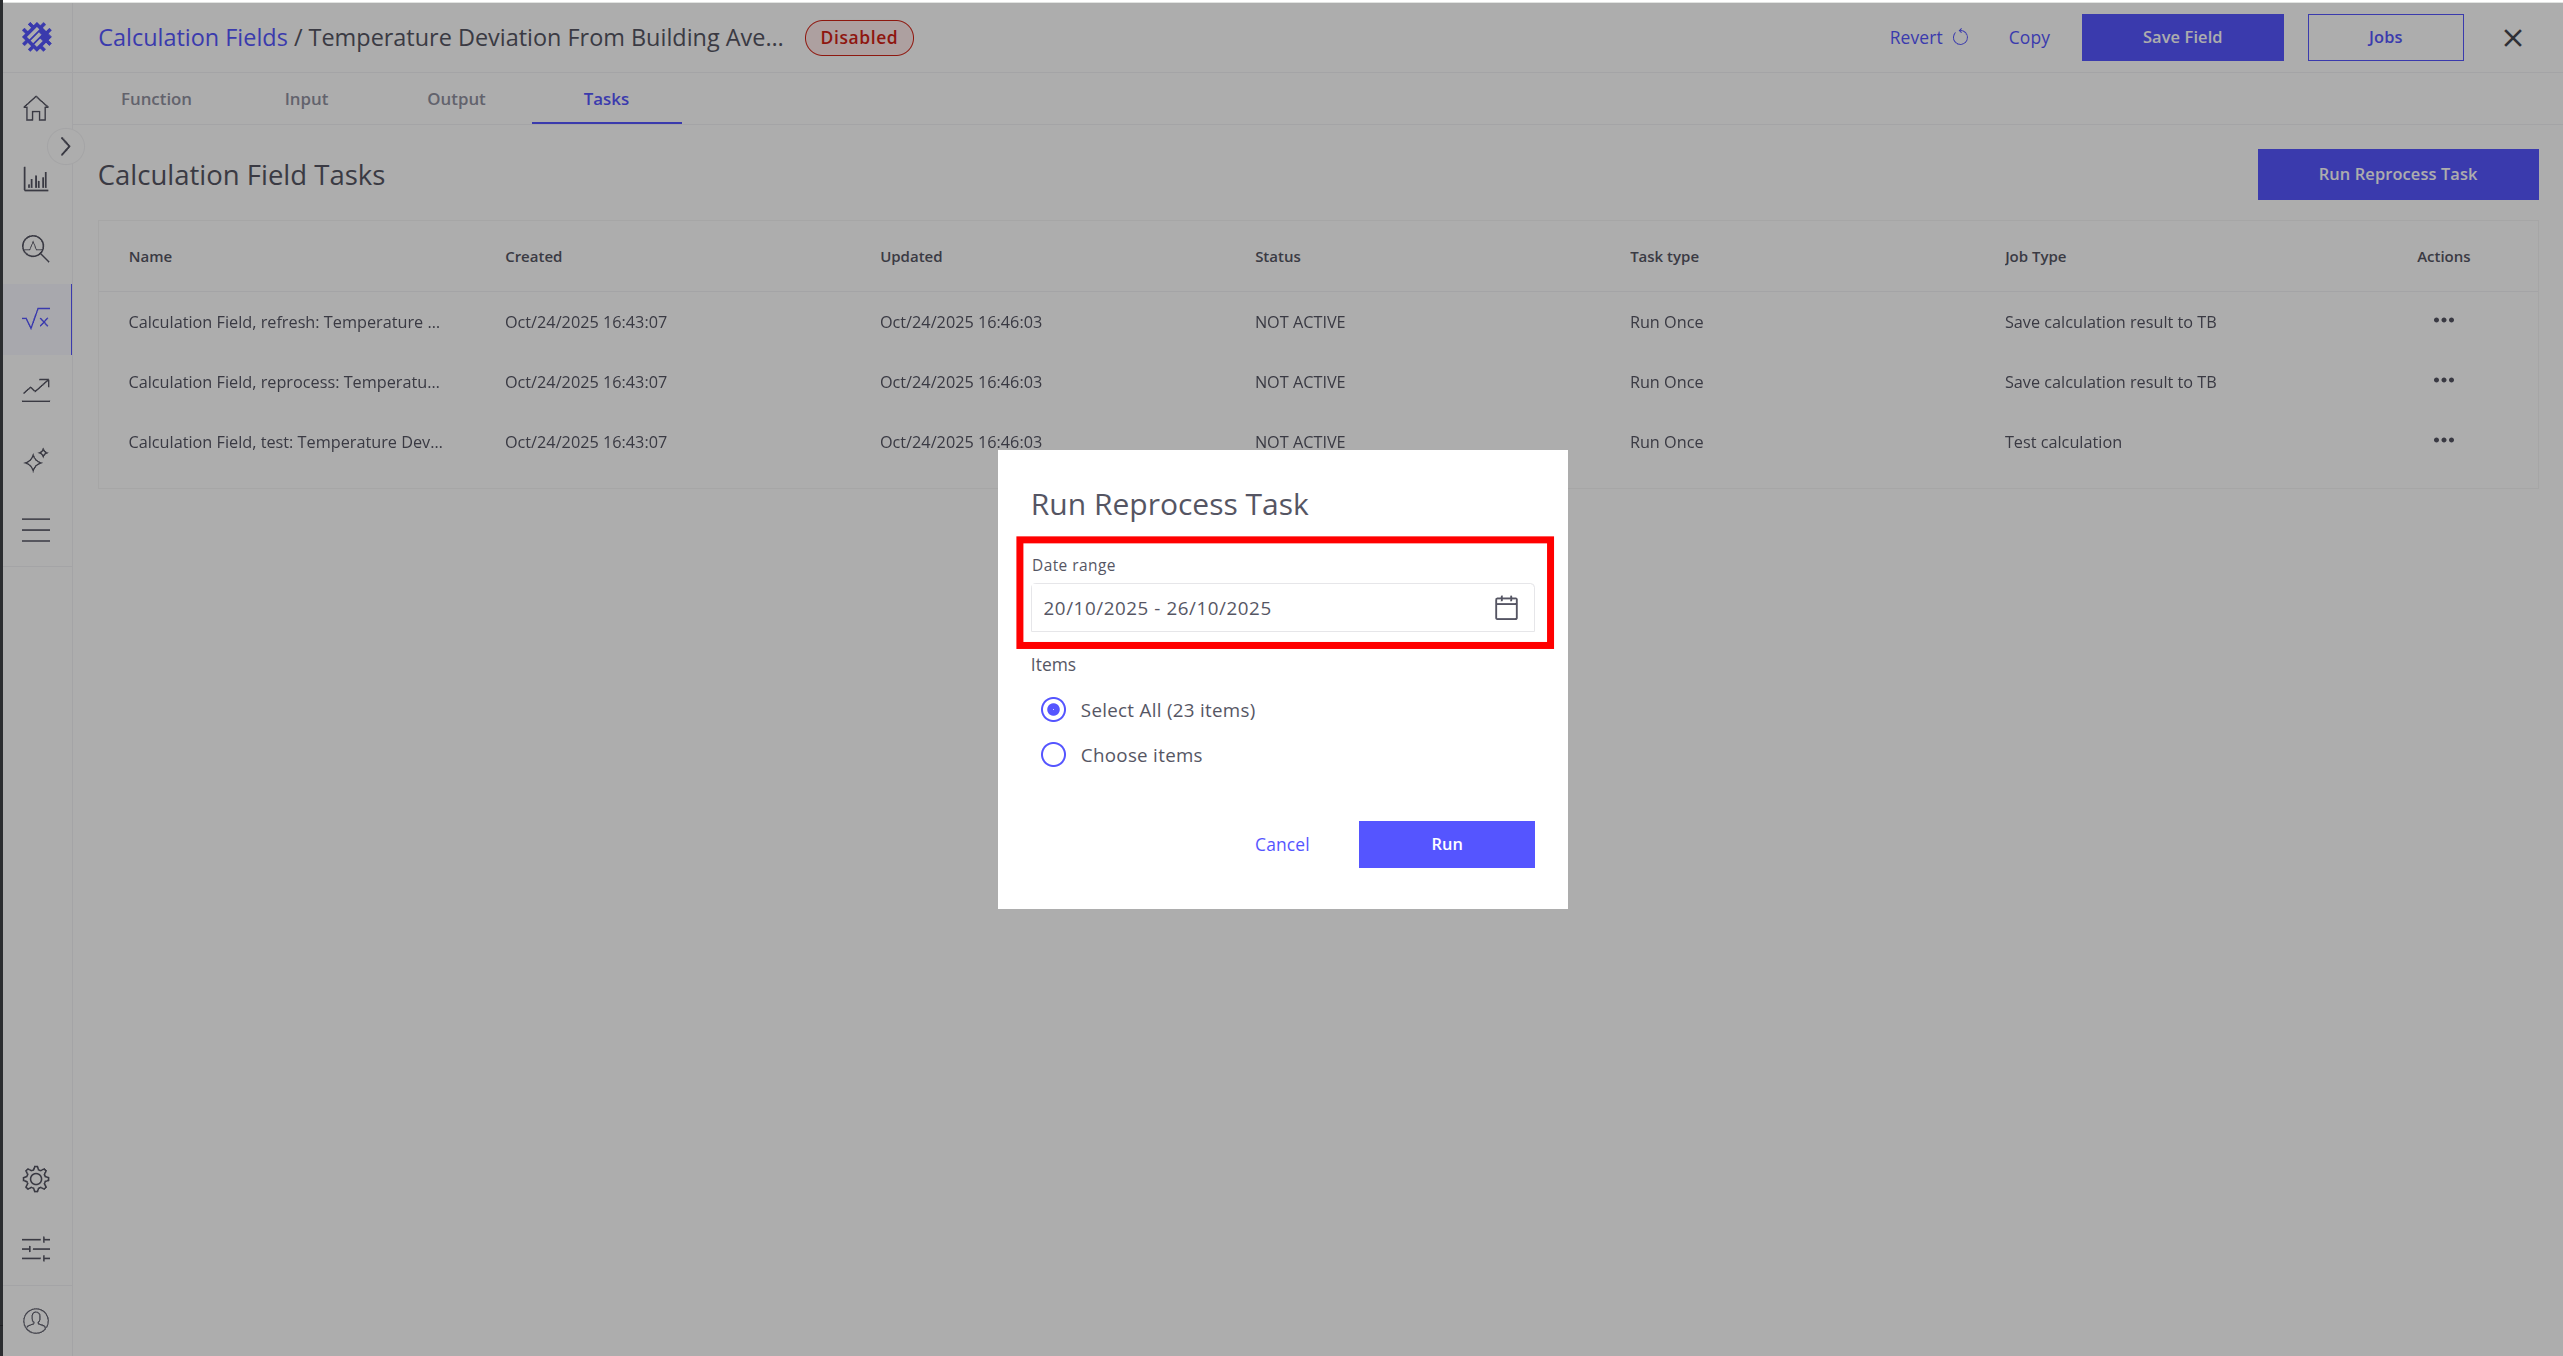
- Select a time range for reprocessing.
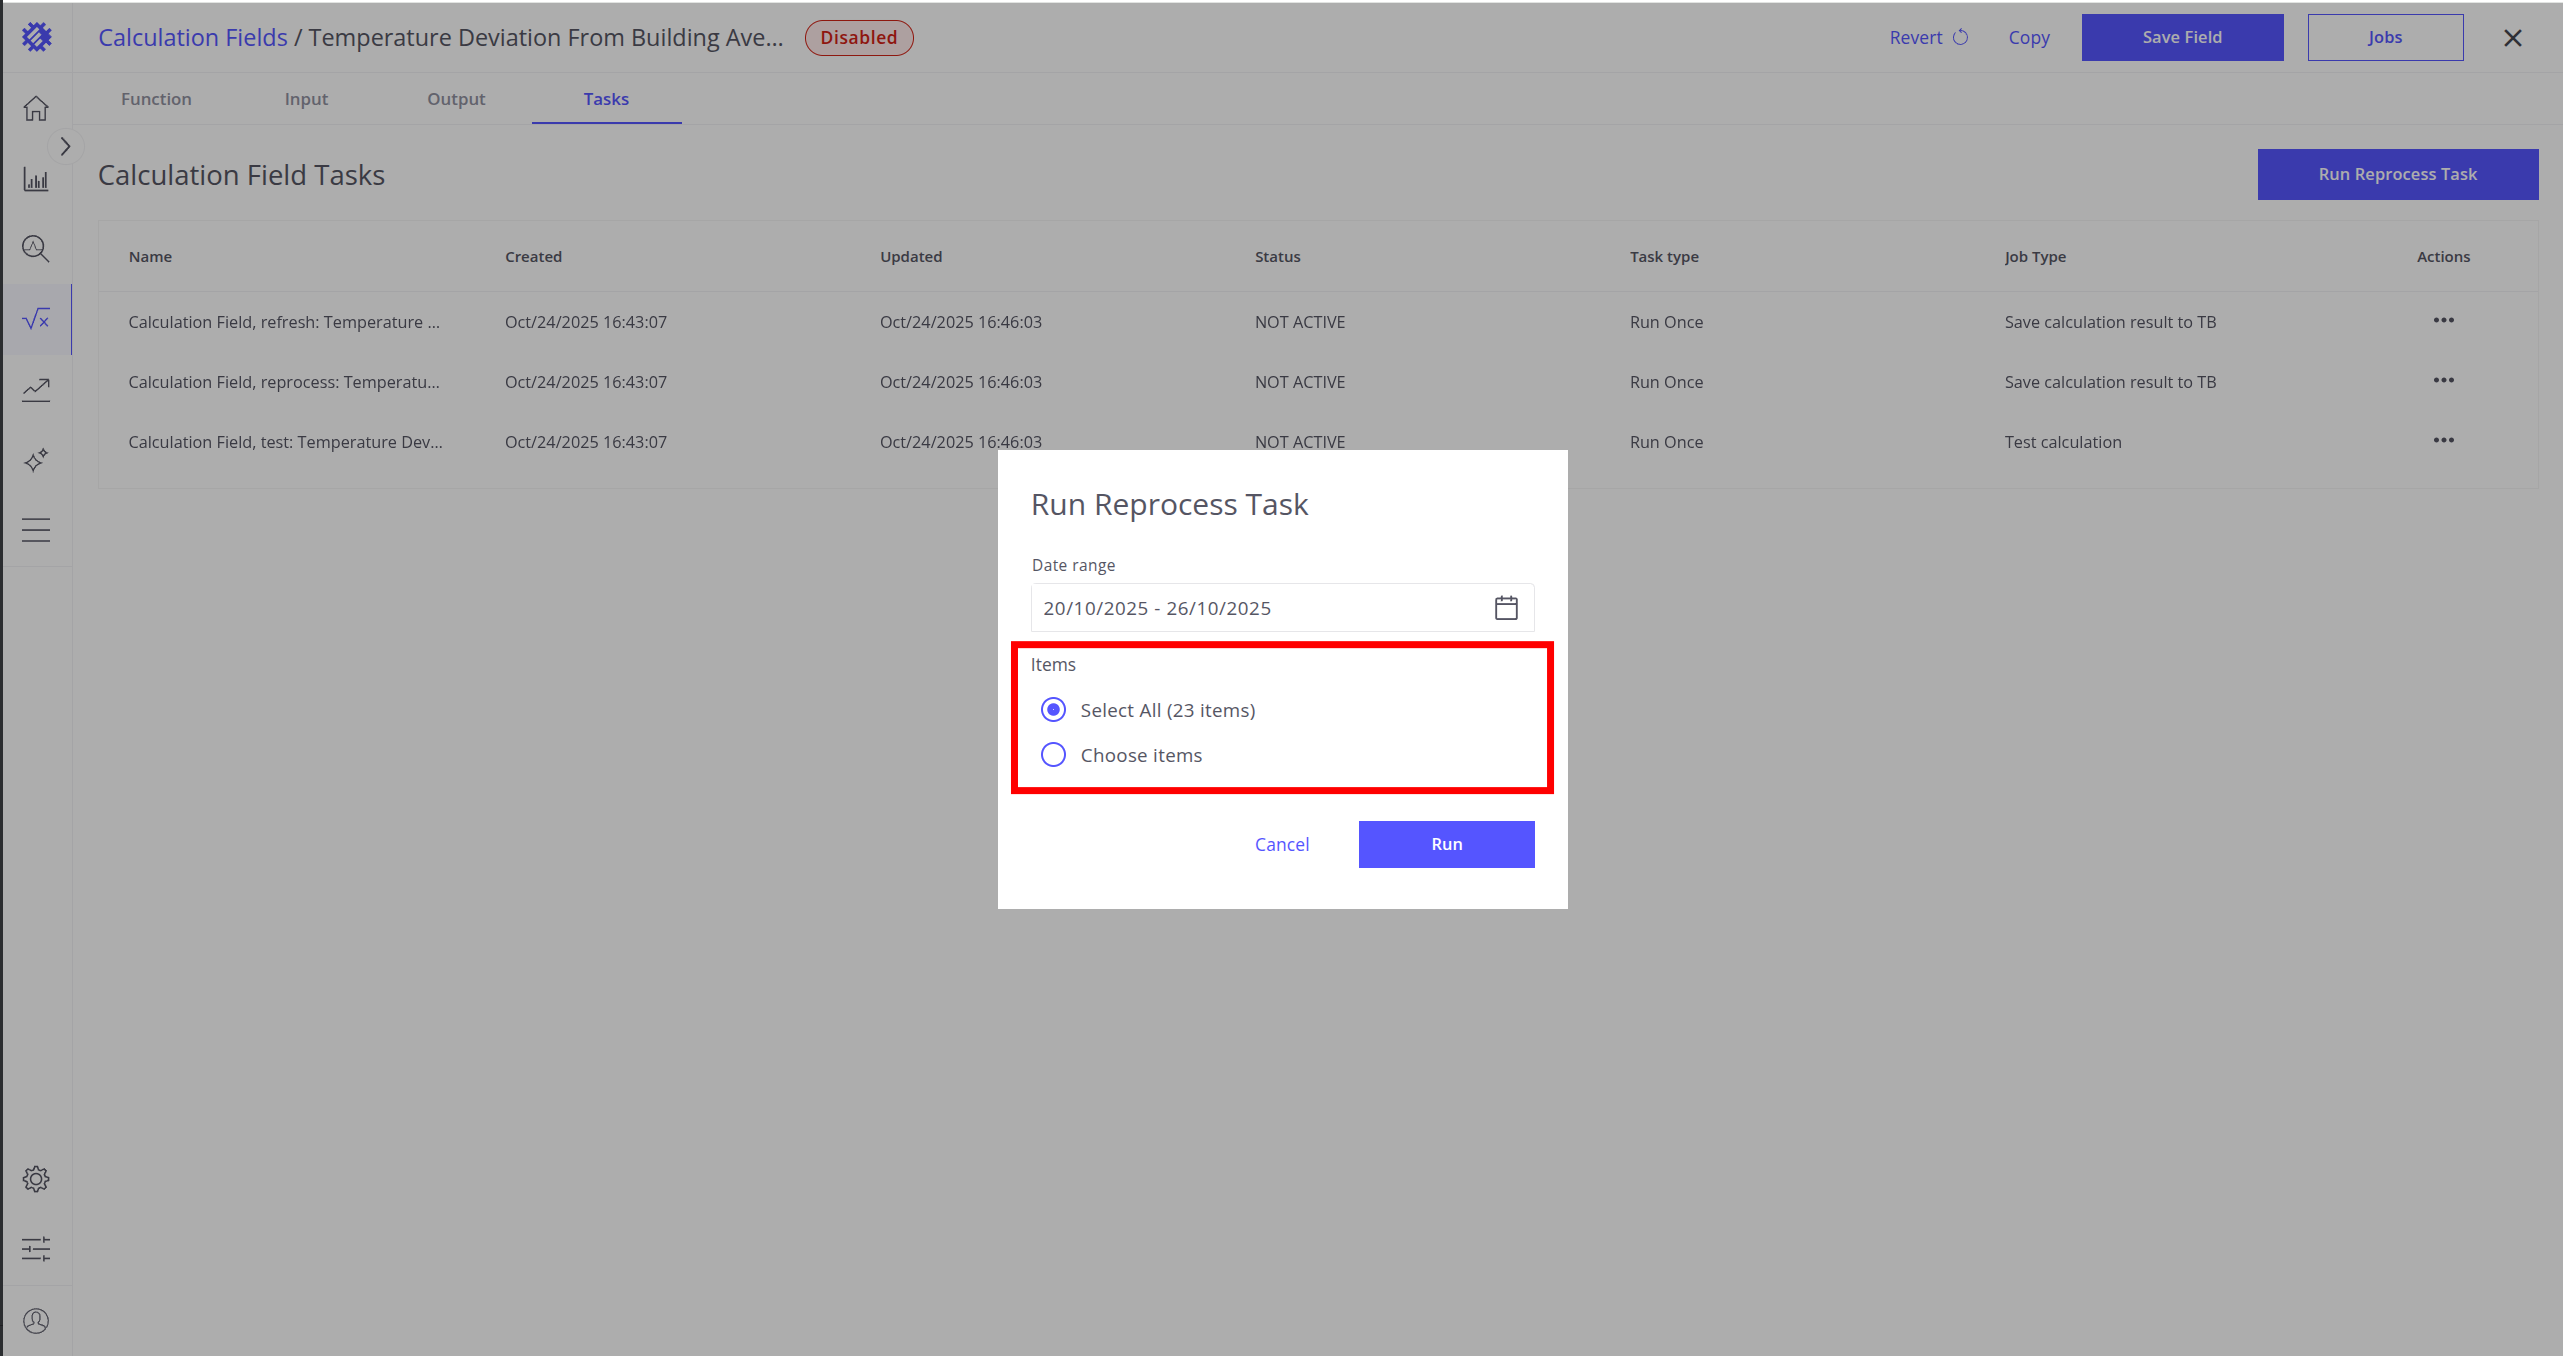
- Choose items to run the job on (you can apply the same calculation to all entities with the same entity profile).
- Click Run button.
After completion, the telemetry will appear in ThingsBoard with the appropriate key.
Read more about reprocess task here.
Run Refresh Task
You can automate telemetry updates using a Refresh Job.
Steps:
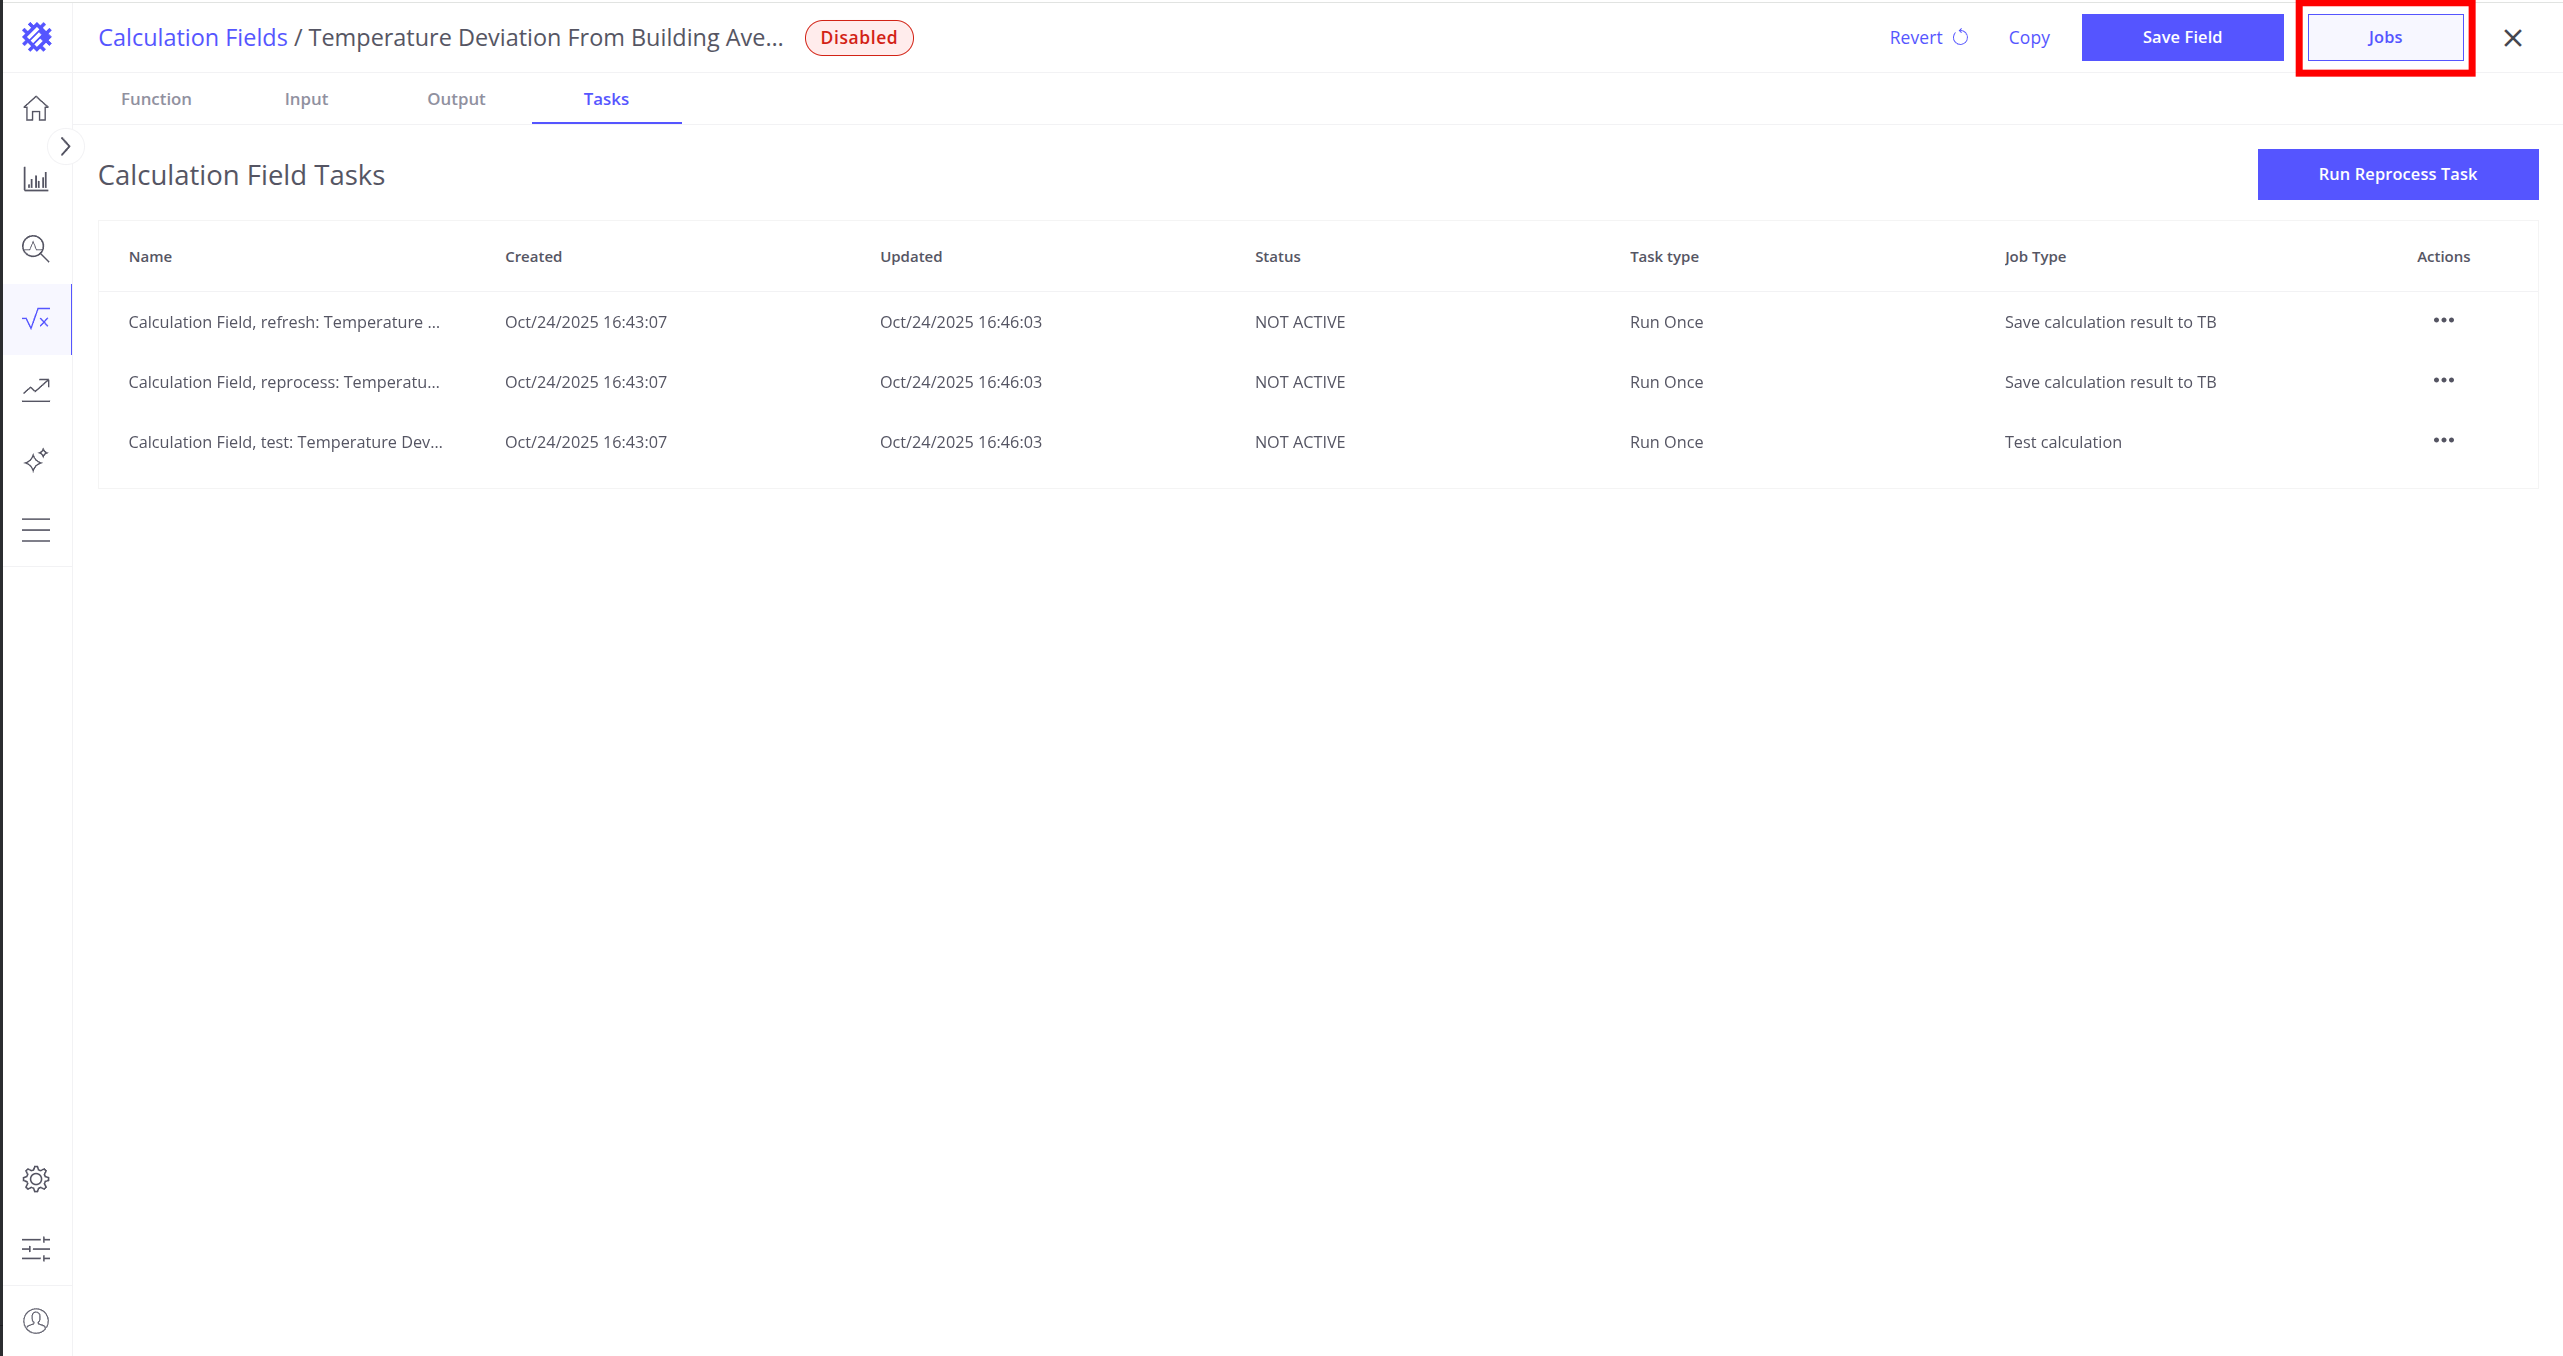
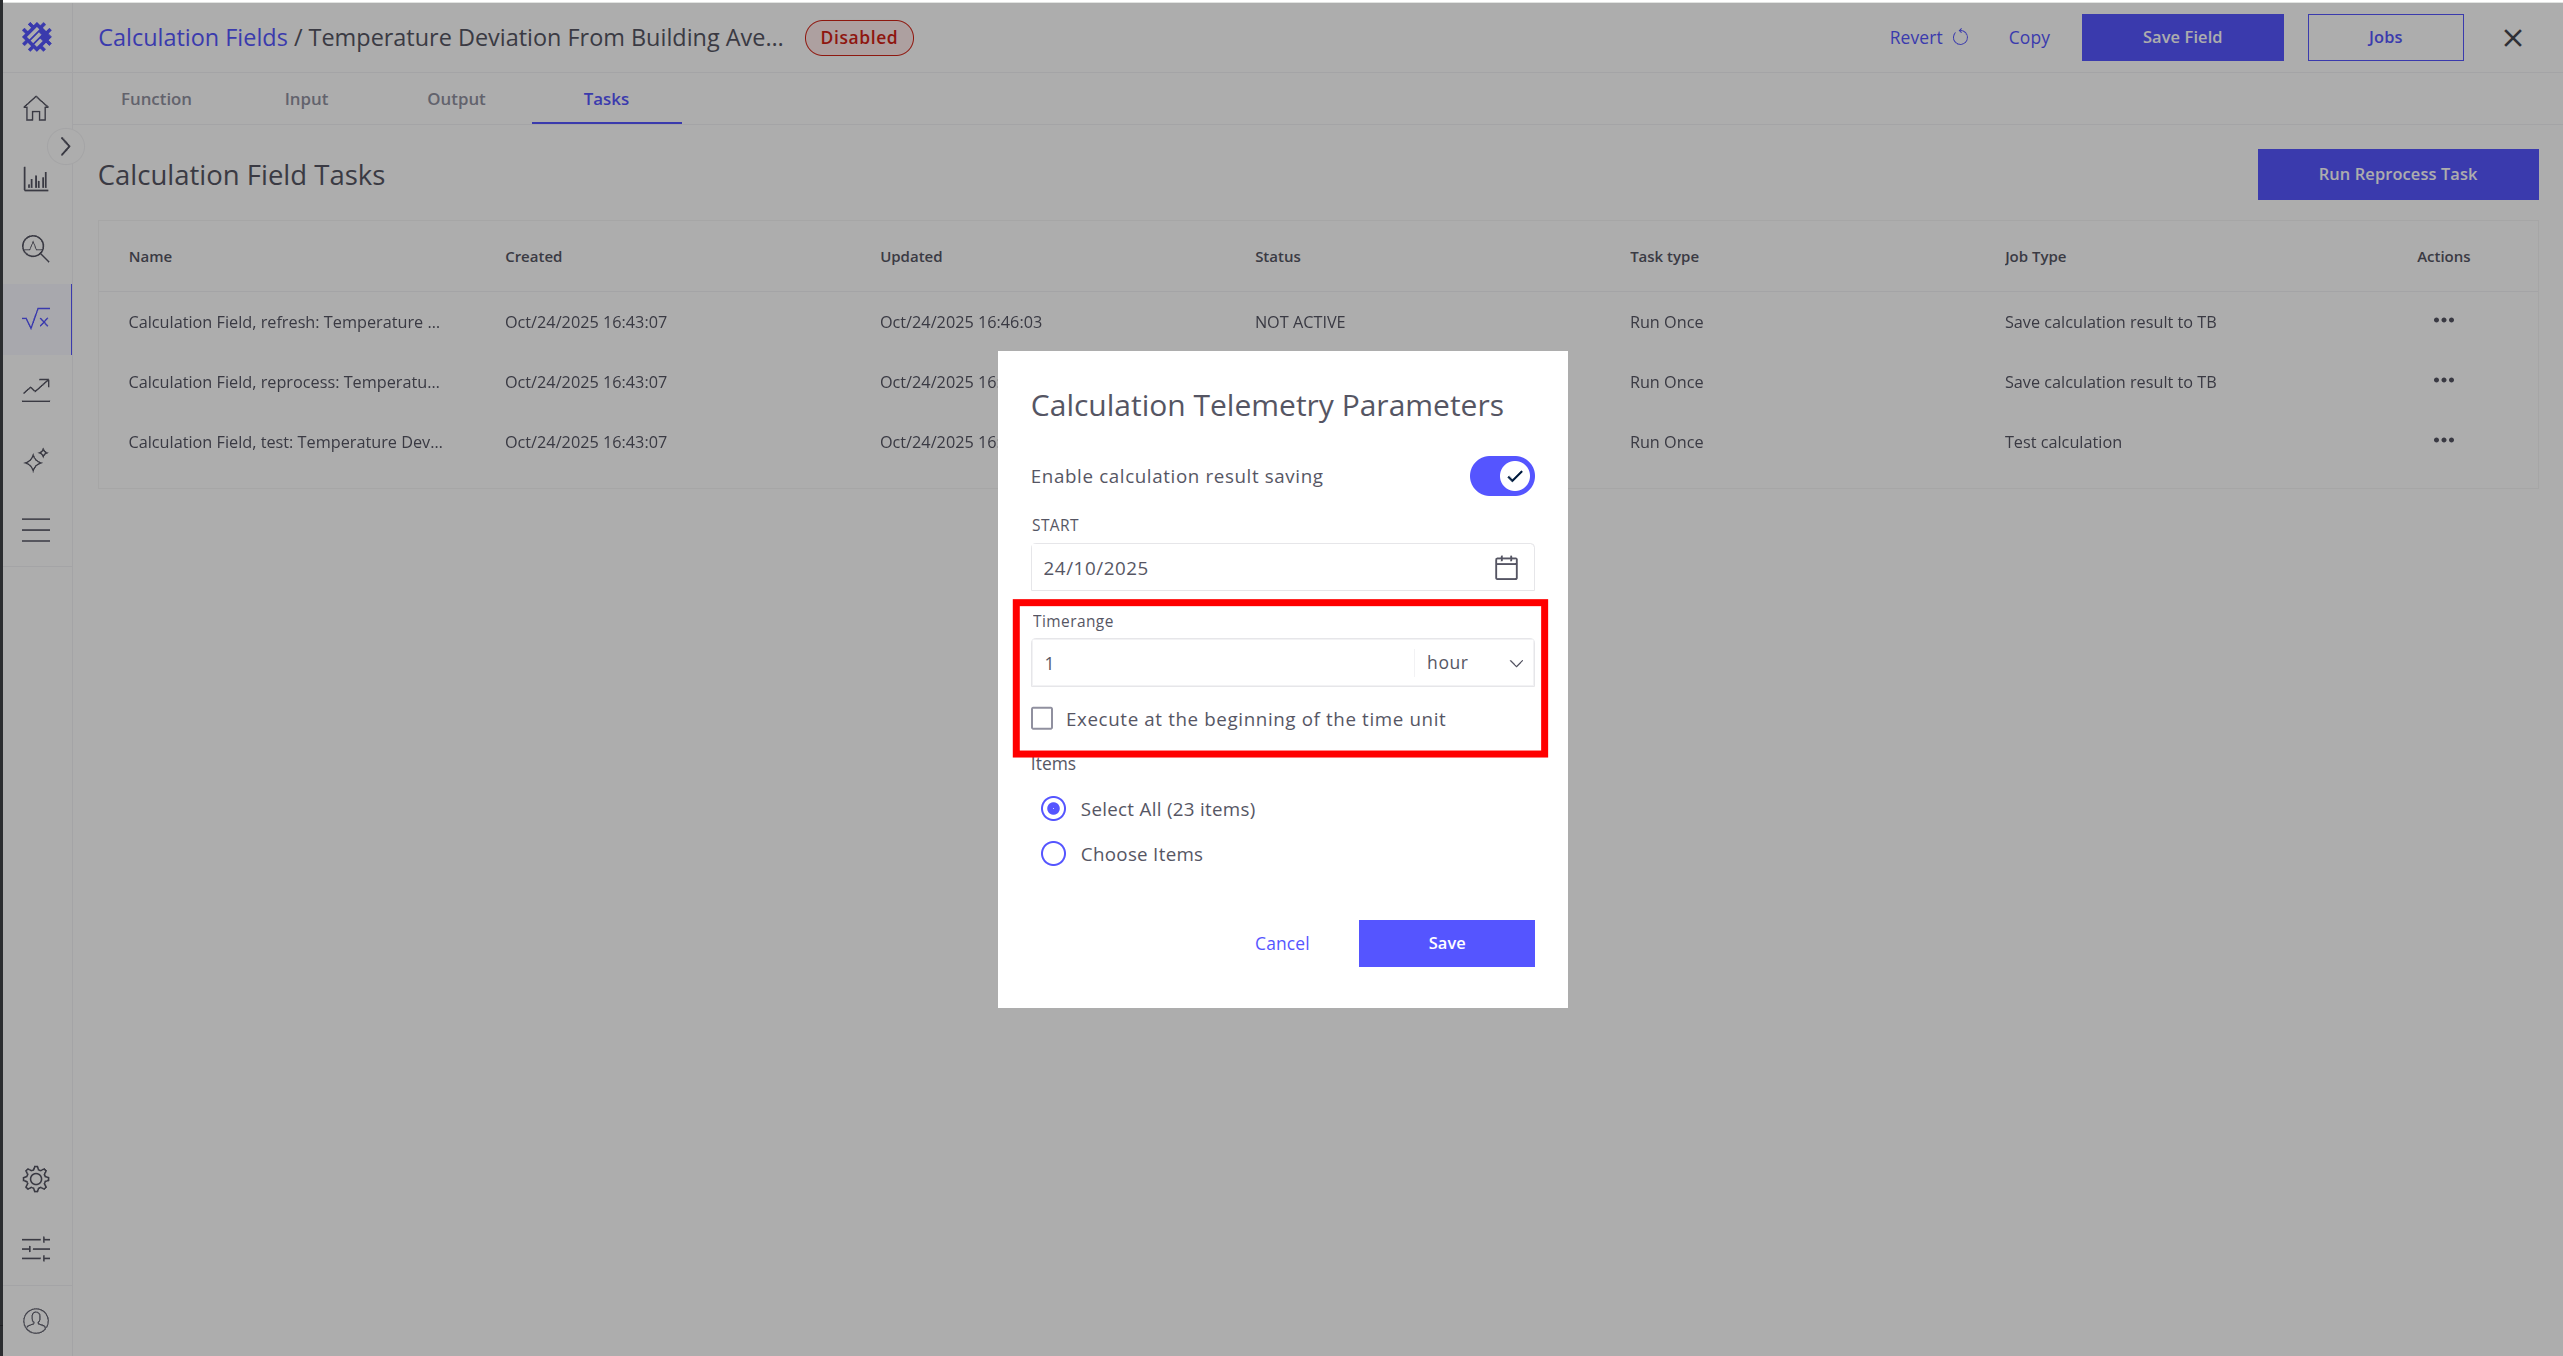
- Click the Jobs button.
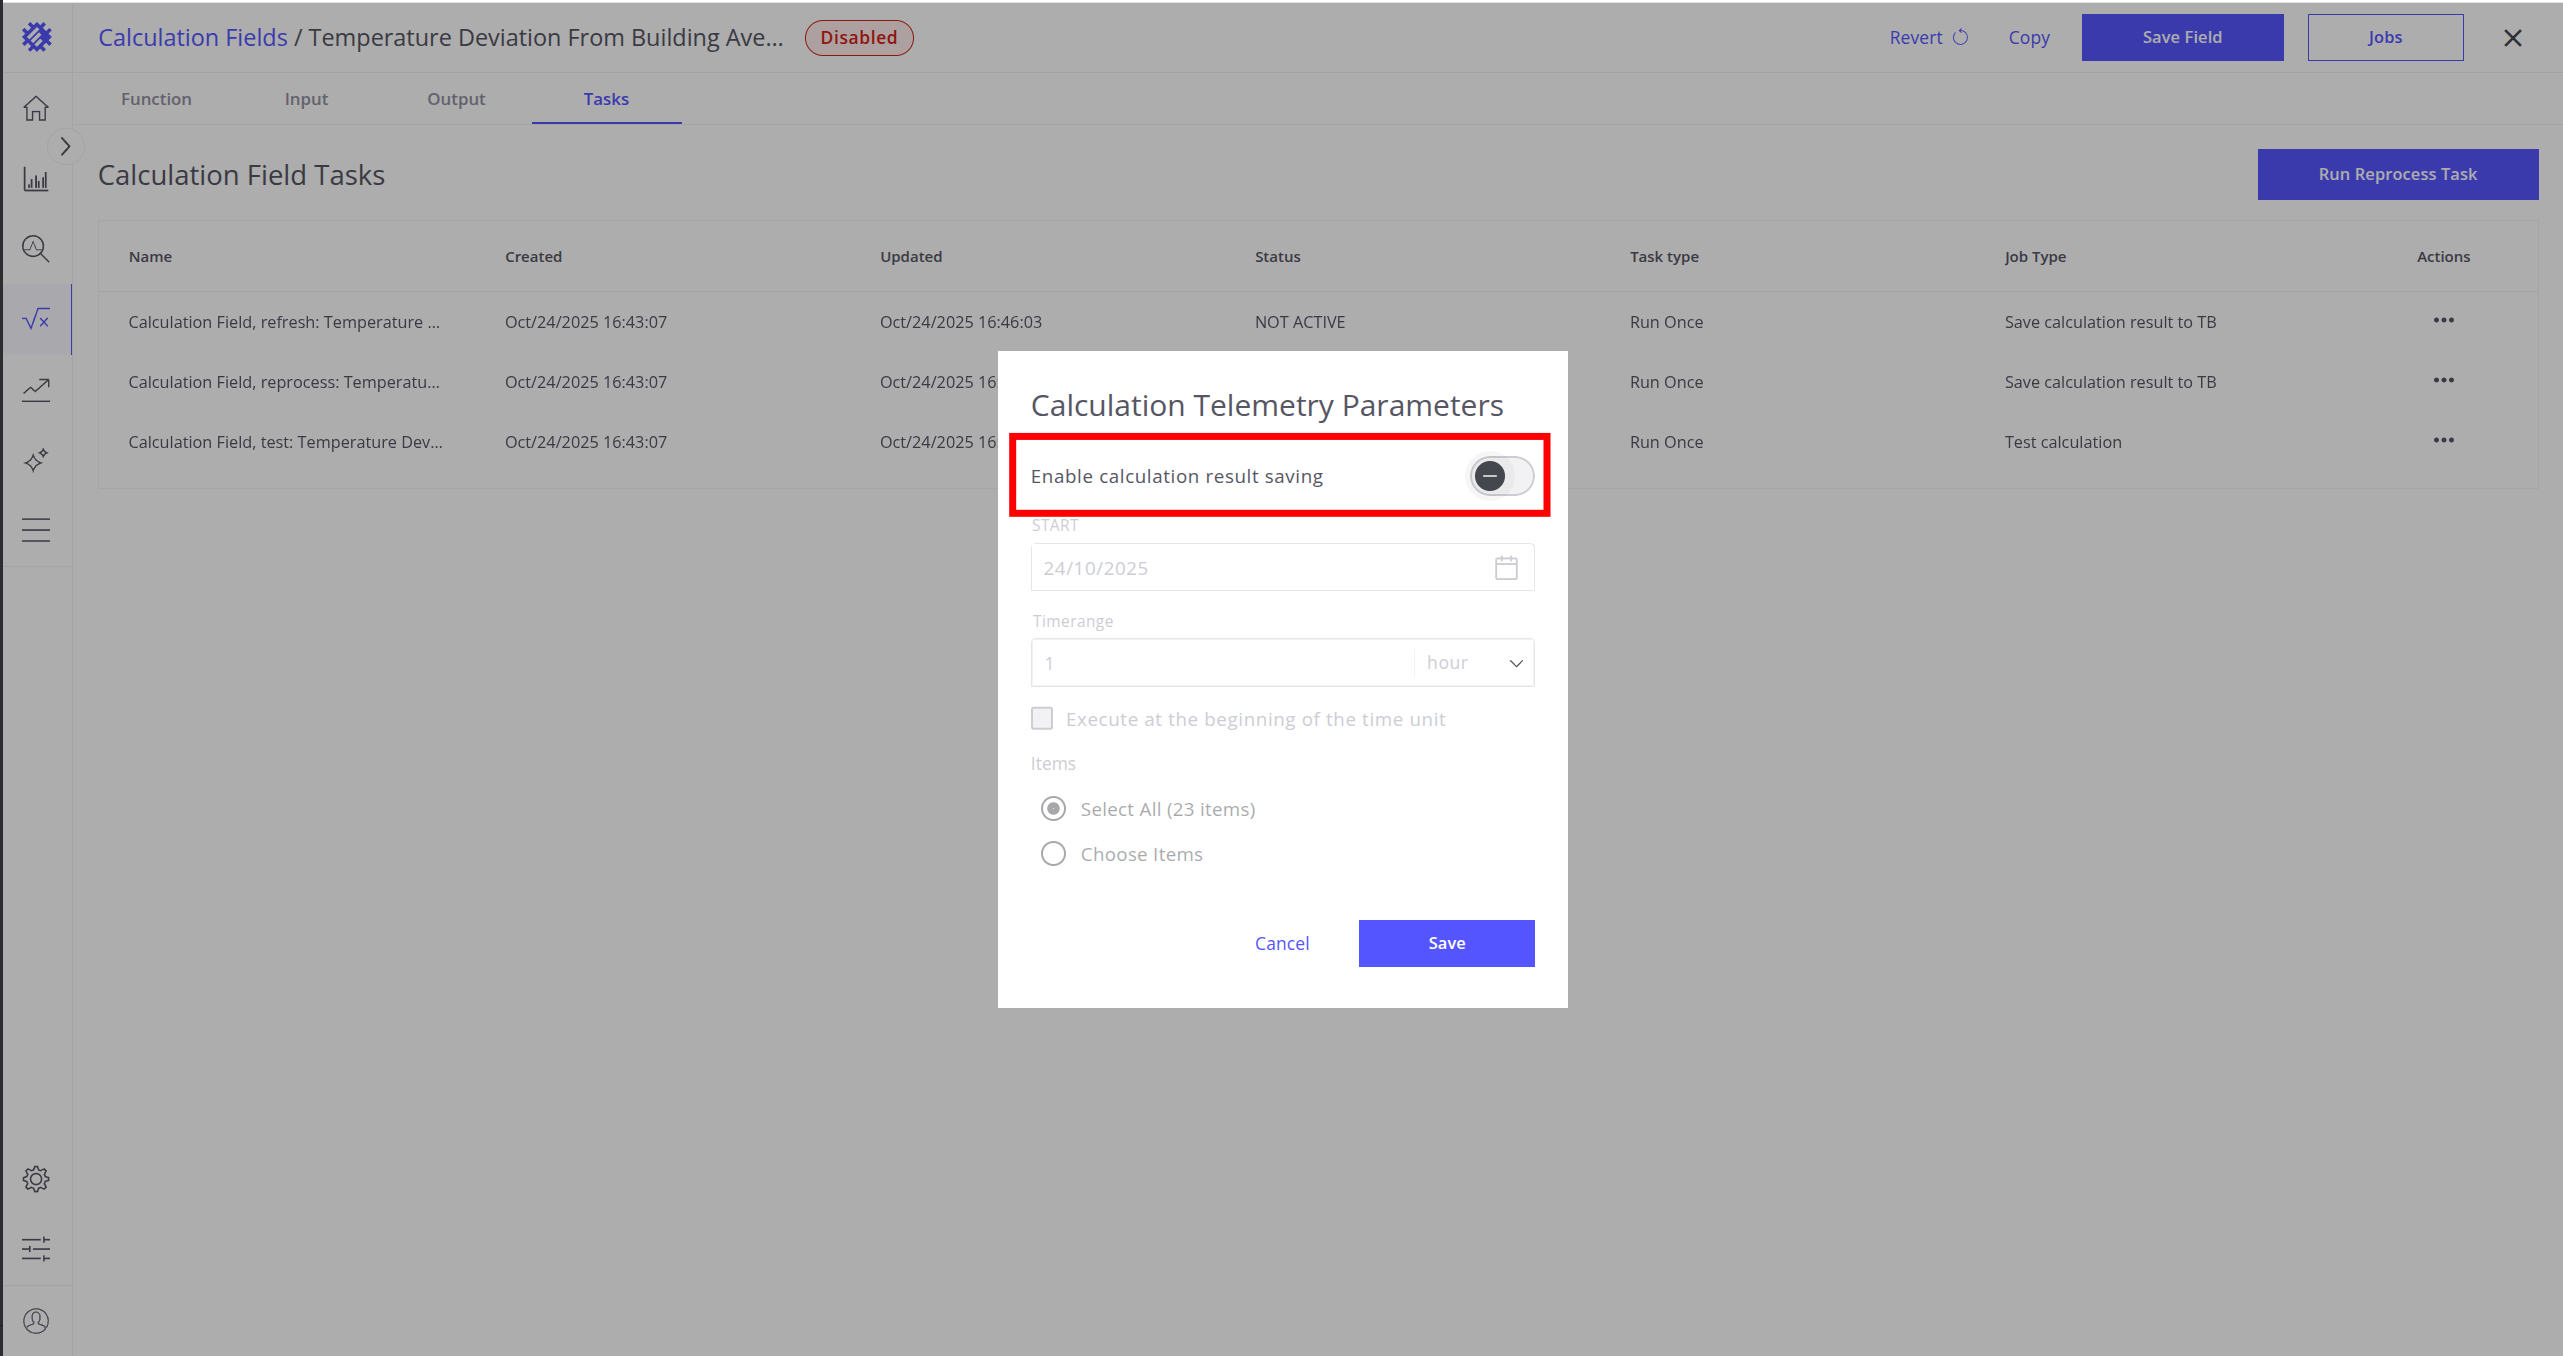
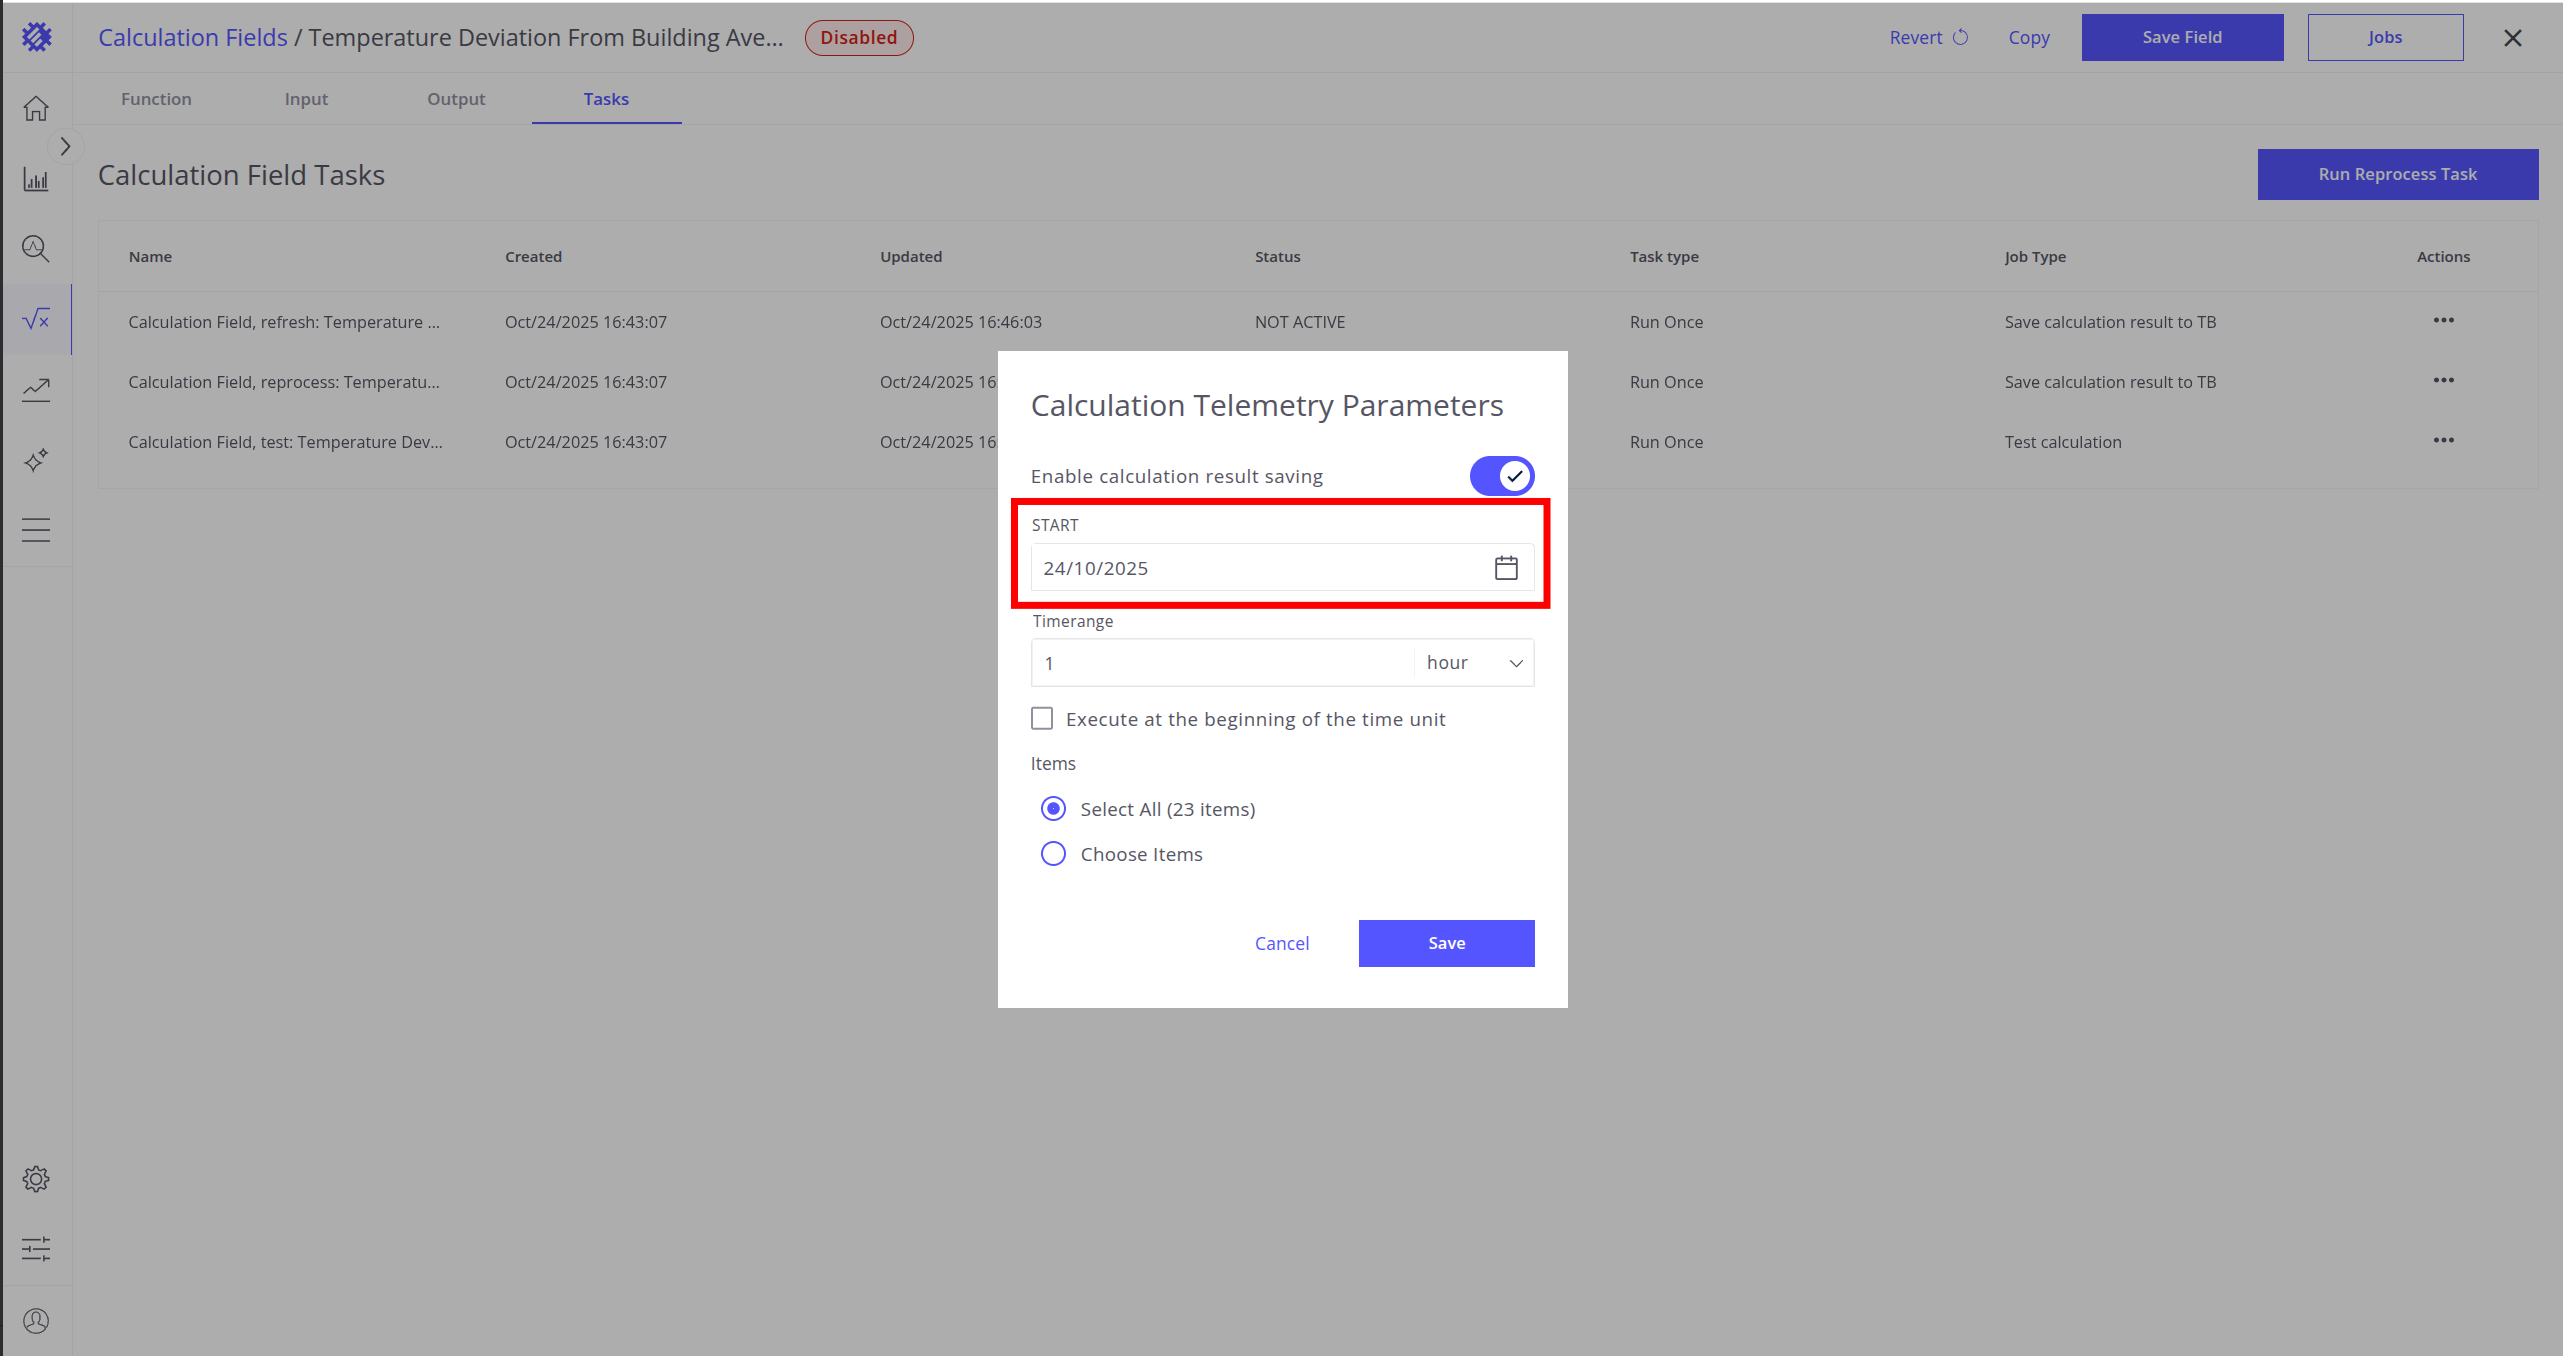
- Enable calculation result saving.
- Set the start date (from which data will be saved).
- Define the frequency (how often the job runs).
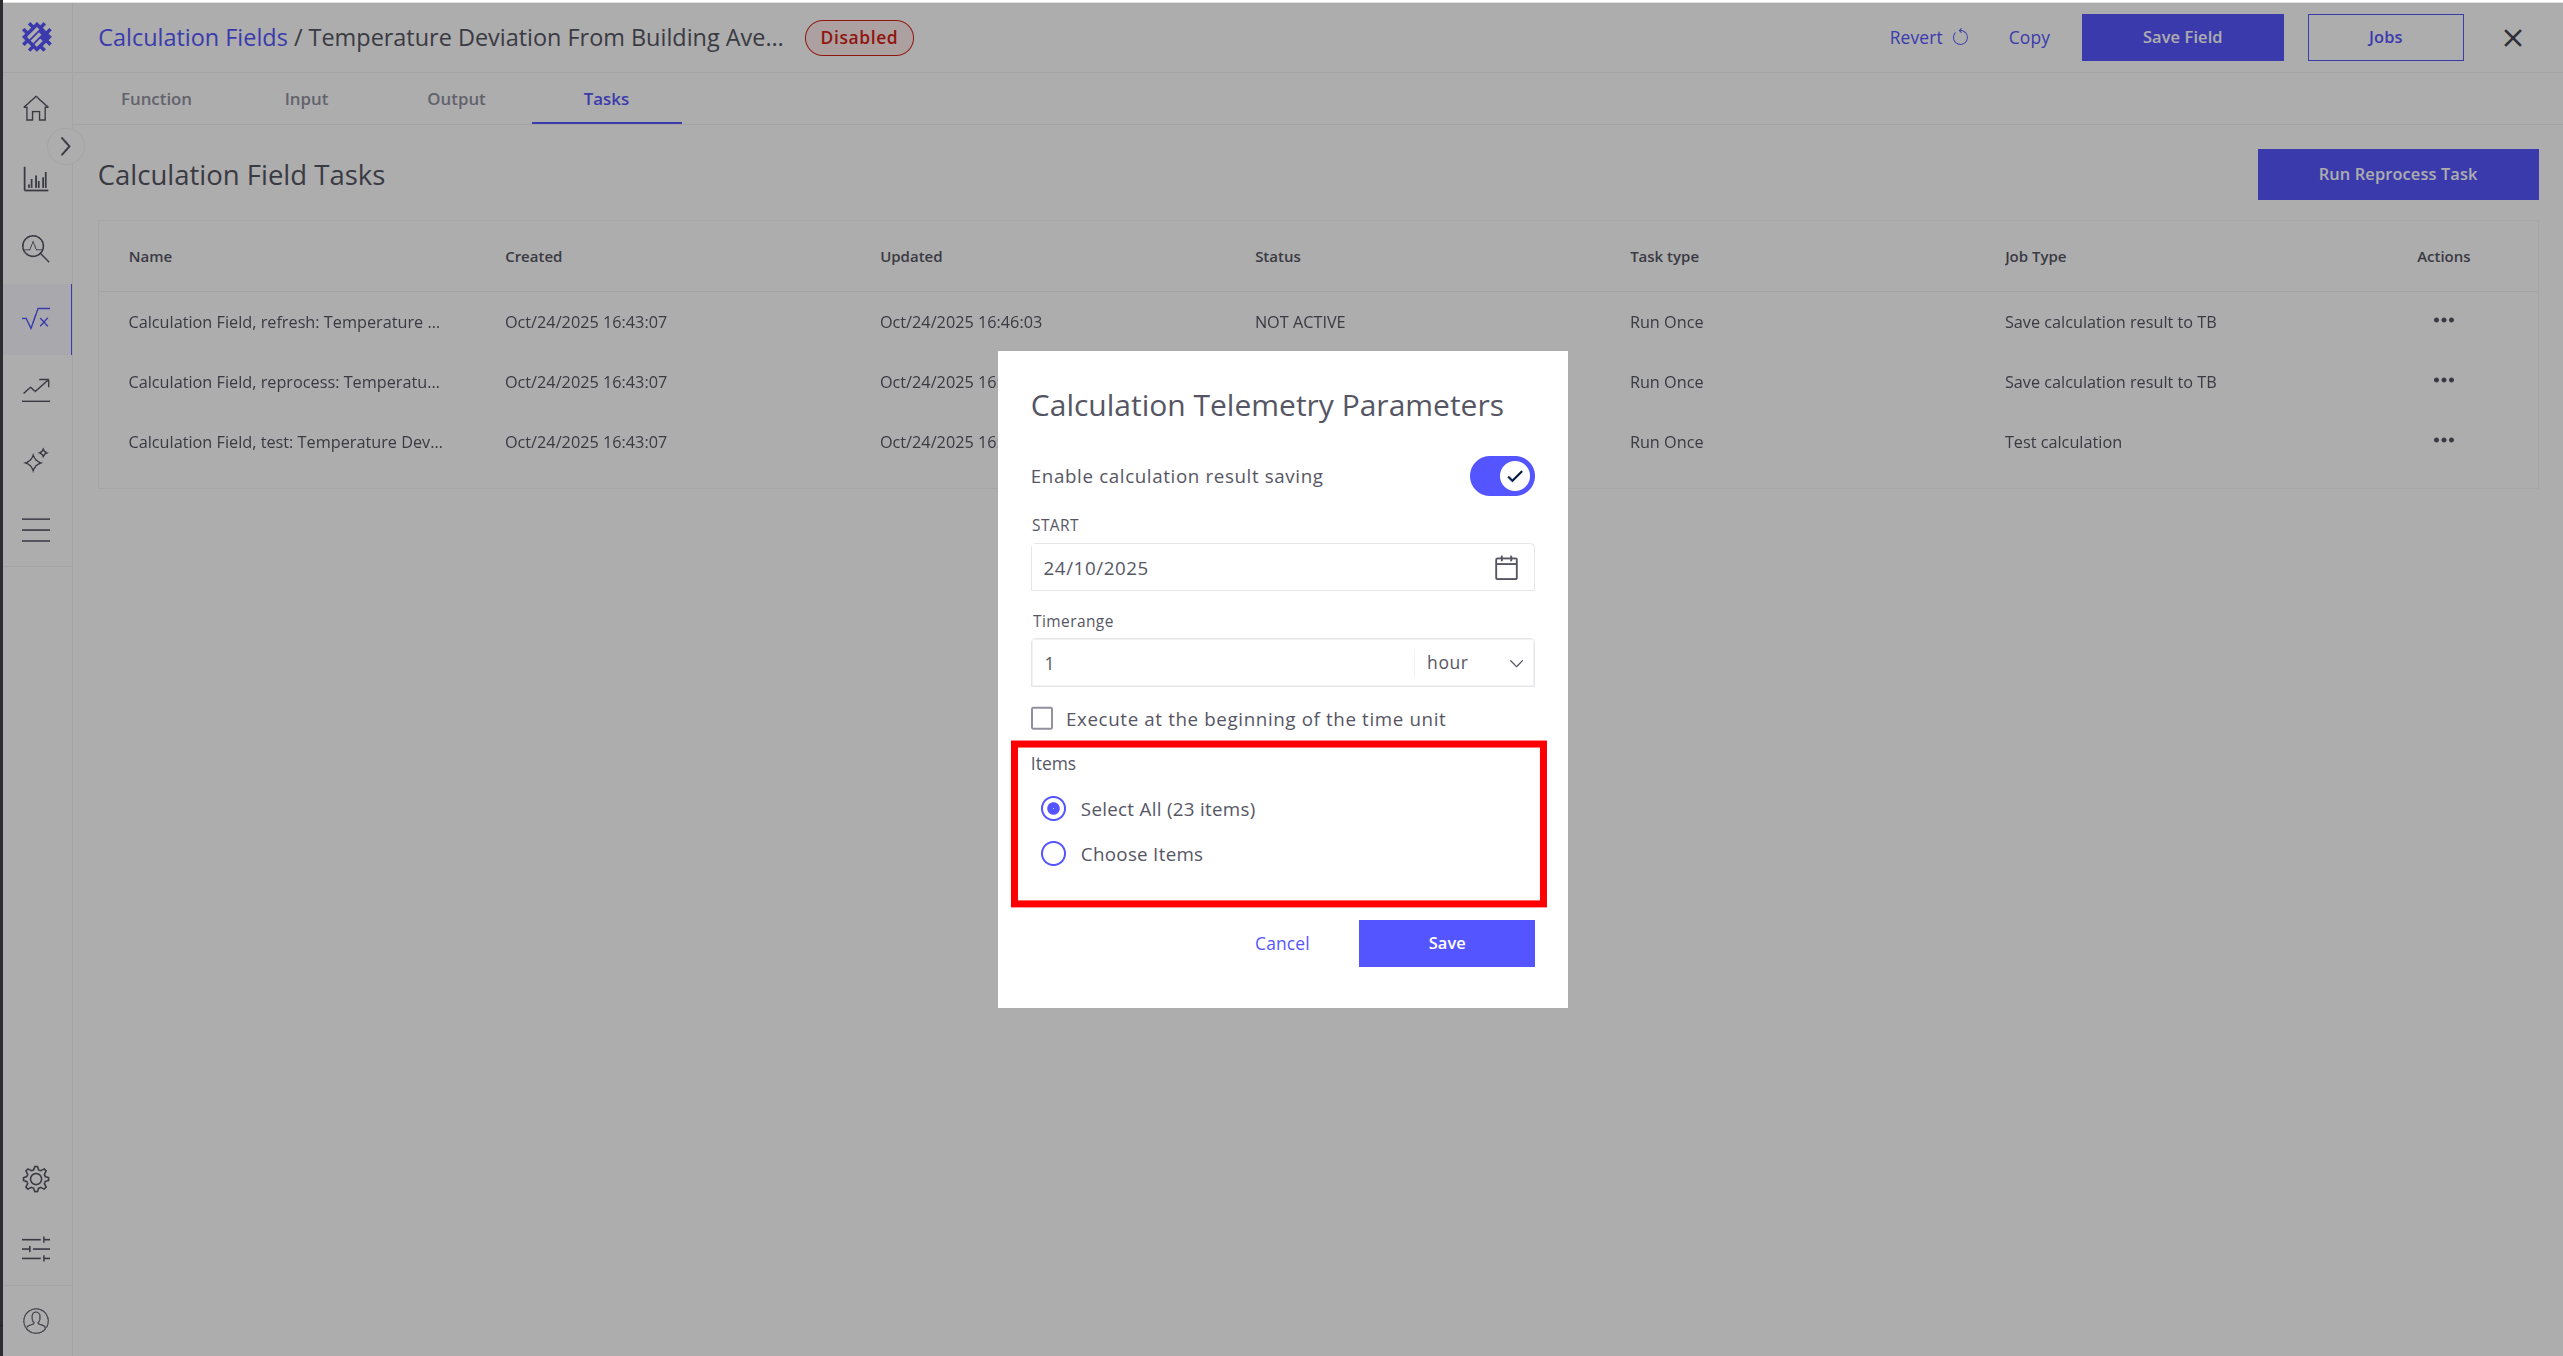
- Choose the target items (entities with the same entity profile) for automatic updates.
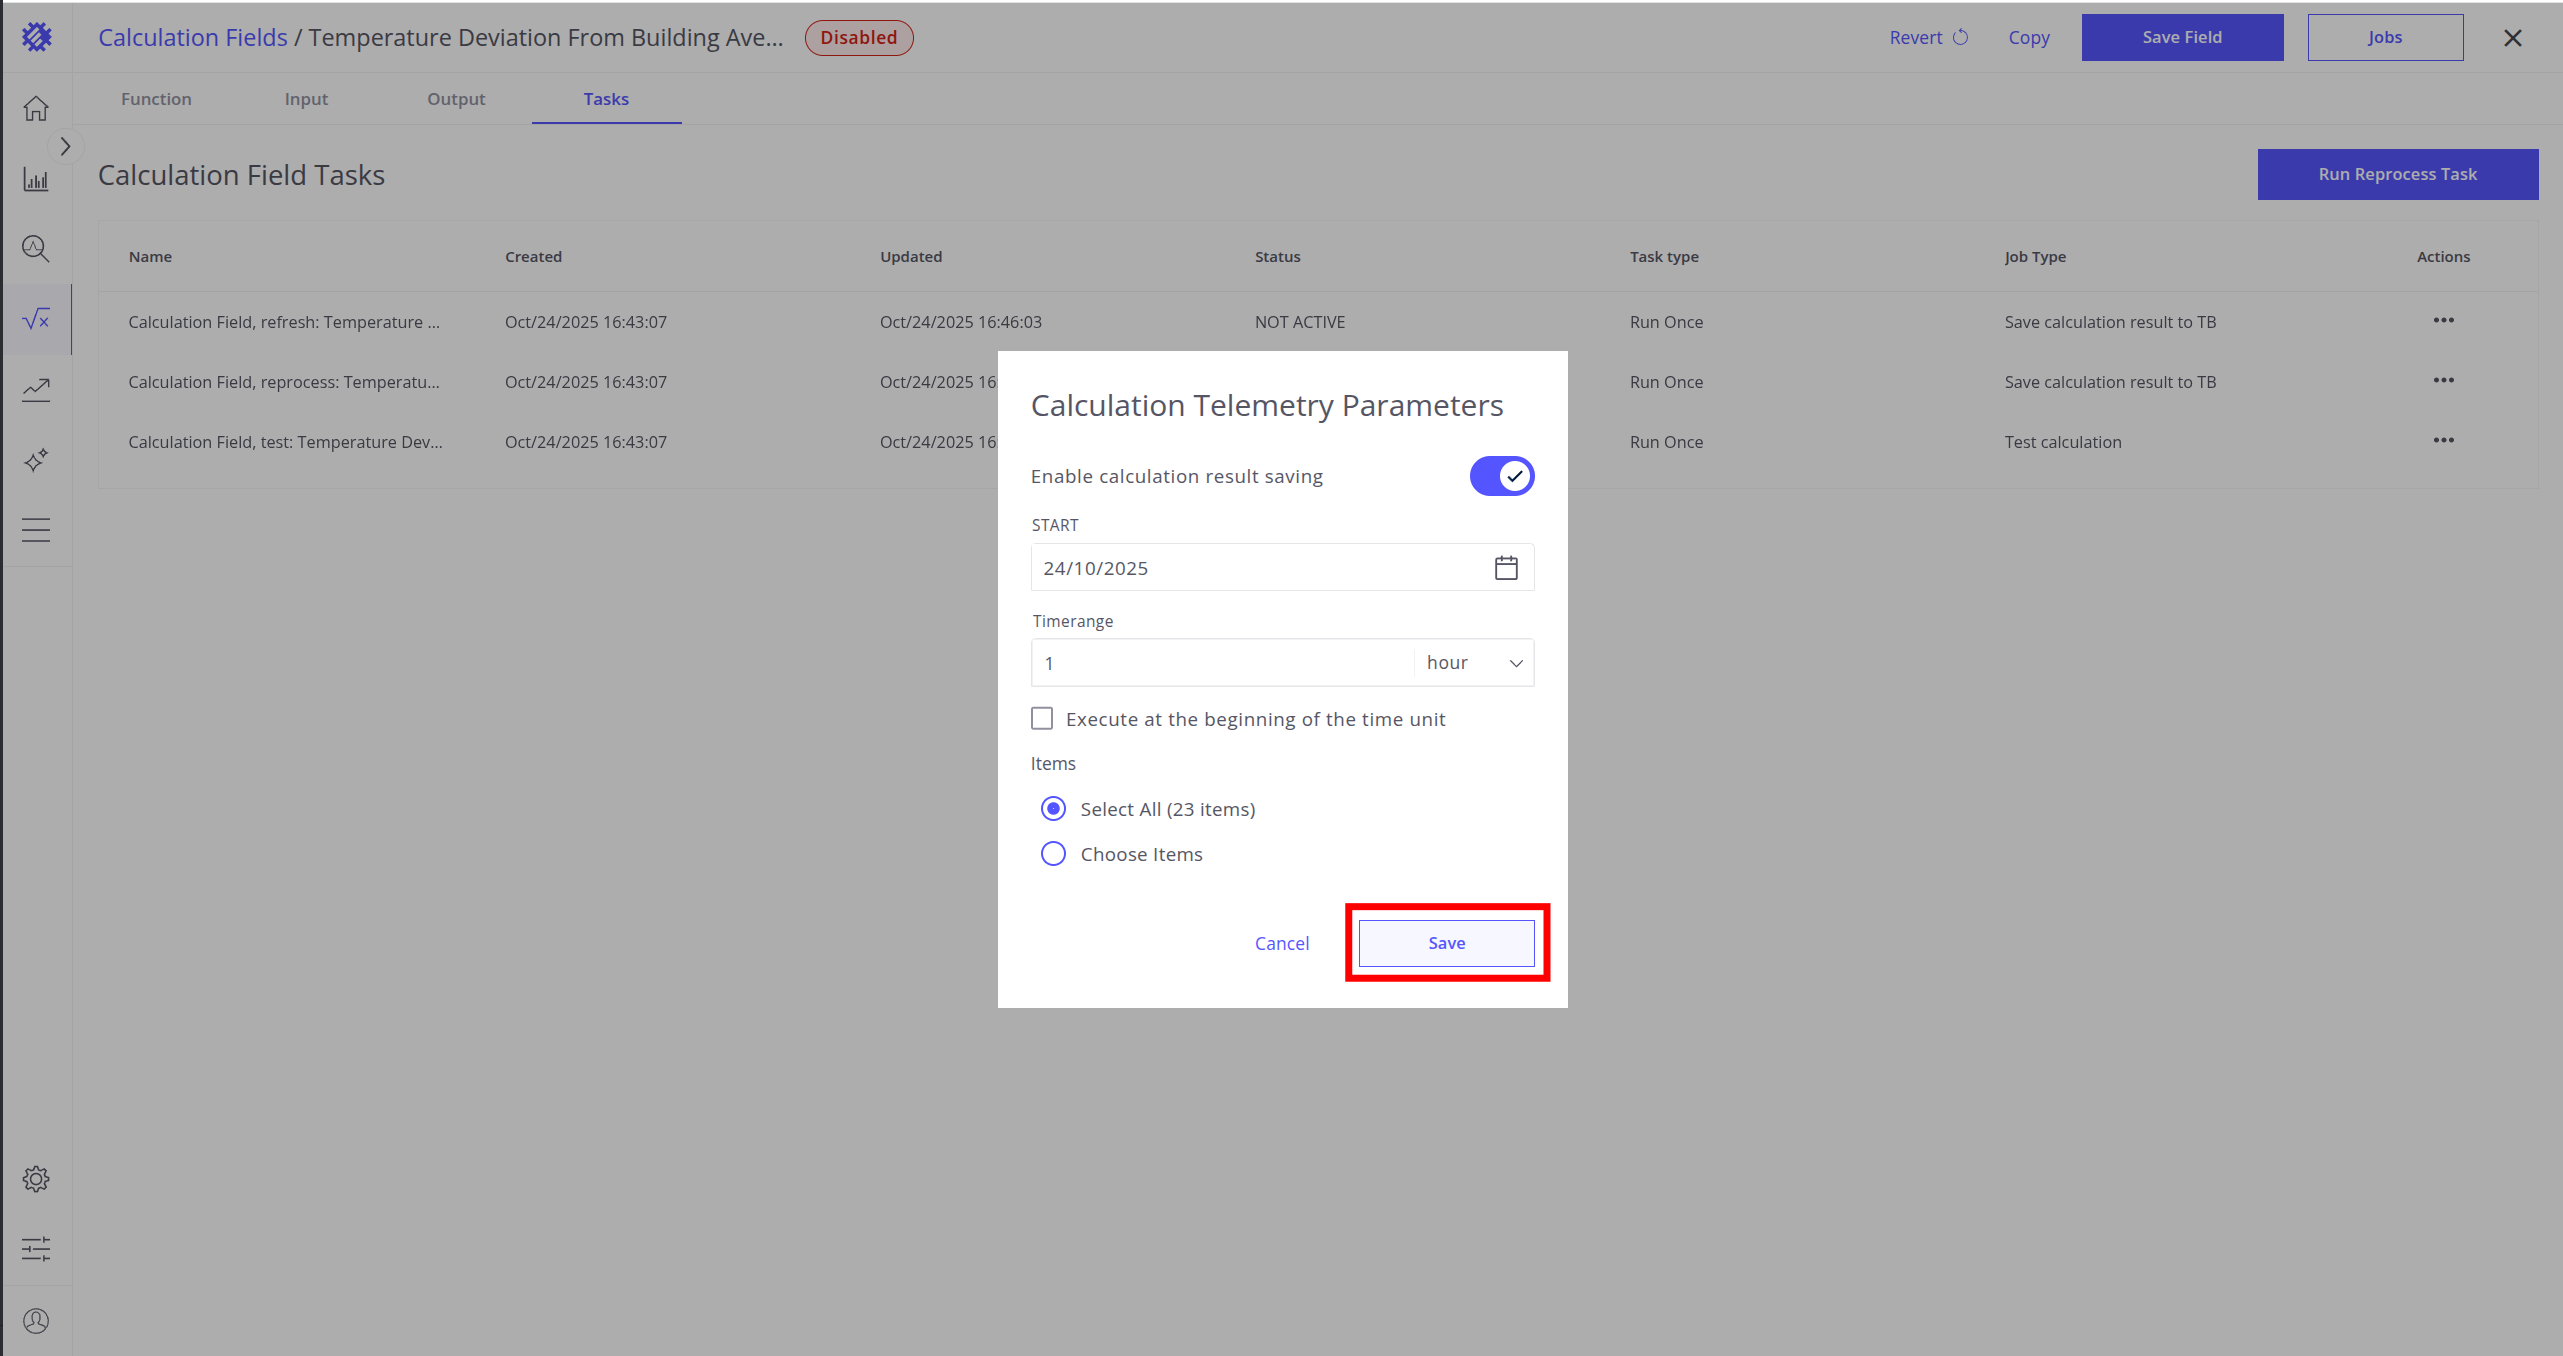
- Click Save button.
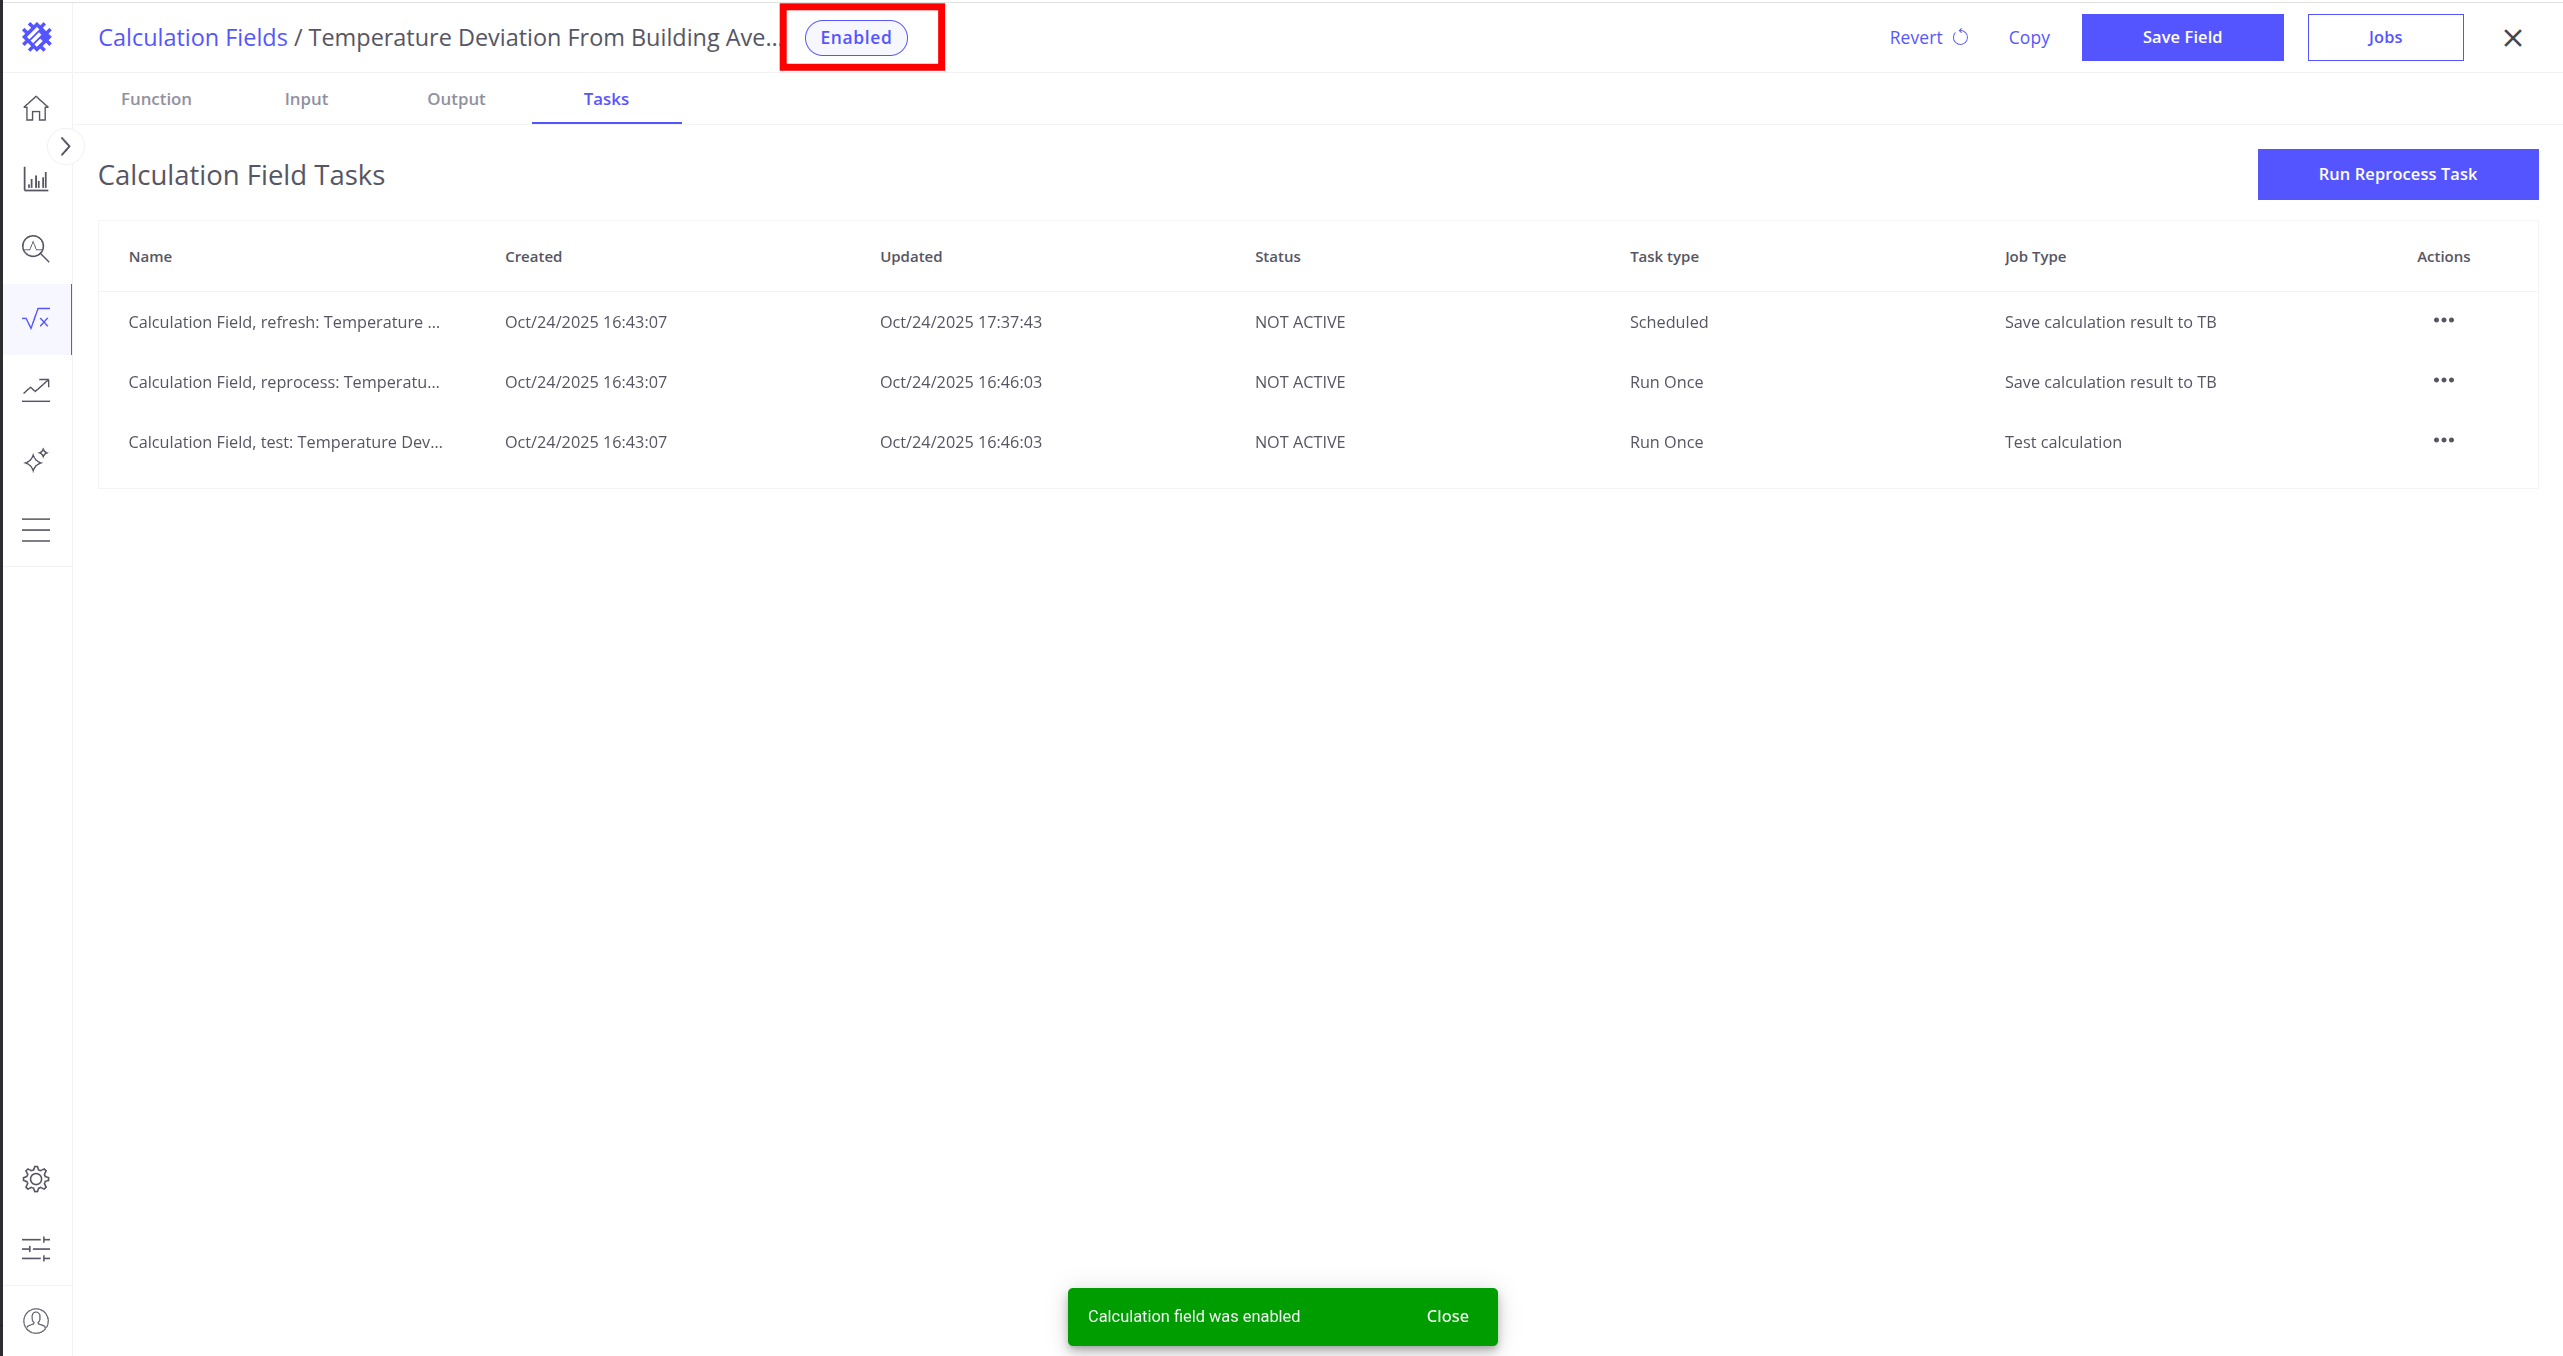
Once the refresh job is set up, you will see the Enabled status next to the calculation name.
From now on, telemetry will update automatically at the specified frequency for the selected items.
Read more about refresh task here.
Use in ThingsBoard
Once the calculation field, refresh job, and reprocess job are configured, the generated telemetry remains continuously updated in ThingsBoard.
You can now use the metric in ThingsBoard.
Automatic Alarm Creation
Since the telemetry exists in ThingsBoard, you can create alarms based on it:
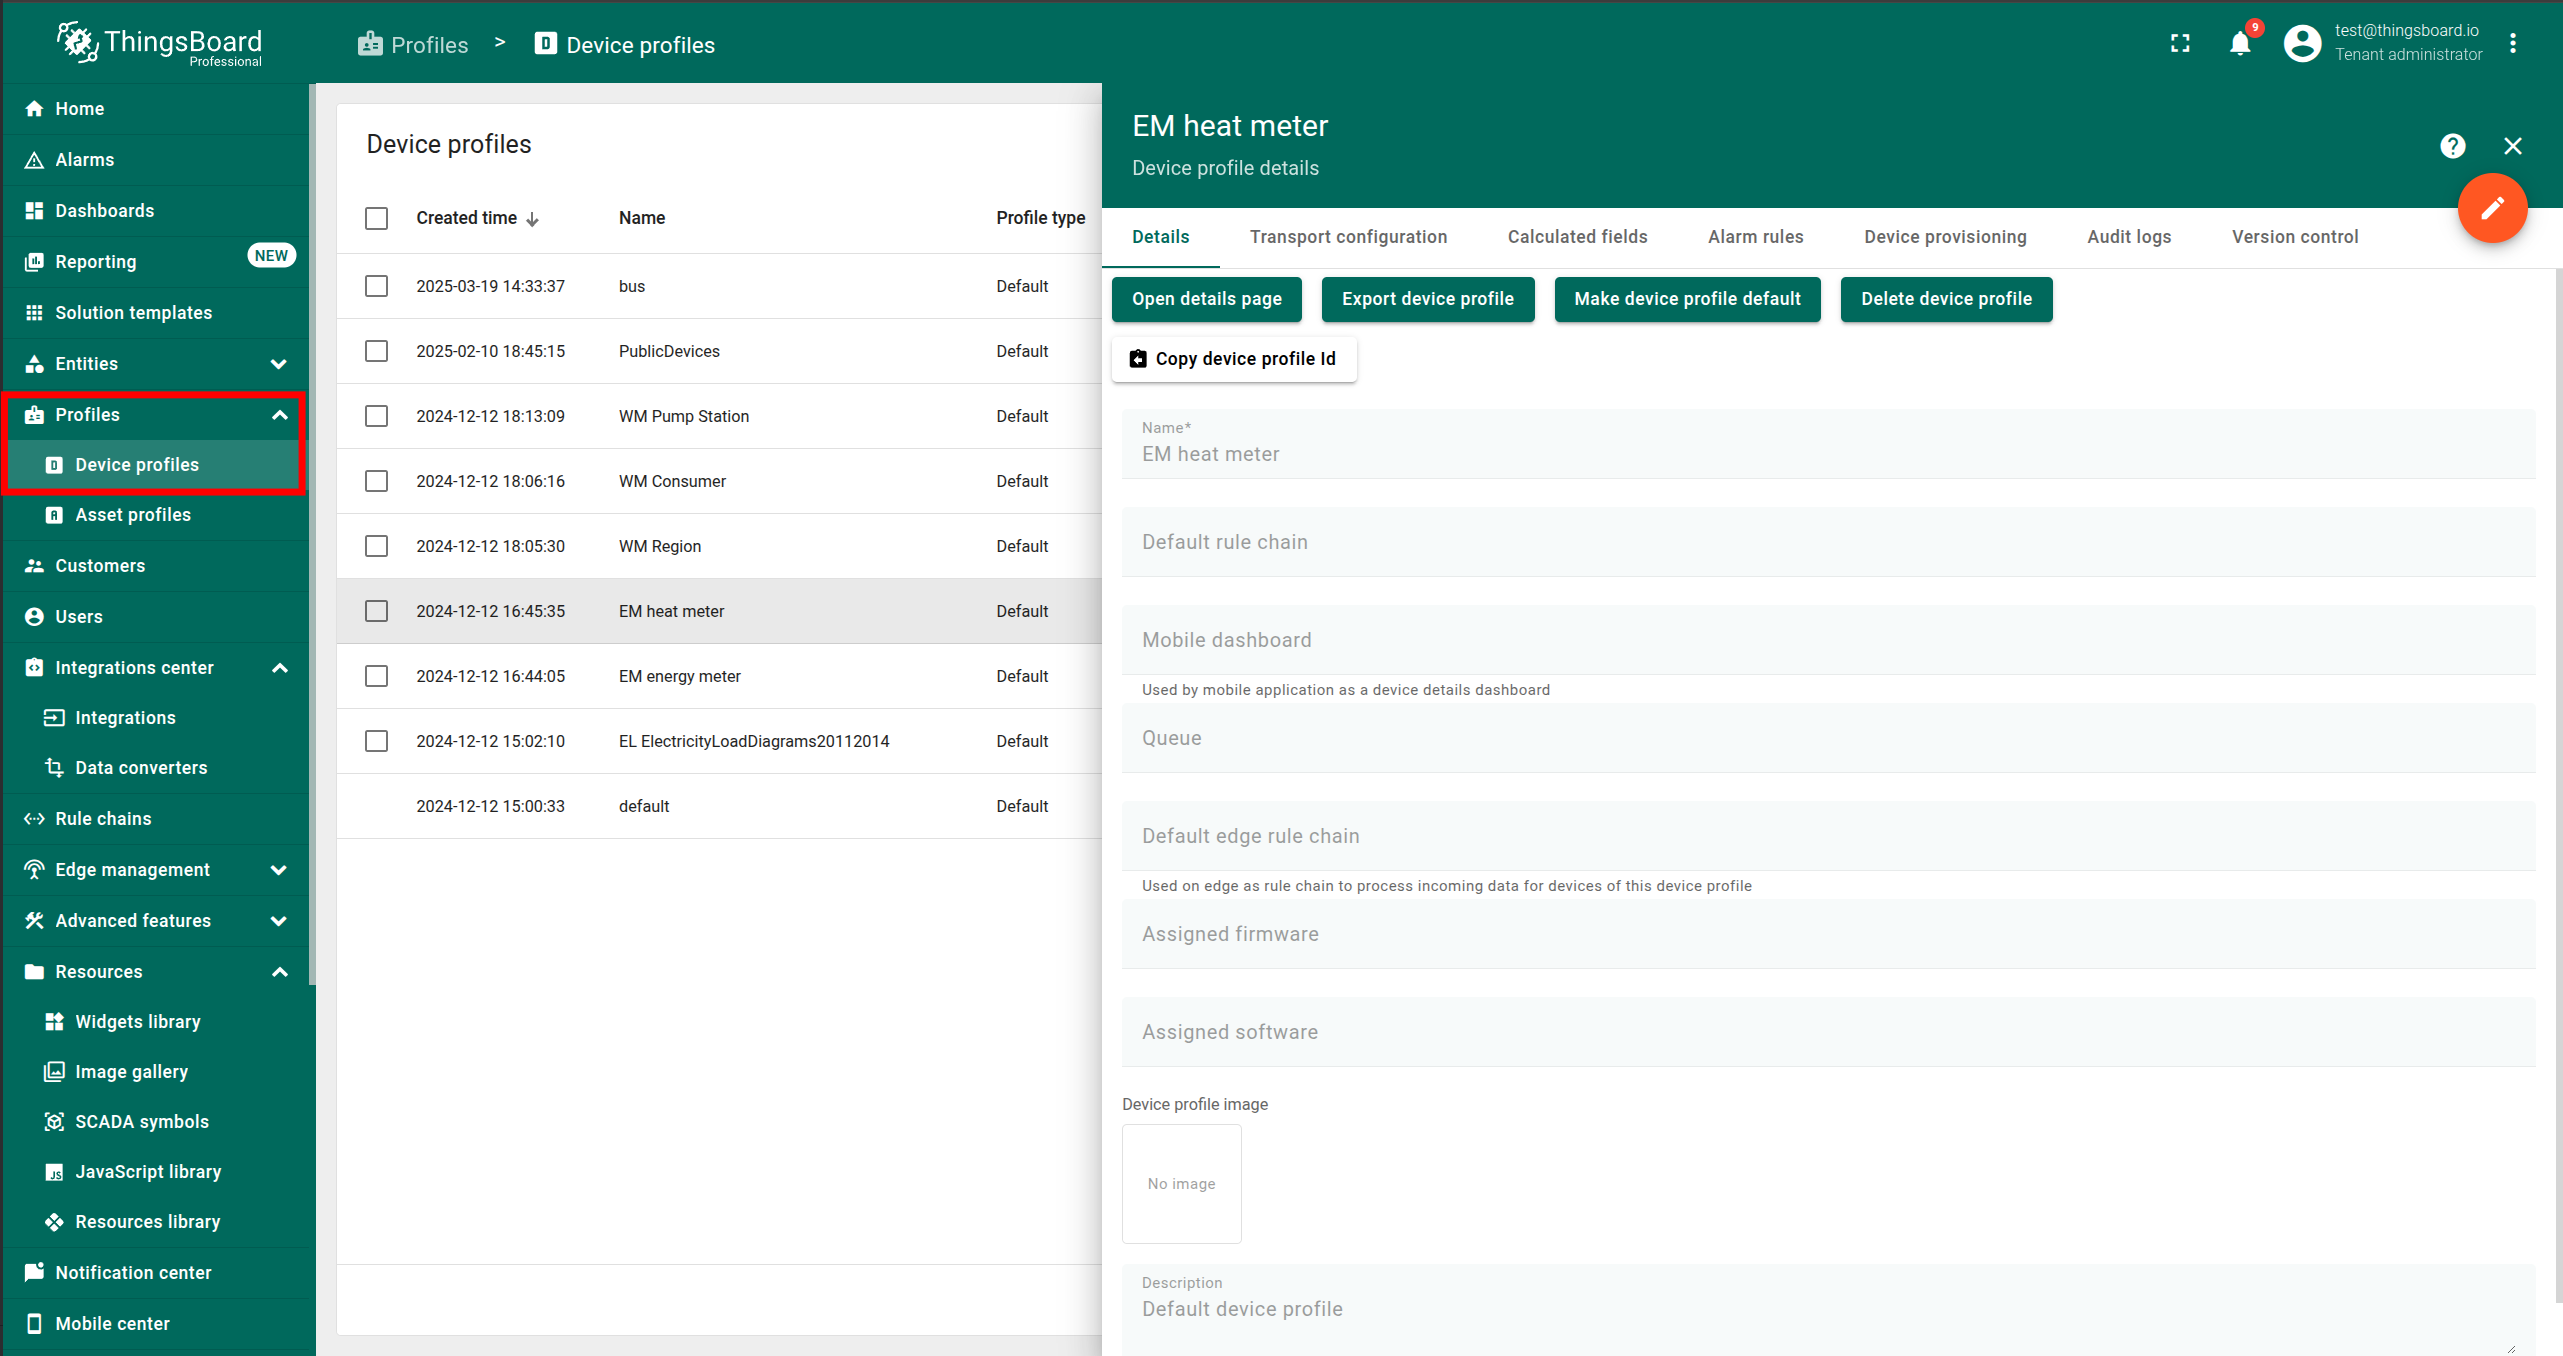
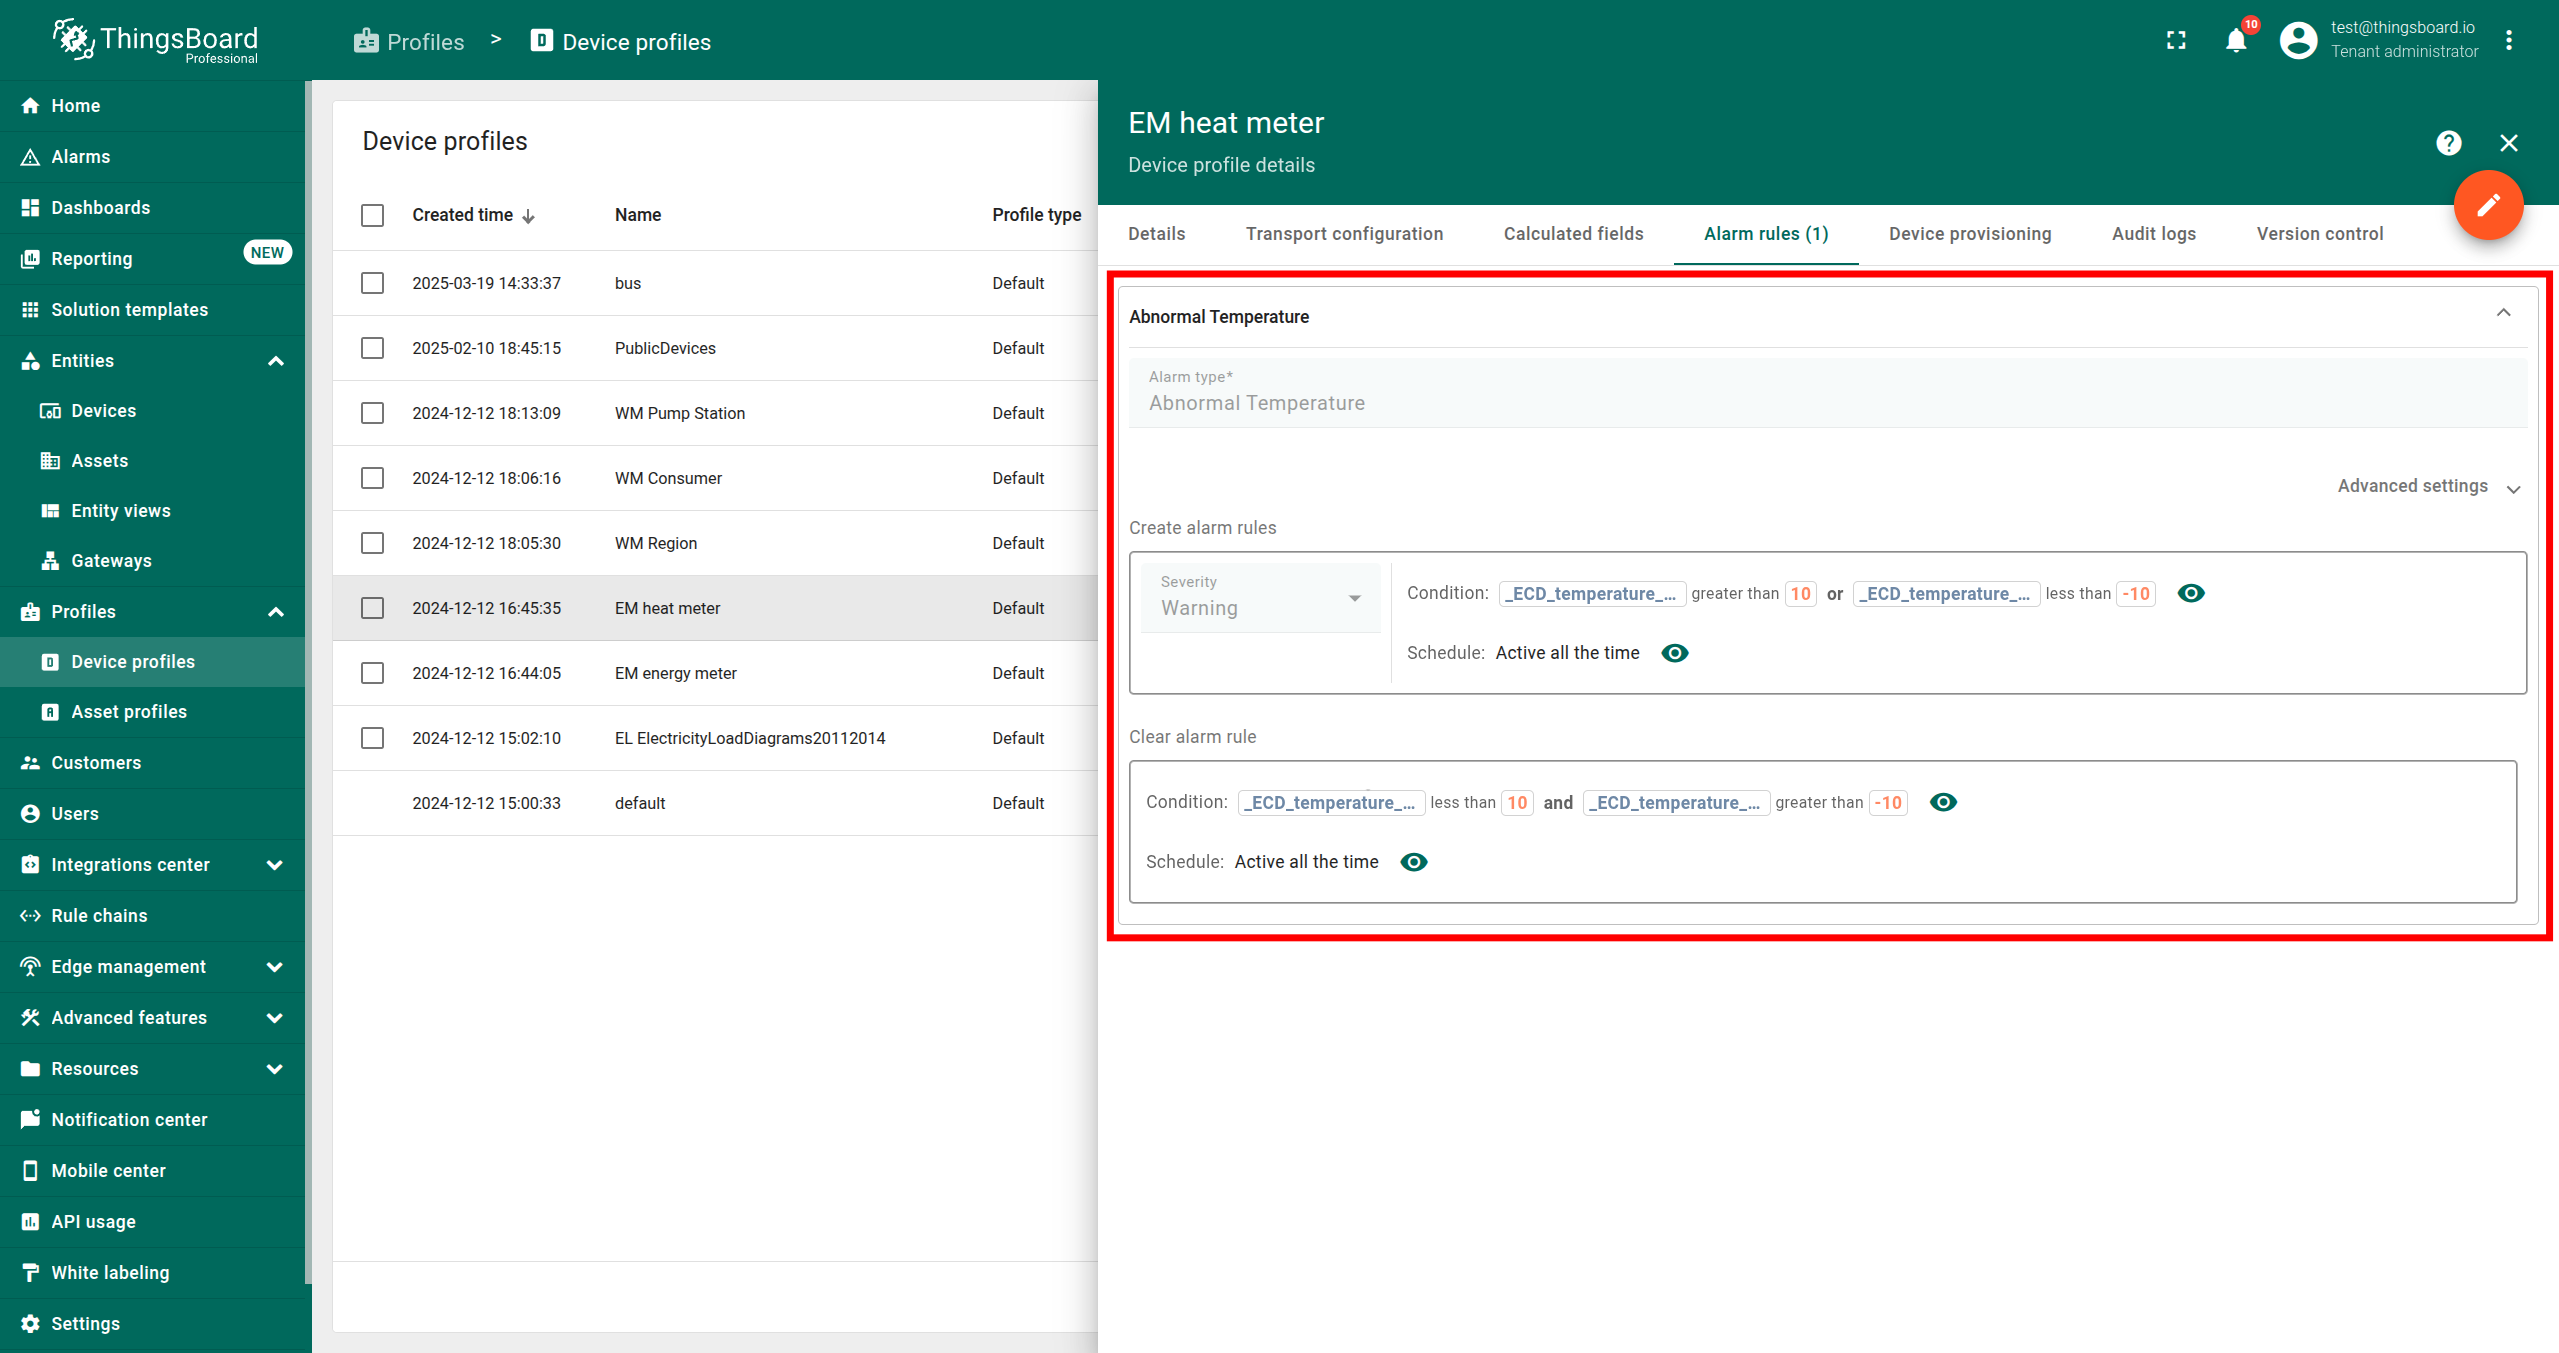
- Open the entity profile where the calculation is created.
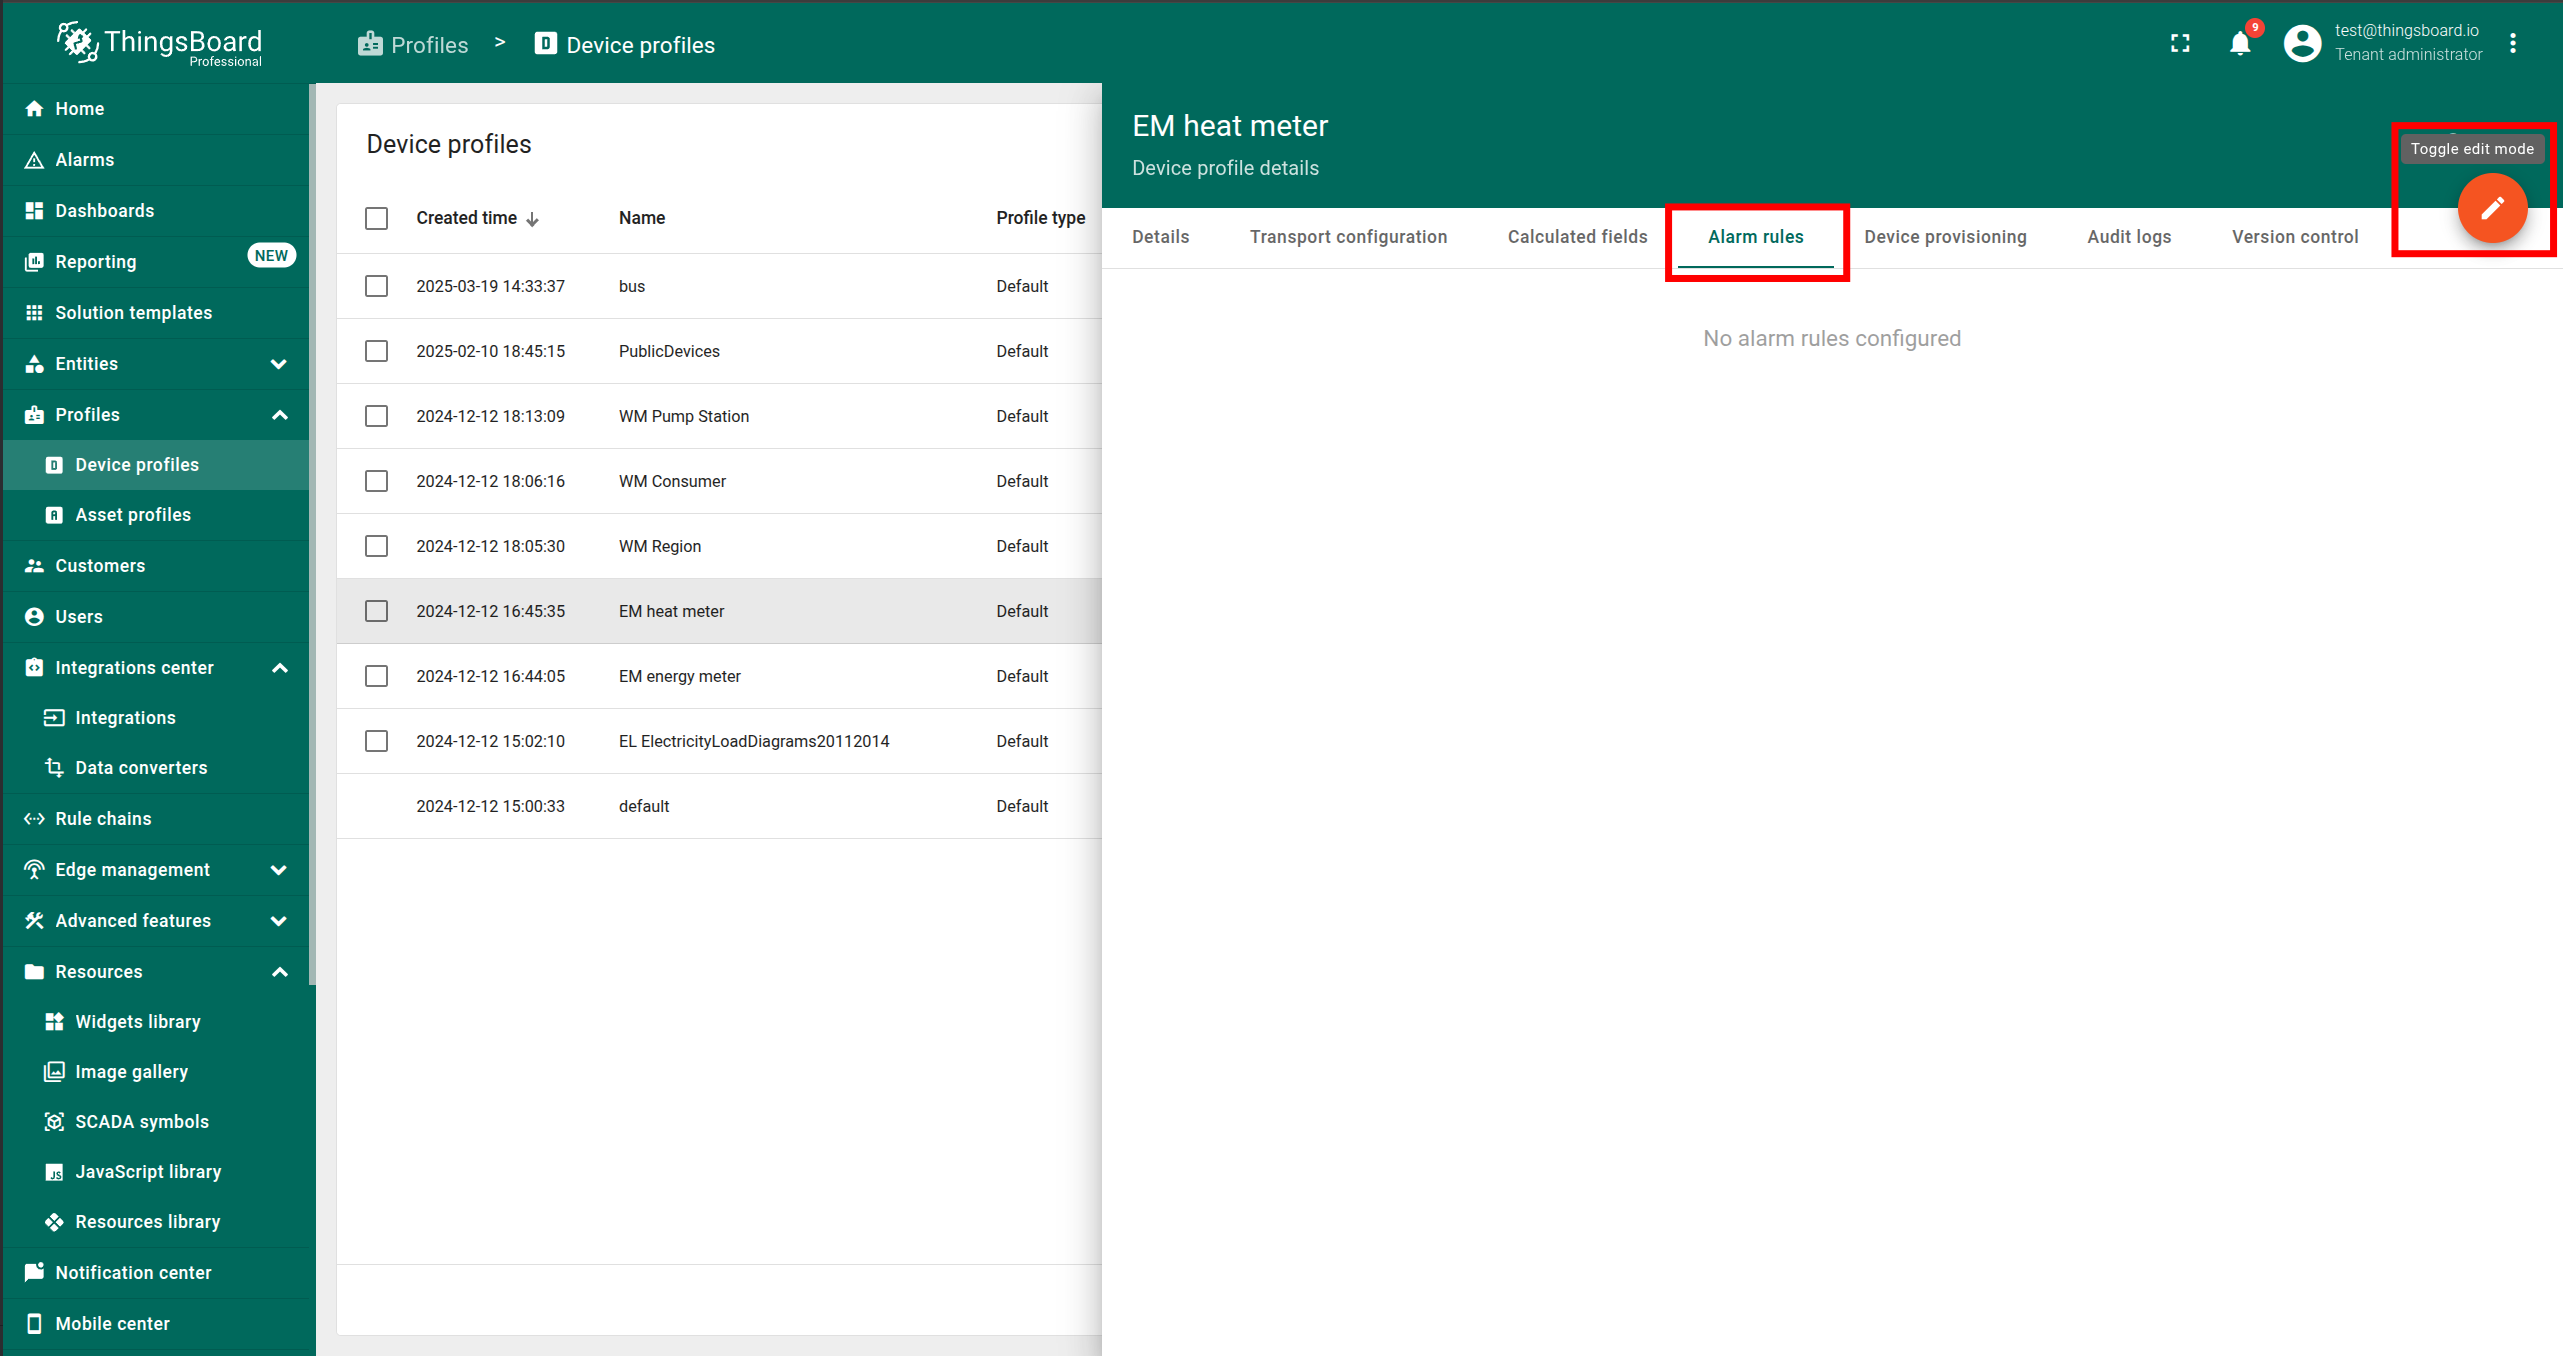
- Navigate to Alarm Rules and toggle Edit mode.
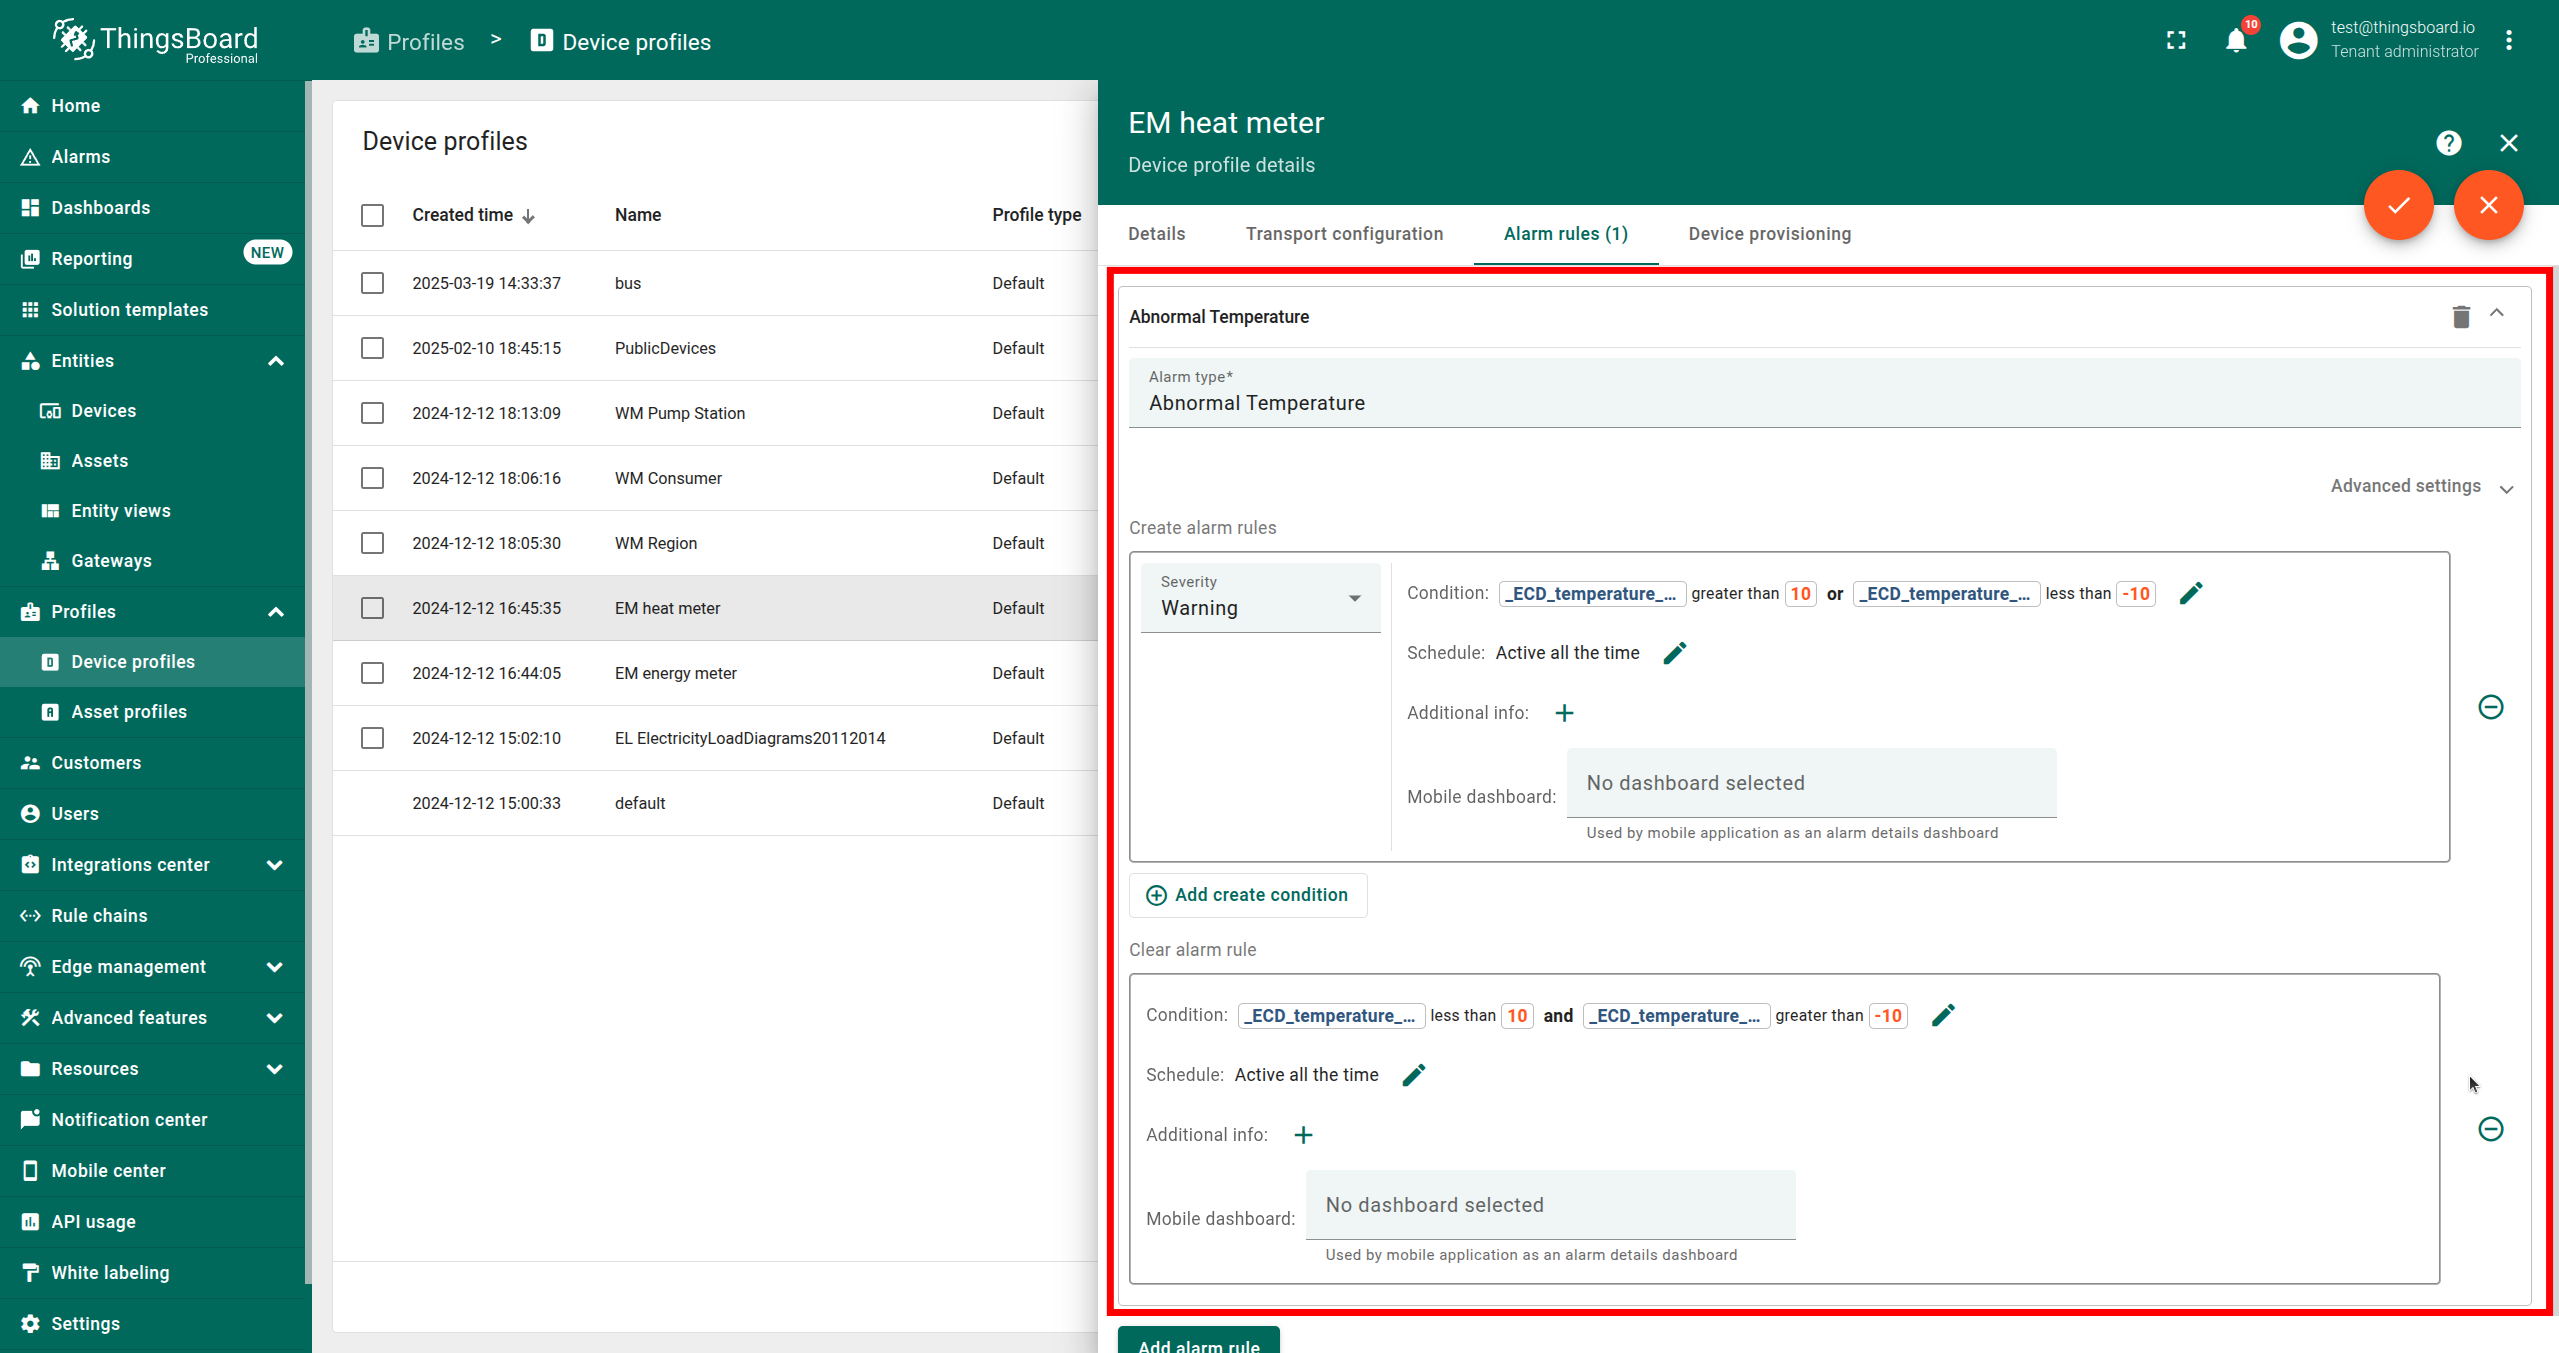
- Click Add alarm rule and set up create and clear alarm rules.
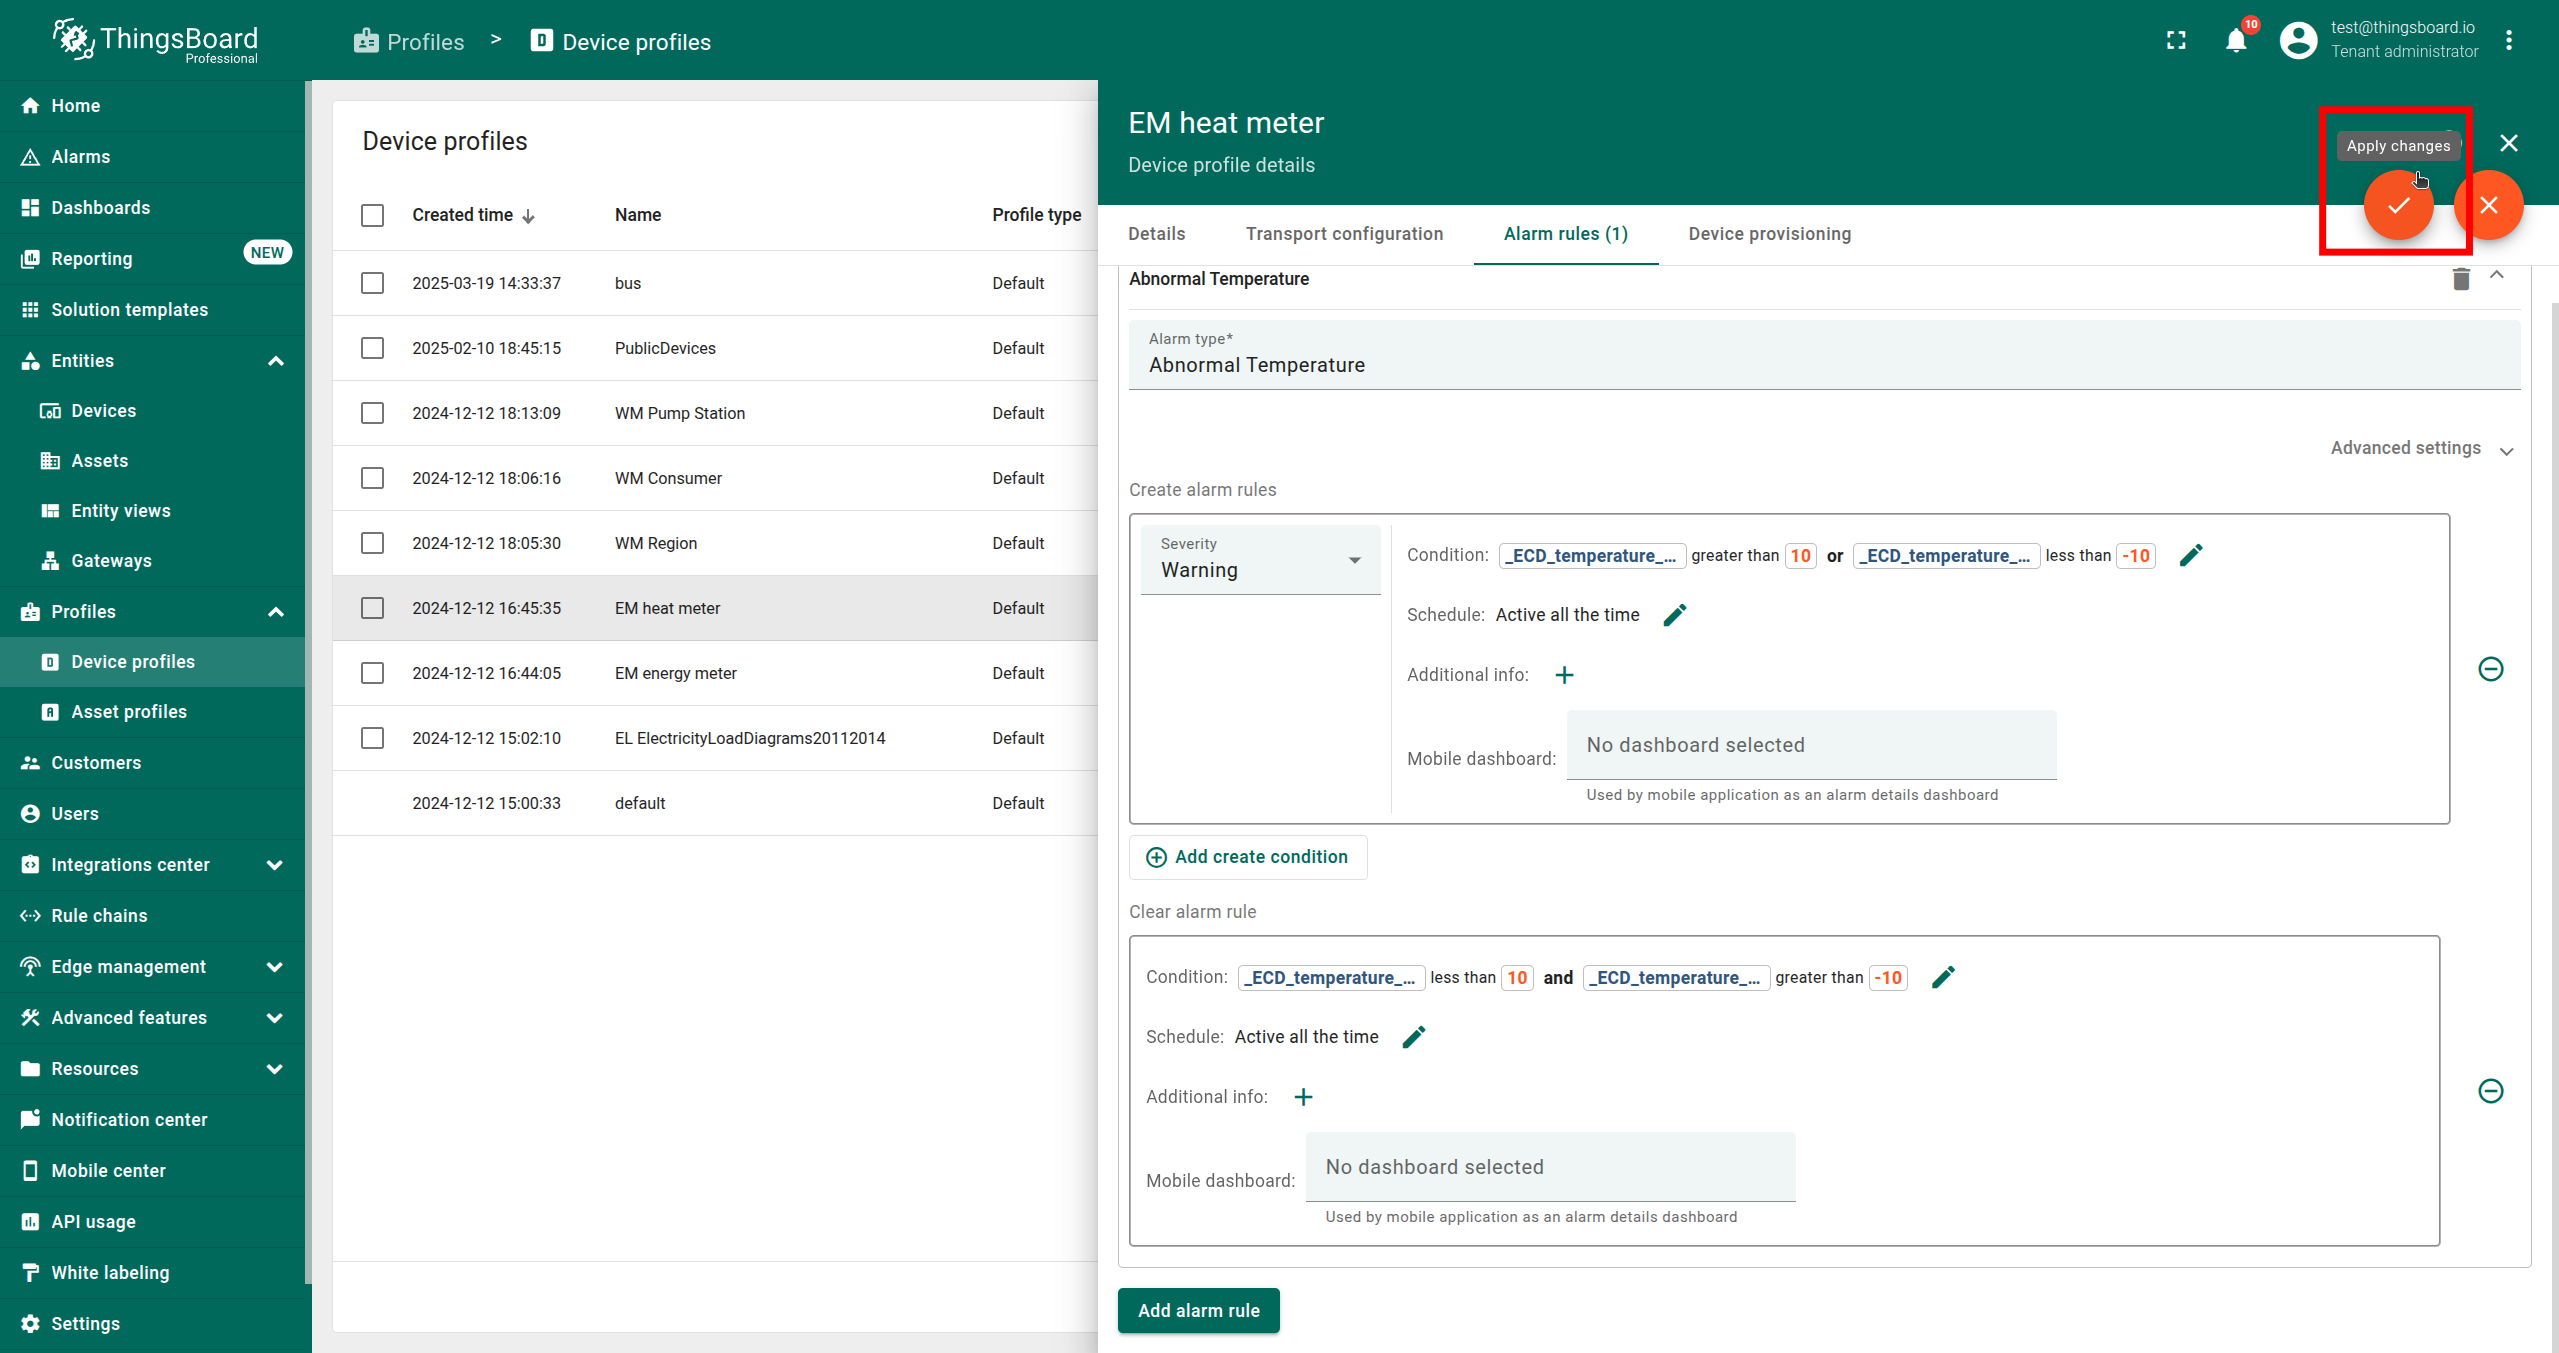
- Click Apply changes.
Example: You can create a metric that calculates deviations from the average temperature for sensors in a building.
If the deviation exceeds a threshold, an alarm will be triggered. This can detect device overheating or events such as a
forgotten open window or broken refrigerator.
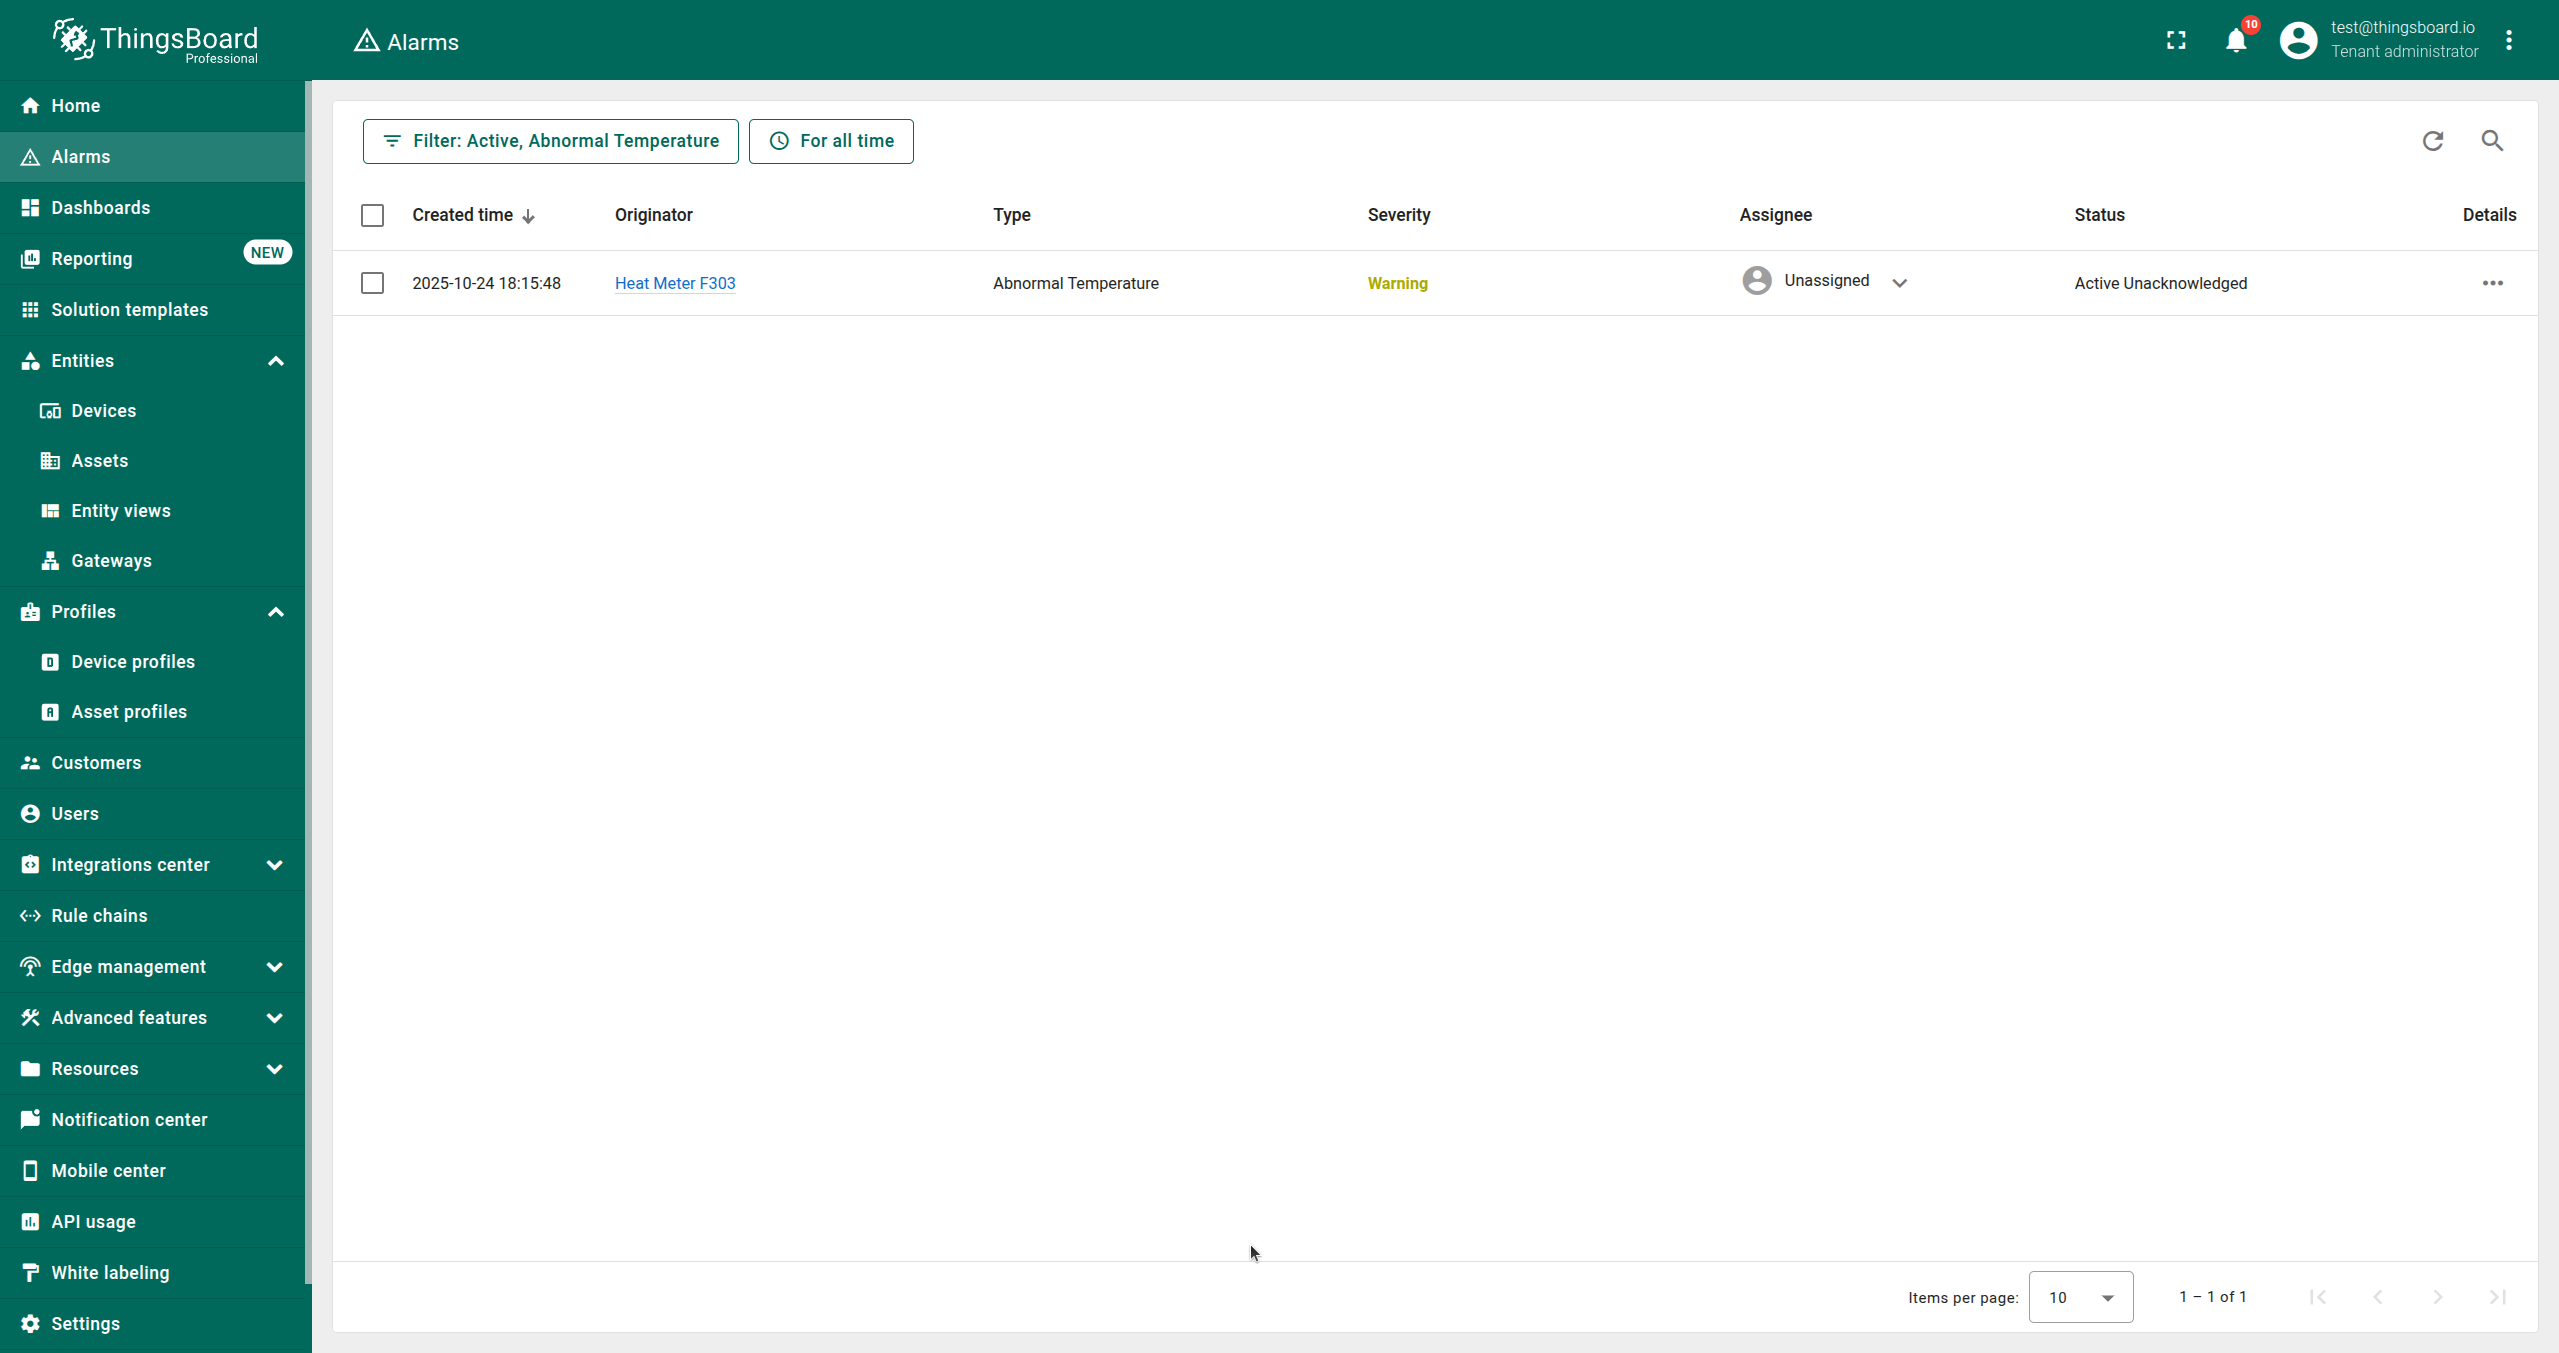
In this example, we created an alarm rule that triggers alarms when the absolute temperature deviation is greater than 10 and clears them when it is not. The alarm type is “Abnormal Temperature” and the severity is “Warning”.
Whenever the calculation refresh produces values that meet the alarm conditions, an alert will be triggered.
Trendz Visualizations
Visualize the generated metric using any Trendz widget, such as a line chart, heatmap, or state view (from the Range Analysis tab). You can also share the view with ThingsBoard.
Read about Trendz Visualizations here.
Read about how to share Trendz Views with ThingsBoard here.
Predict Future Values
You can use Trendz Prediction Models to forecast future values of the generated metric. You can then visualize them and share this view with ThingsBoard.
Learn more about prediction models here.
Detect Anomalies
You can detect anomalies or outages in the generated metric using Trendz Anomaly Models. If an anomaly is found, you can set up automatic alarm creation.
Learn more about anomaly detection here.
Next Steps
-
Getting started guide - These guide provide quick overview of main Trendz features.
-
Installation guides - Learn how to setup ThingsBoard on various available operating systems.
-
Anomaly Detection - Learn how to identify anomalies in the data.
-
Calculated Fields - Learn about Calculated fields and how to use them.
-
States - Learn how to define and analyse states for assets based on raw telemetry.
-
Prediction - Learn how to make forecasts and predict telemetry behavior.
-
Filters - Learn how filter dataset during analysis.
-
Available Visualizations - Learn about visualization widgets available in Trendz and how to configure them.
-
Share and embed Visualizations - Learn how to add Trendz visualizations on ThingsBoard dashboard or 3rd party web pages.
-
AI Assistant - Learn how to utilize Trendz AI capabilities.