Introduction
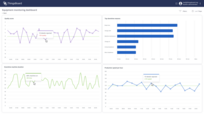
A manufacturing plant produces automotive parts and operates 24/7. The plant has three assembly lines, and each line has an Overall Equipment Efficiency (OEE) score of 85%, 90%, and 75%, respectively. By utilizing data from iot sensors, installed near assembly lines in smart factory, and analyzing real-time data from the assembly lines, we can track Availability, Performance, and Quality indicators for the whole plant and for each individual part in assembly line. Once we will track those metrics in real-time and on daily basis we would be able to analyze equipment downtime reasons and identify the root cause of the low OEE score, like unplanned downtime, low performance, or low quality.
Task definition: Track OEE score for the whole plant and for each assembly line in real-time and on daily basis.
Implementation plan
- Compute Availability metric for assembly lines by tracking amount and reasons of downtime events.
- Identify top 5 downtime reasons for each assembly line to perform root cause analysis.
- Analyze Performance metric by tracking speed of production compared to the planned speed.
- Compute Quality metric based on amount of rejected parts and rejection reasons.
Getting started:
Prerequisites
Lets take a look at entities that exists in ThingsBoard in scope of the solution that we are discussing. It is important to understand how they are connected between each other and what raw telemetry we receive from sensors. The mechanisms how entities and sensors are provisioned are out of scope of this guide. You can find details how to do that in our documentation. So here is how our domain model looks like:
Manufacturing plantregistered in ThingsBoard as an asset.Assembly lineregistered in ThingsBoard as devices and has a relation to the manufacturing plant asset.- On-site Gateway collects data from assembly lines via modbus protocol and sends it to ThingsBoard as a telemetry.
- Following metrics colelcted from assembly line:
powerUsageWh- amount of energy consumed by assembly line in WhproducedParts- amount of parts producedrejectedParts- amount of parts rejected during quality checkstatus- current status of assembly line (running, stopped, maintenance, etc)reason- reason of downtime event (maintenance, lack of materials, etc)
Step 1: Analyze equipment downtime duration and compute Availability metric
We have all required information from assembly line to compute how much time it was down and what was the reason. Every 30 seconds we receive energy consumption details from assembly line
in the format {powerUsageWh: 10, ts: 1675421880000}. Also, each time when equipment is stopped operator select the reason and ThingsBoard receive an event about status change in the format {status: "stopped", reason: "maintenance", ts: 1675421880000}.
To analyze how much time assembly line was operational or stopped we will use Trendz state fields. State field is a special type of field that can tell how much time equipment was in specific state based on simple boolean condition. So let’s start:
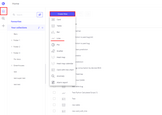
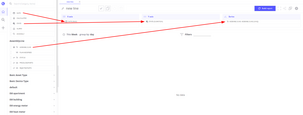
- Create Line chart in Trendz
- Add
Datefield into X-axis section - it allows to split data by month, week, day or hour - Add
assemblyLinefield into series section - it allows to split data by assembly line - Add State field into Y-axis section
- Change aggregation to
Duration percent- with this aggregation we will see how much time in % each assembly line was operational - Change label to
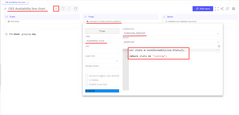
Availability score - Use following javascript formula to define operational state
- Change aggregation to
1
2
var state = none(assemblyLine.status);
return state == "running";
- Save view with the name OEE Availability line chart
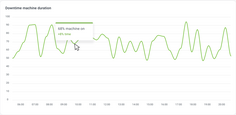
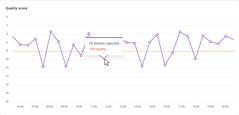
As a result we can see a real-time line chart that shows as OEE Availability score for each assembly line. Later we can add here a threshold to highlight when Availability score is below expected target so we can quicker react to potential problems.
Step 2: Build bar chart with top 5 downtime reasons for each assembly line.
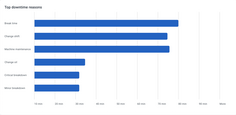
Now we want to know what are the most frequent downtime reasons in different machines. This data should be visualized in form of stacked bar chart where each bar represents one assembly line and each bar is split by top 5 downtime reasons.
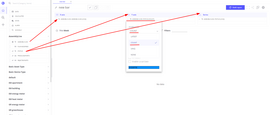
- Create Bar chart in Trendz
- Add
assemblyLinefield into X-axis section - it allows to split data by assembly line - Add
assemblyLine.statusfield into Series section with aggregationUNIQ- it allows to group data by status - Add
assemblyLine.statusfield into Values section with aggregationCOUNT- it allows to count amount of events for each status - Add
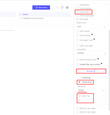
assemblyLine.statusfield into Filters and select all available statuses that represent downtime. - Open view settings
- Set sorting to
Descending - Set sorting column to
assemblyLine.status - Set
Limitto 5 - Enable checkbox
Stacked bar
- Set sorting to
- Save view with the name Availability: Top 5 downtime reasons
Step 3: Compare current and planned production speed
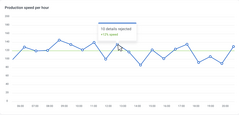
Performance score in OEE framework is a ratio of actual production speed to the planned speed. We have a planned speed for each assembly line stored as an attribute value and we can calculate actual speed based on the amount of produced parts.
Sensors on assembly line reports amount of produced parts every 60 seconds in the format {producedParts: 10, ts: 1675421880000}. We want to create a line chart that will show assembly line performance score for each line.
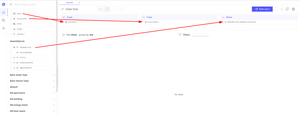
- Create Line chart in Trendz
- Add
Datefield into X-axis section - it allows to split data by month, week, day or hour - Add
assemblyLinefield into series section - it allows to split data by assembly line - Add Calculated field into Y-axis section
- Change label to
Perfromance score - Enable
Batch calculationcheckbox - we want to use raw telemetry values to calculate performance score - Use AVG aggregation - we want to calculate average performance score for each time interval because user can switch intervals between hour, day, week and month
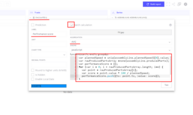
- Use following javascript formula to calculate performance score
- Change label to
1
2
3
4
5
6
7
8
9
10
11
var plannedSpeed = uniq(assemblyLine.plannedSpeed)[0].value;
var rawProducedPartsArray = none(assemblyLine.producedParts);

var performanceScore = [];
for (var i = 0; i < rawProducedPartsArray.length; i++) {
  var point = rawProducedPartsArray[i];
  var score = point.value * 100 / plannedSpeed;
  performanceScore.push({ts: point.ts, value: score});
}

return performanceScore;
- Save view with the name OEE Performance score line chart
In this view we are using batch calculated fields because we need to get access to raw values reported from sensors. Once transformation performed, Trendz would apply selected aggregation function, in our case AVG, to the result array to receive single value for each time interval and assembly line. Opposite to this, simple calculated field apply aggregation before transformation.
Step 4: Compute Quality score based on amount of rejected parts
Final aspect to analyze is a Quality score that would tell how many rejected parts we have and how it differs between assembly lines, because some equipment may have mechanical losses or non-experienced operators in the shift and as a result we will have more rejected parts.
This information is submitted from sensors in the following format: {rejectedParts: 10, ts: 1675421880000}. We want to create a line chart that will show assembly line quality score for each line.
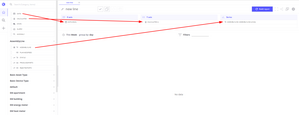
- Create Line chart in Trendz
- Add
Datefield into X-axis section - it allows to split data by month, week, day or hour - Add
assemblyLinefield into series section - it allows to split data by assembly line - Add Calculated field into Y-axis section
- Change label to
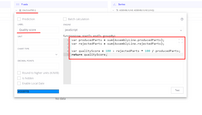
Quality score - Use following javascript formula to calculate quality score
- Change label to
1
2
3
4
5
var producedParts = sum(assemblyLine.producedParts);
var rejectedParts = sum(assemblyLine.rejectedParts);

var qualityScore = 100 - rejectedParts * 100 / producedParts;
return qualityScore;
- Save view with the name OEE Quality score line chart
In the formula for calculated field we are computing percent of ‘good’ details produced by assembly line.
Summary
By tracking OEE scores and their components for each assembly line, we can pinpoint the specific factors that are impacting efficiency and identify opportunities for improvement. This knowledge allows plant managers to implement targeted solutions to address the unique challenges faced by each assembly line, ultimately resulting in a more efficient and productive manufacturing plant. By analyzing data on Availability, Performance, and Quality, plant managers can identify the root causes of low OEE scores and develop targeted solutions to improve them. Through continuous monitoring and improvement, the plant can optimize its assembly lines, reduce downtime, and produce higher quality parts at a faster rate. As technology continues to evolve, real-time data collection and analysis will become even more important for ensuring the success and competitiveness of manufacturing plants.
