- Introduction
- Prerequisites
- Step 1. Discover topology
- Step 2. Create line chart view
- Step 3. Add line chart to ThingsBoard Dashboard
- Step 4. Calculate New Metrics
- Step 5. Predict energy usage
- Step 6. Find anomalies in energy consumption
- Step 7. Try AI Assistance
- Next Steps
Introduction
The goal of this tutorial is to demonstrate the basic usage of Trendz Analytics. You will learn how to:
- Log in to Trendz for the first time
- Discover topology from ThingsBoard
- Create basic visualizations
- Add a Trendz view to a ThingsBoard dashboard
- Calculate new telemetry based on existing telemetry
- Predict telemetry using historical data
- Detect anomalies in telemetry data
- Interact with Trendz AI Assistant
Prerequisites
You will need to have a Trendz Analytics up and running. The easiest way is to use Trendz Analytics add-on in ThingsBoard Cloud SaaS.
Alternatively, you can install Trendz Analytics using the Installation Guide.
For this guide, we will use Building and Apartment assets, along with Heat Meter and Energy Meter devices.
To follow along, you can use your own devices and apply the same concepts. If you don’t have any devices, you can try any available solution template.
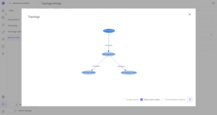
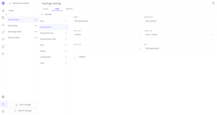
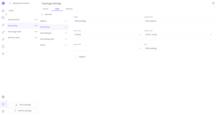
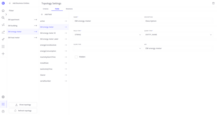
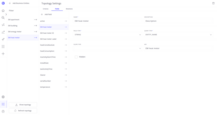
The full set of fields and relationships used in this guide is shown below:
Step 1. Discover topology
Once the Trendz Service is up and running, you can sign in to the Trendz UI using the following URL:
- ThingsBoard Cloud (North America): https://thingsboard.cloud/trendz/
- ThingsBoard Cloud (Europe): https://eu.thingsboard.cloud/trendz/
- Self-hosted Trendz: http://localhost:8888/trendz/
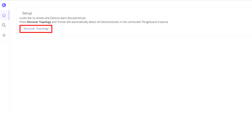
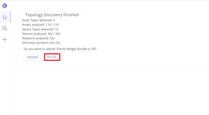
You can log in using Tenant Administrator credentials from ThingsBoard. Any Tenant Administrator or Customer User can sign in to the Trendz UI using the same login/password they use in ThingsBoard.
Step 2. Create line chart view
Let’s create a line chart with all buildings and visualize the amount of consumed electricity for each building for today.
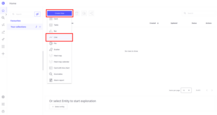
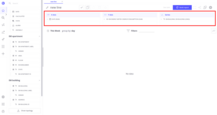
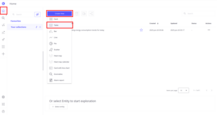
- On the home page, click the Create view button and select Line
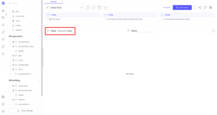
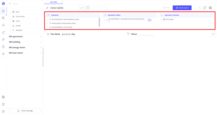
You can select fields from the entities listed on the left side of the screen and drag and drop them into the appropriate section. The date field can be dragged and dropped from the upper-left part of the screen. Add all necessary fields to each section:
- Add
Date (RAW)to the X axis section (date field) - Add
EM energy meter.energyConsumptionto the Y axis section (energy consumption telemetry) - Add
EM building.EM buildingto the Series section (name of the building)
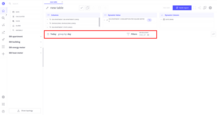
Set up date options:
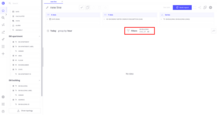
- Set the date picker to Today, and set Group by to Hour
Set up the filters:
- Add
EM building.EM buildinginto the filters section to view the consumption of a specific building
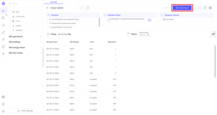
Build and save the view:
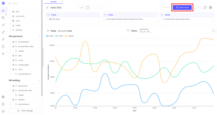
- Click Build report — you will see a generated line chart, broken down by buildings
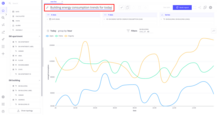
- Rename the view by clicking the pencil icon next to the name and name it Building energy consumption trends for today
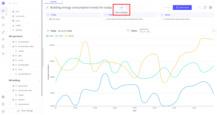
- Click the Save Changes button to save the chart
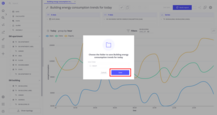
- In the pop-up section, click the Save button
You can find out more about different types of views you can build with Trendz here
Step 3. Add line chart to ThingsBoard Dashboard
Now we can add this line chart to a ThingsBoard dashboard.
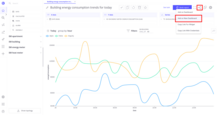
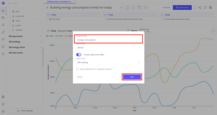
- Click the Share to ThingsBoard button and choose Add on New Dashboard
- Set the dashboard name to
Energy consumption; leave the rest of the settings as default. Click the Add button. - On the ThingsBoard platform, you will see a new dashboard named
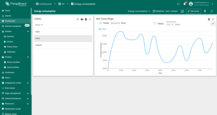
Energy consumptionwith a generated alias and Trendz line view (you can check charts for each building by clicking on each building in the table).
A new dashboard in ThingsBoard is created, and your chart is there with the ability to filter by building.
You can find more about sharing views here
Step 4. Calculate New Metrics
Now we will create a table with all buildings and apartments and calculate the amount of electricity and heat consumption per square meter for each apartment.
Create a Calculated Field
Firstly, we will create a calculated field, it could be used across multiple views.
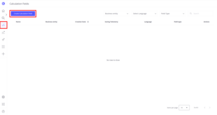
- Go to the Calculated Fields page by clicking the calculator icon on the left panel
- Click the Create Calculated Field button
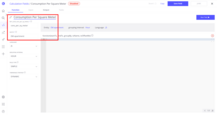
- Set the name to
Consumption Per Square Meter - Set the key to
cons_per_sq_meter - Set the entity to
EM apartment -
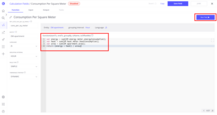
Copy and paste the following code into the code editor:
1
2
3
4
var energy = sum(EM energy meter.energyConsumption);
var heat = sum(EM heat meter.heatConsumption);
var area = sum(EM apartment.area);
return (energy + heat) / area;
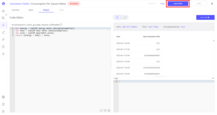
- Click Run Test to validate the calculation
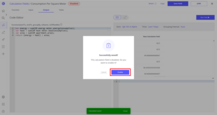
- Click Save Field to save it
- In the popup window, click Enable
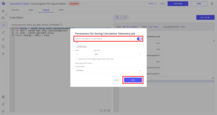
- Enable calculation result saving and click the Save button (you can leave the other properties as default)
Your calculated field is now ready to use. Learn more about calculated fields here.
Use the Calculated Field in a View
Now we will use the created calculated field in the new view:
- On the home page, click the Create view button and select Table
Add all necessary fields to each section:
- In the Columns section, add:
EM apartment.EM apartmentEM building.EM buildingEM apartment.state
- In the Dynamic Value section, add:
EM apartment.Consumption Per Square Meter(This field will appear after enabling the calculation field)
- In the Dynamic Column section, add:
Date (RAW)
Set up date fields and filters:
- Set the date picker to Today
- Add
EM building.EM buildinginto the filters section to view the consumption of a specific building
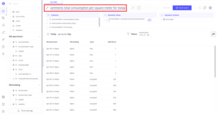
Build and save view:
- Click Build report
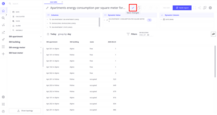
- Rename the view to Apartments total consumption per square meter for today
- Click the Save Changes button to save the chart
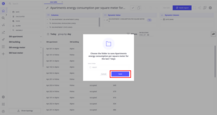
- In the pop-up section, click the Save button
Step 5. Predict energy usage
The next step is to create a forecast of energy usage for the current week for each building using historical data.
Create a Prediction Model
Firstly, we will create a prediction model. It could be used across multiple views like calculated fields.
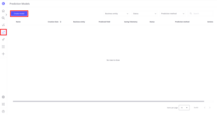
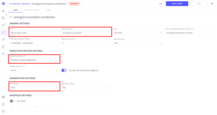
- Go to the Prediction Model page by clicking the prediction icon on the left panel
- Click the Create model button
- Set the entity to
EM energy meter - Set the prediction field to
energyConsumption - Set the prediction method to
FOURIER_TRANSFORMATION - Set the aggregation to
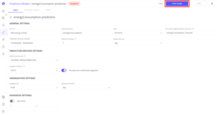
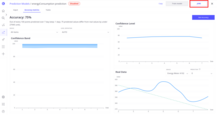
SUM - Click the Train Model button and wait until the accuracy tab is shown
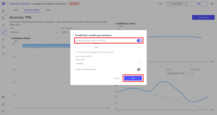
- Click the Jobs button; in the popup window, enable prediction model refreshing and click the Save button (you can leave the other properties as default)
Your prediction model is now ready to use. Learn more about prediction models here.
Create a View with Forecast
Now we will use the created prediction model in the new view:
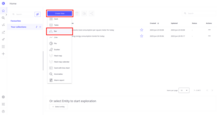
- Click the Create view button and select Bar
Add all necessary fields to each section:
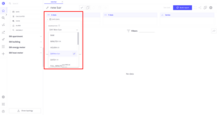
- In the X Axis section, add:
Date (DAY Mon-Sun)
(To select it, click on the date field in the X Axis section, and choose the appropriate aggregation using the dropdown. Click anywhere on the screen to close it.)
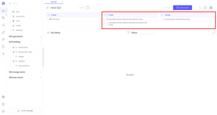
- In the Y Axis section, add:
EM energy meter.energyConsumptionEM energy meter.Energy Consumption Forecast(This field will appear after enabling the prediction model)
- In the Series section, add:
EM building.EM building
Build and save view:
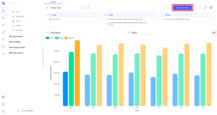
- Click Build report
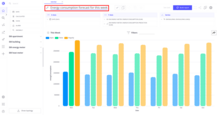
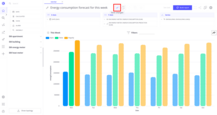
- Rename the view to Energy consumption forecast for this week
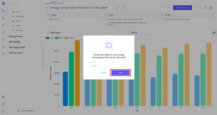
- Click the Save Changes button to save the chart
- In the pop-up section, click the Save button
You can try the same with a line chart and compare the results.
Historical data for each building is visualized with solid bars, and the forecast is shown with dashed bars.
Step 6. Find anomalies in energy consumption
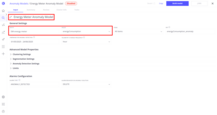
Trendz supports out-of-the-box anomaly detection tools. Let’s explore them by finding anomalies in the energy consumption telemetry.
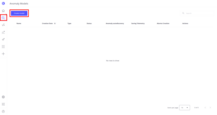
- Go to the Anomaly Models page by clicking the Anomalies icon on the left panel
- Click the Create model button
- Set the entity to
EM energy meter - Set the fields to
energyConsumptiononly - Set the name to
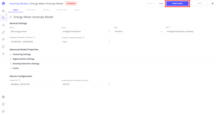
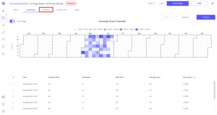
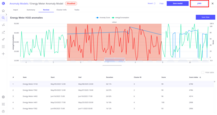
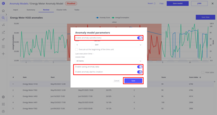
Energy Meter Anomaly Model - Click Build Model, go to the Review tab, and validate the detected anomalies
Now we can set up an anomaly refresh job to automatically find anomalies and create alarms in ThingsBoard for them. To do this, you need to:
- Click the Jobs button; in the popup window:
- Enable anomaly model refreshing
- Enable saving anomaly data (to ThingsBoard)
- Enable anomaly alarms creation (in ThingsBoard)
- Click the Save button
Now, as soon as an anomaly occurs, the anomaly model will detect it and an alert will be created immediately. You can find out more about anomaly models here.
Step 7. Try AI Assistance
Let’s explore AI Assistance — an AI-powered feature that can build views based on your natural language requests.
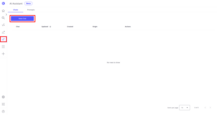
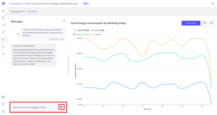
- Go to the Assistant page and click New Chat
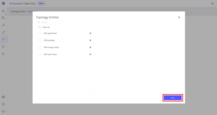
- When prompted to select topology entities, click Save
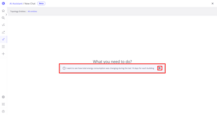
- In the chat input, type: “I want to see how total energy consumption was changing during the last 14 days for each building”
- Review the generated view and validate the results
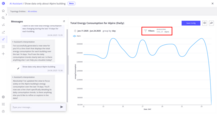
- Then, type a follow-up instruction: “Show data only about Alpire building”
- Observe that a building filter has been added automatically
You can read more about AI Assistance here
Next Steps
-
Installation guides - Learn how to setup ThingsBoard on various available operating systems.
-
Metric Explorer - Learn how to explore and create new metrics with Trendz Metric Explorer.
-
Anomaly Detection - Learn how to identify anomalies in the data.
-
Calculated Fields - Learn about Calculated fields and how to use them.
-
States - Learn how to define and analyse states for assets based on raw telemetry.
-
Prediction - Learn how to make forecasts and predict telemetry behavior.
-
Filters - Learn how filter dataset during analysis.
-
Available Visualizations - Learn about visualization widgets available in Trendz and how to configure them.
-
Share and embed Visualizations - Learn how to add Trendz visualizations on ThingsBoard dashboard or 3rd party web pages.
-
AI Assistant - Learn how to utilize Trendz AI capabilities.