This guide describes how Trendz uses entities from ThingsBoard, like asset, device, relation, etc.
Business Entities Topology
Let’s assume that we have a Smart Building solution. Our topology contains Buildings, Apartments and different Meters that are connected with each other using relations. Here is how our topology will look like:

In fact, Trendz operates with this topology as with the flat table that has columns for all attributes/telemetry from all Devices/Assets in this topology. The Relation between entities used to join fields from different Business Entities.
How it works
Now let’s check how Trendz resolves data from ThingsBoard using following report: we are using only 2 fields from Smart Building topology:
building namethat belongs to the Building Assetenergytelemetry, that belongs to the Energy Meter Device- aggregation type
SUM -
time range - last month
- Trendz will find all available buildings in the ThingsBoard.
- Then all Apartments for each Building.
- Finally, all Energy Meters that belong to the apartment.
- After that, for all Energy Meters for each building, Trendz will load all energy telemetry for the last month
- Trendz aggregates all loaded telemetry using
SUMaggregation. - As a result we can see how much energy was consumed by each building.
It is not an exact algorithm description and there are a lot of optimizations performed in the background. But it allows to understand how much complexity handled inside Trendz, so you can focus on analytics but not on data fetching.
Managing Relations Between Business Entities
ThingsBoard allows users to create multiple relationships between devices and assets without limitations. In Trendz Analytics, however, relationships are established between business entities (device/asset profiles) based on the underlying ThingsBoard relations. This approach introduces some constraints on how relations are handled within Trendz, specifically regarding the number of allowable relations between device/asset profiles.
In Trendz Analytics, a key constraint exists: only one relation type is permitted between device/asset profiles. This limitation is necessary to ensure a stable sequence of item loading. When there are multiple relations between the same device/asset profiles, Trendz is unable to determine which relation to use, leading to an undefined behavior that impacts data retrieval.
Example Scenario:
Let’s consider an example with the following profiles and relations:
- Profiles:
BuildingApartmentEnergyMeter
- Relations:
contains (Building → Apartment)contains (Apartment → EnergyMeter)connected (Apartment → EnergyMeter)
In this scenario, if a query is made to retrieve all EnergyMeters associated with a particular Building, Trendz would face uncertainty in determining which EnergyMeters to include in the result set—those connected directly to the Building or those that the Building contains through the intermediary Apartment.
This uncertainty arises because of the multiple relationships between Apartment and EnergyMeter.
Solution:
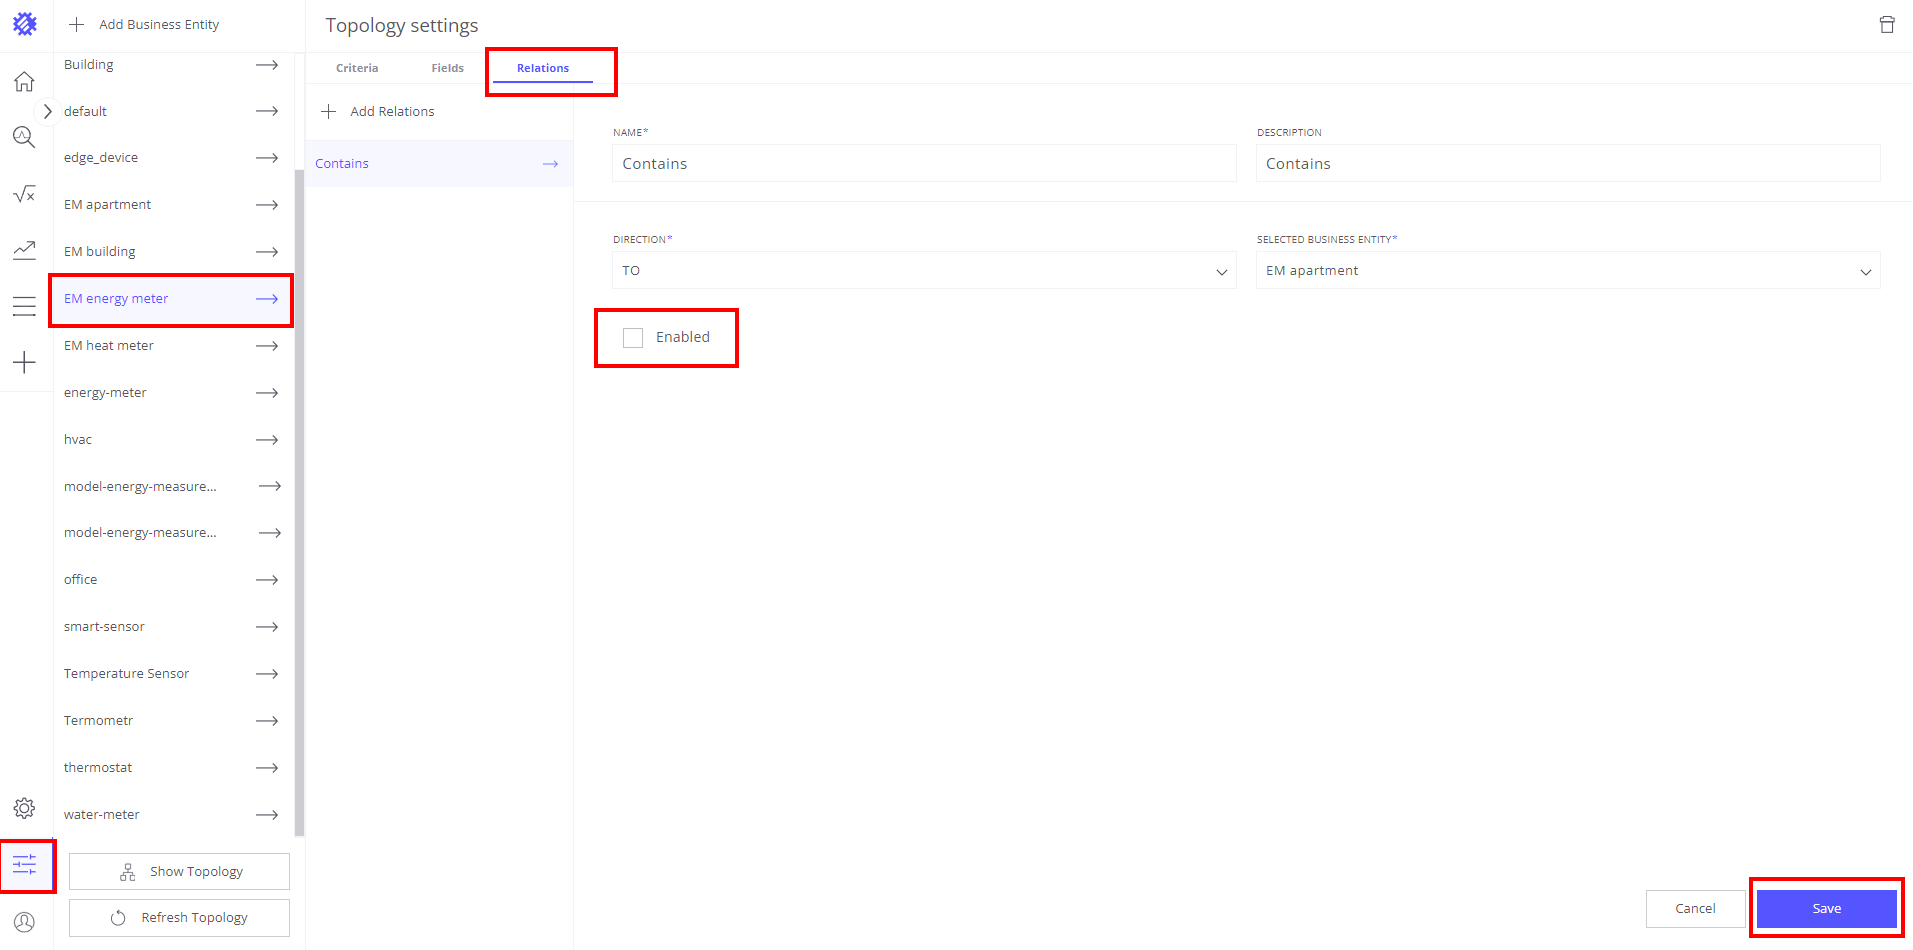
To resolve this issue and ensure correct query results, users must review and configure the relationships of their business entities using the Enabled checkbox feature on the Business Entity page. Follow the steps below:
- Navigate to the Business Entity Page: Click on the button located in the bottom-left corner of the page to access the Business Entity configuration.
- Select the Relevant Business Entity: Choose the business entity for which you want to modify the relations (e.g.,
EnergyMetersandApartment). - Open the Relations Tab: Once inside the selected business entity, go to the
Relationstab to view all associated relationships. - Disable Unwanted Relations: For each unwanted relation, uncheck the Enabled checkbox to deactivate it.
- Save Changes: Click the Save button to apply your changes.
This process ensures that only the necessary relations are active, preventing conflicts and enabling accurate report generation.
By following these steps, you can eliminate uncertainty and stabilize data queries in Trendz Analytics, making use of the “Enabled” checkbox feature to manage relationships effectively.
Next Steps
-
Getting started guide - These guide provide quick overview of main Trendz features.
-
Installation guides - Learn how to setup ThingsBoard on various available operating systems.
-
Metric Explorer - Learn how to explore and create new metrics with Trendz Metric Explorer.
-
Anomaly Detection - Learn how to identify anomalies in the data.
-
Calculated Fields - Learn about Calculated fields and how to use them.
-
States - Learn how to define and analyse states for assets based on raw telemetry.
-
Prediction - Learn how to make forecasts and predict telemetry behavior.
-
Filters - Learn how filter dataset during analysis.
-
Available Visualizations - Learn about visualization widgets available in Trendz and how to configure them.
-
AI Assistant - Learn how to utilize Trendz AI capabilities.