Anomaly Model Properties
General Settings
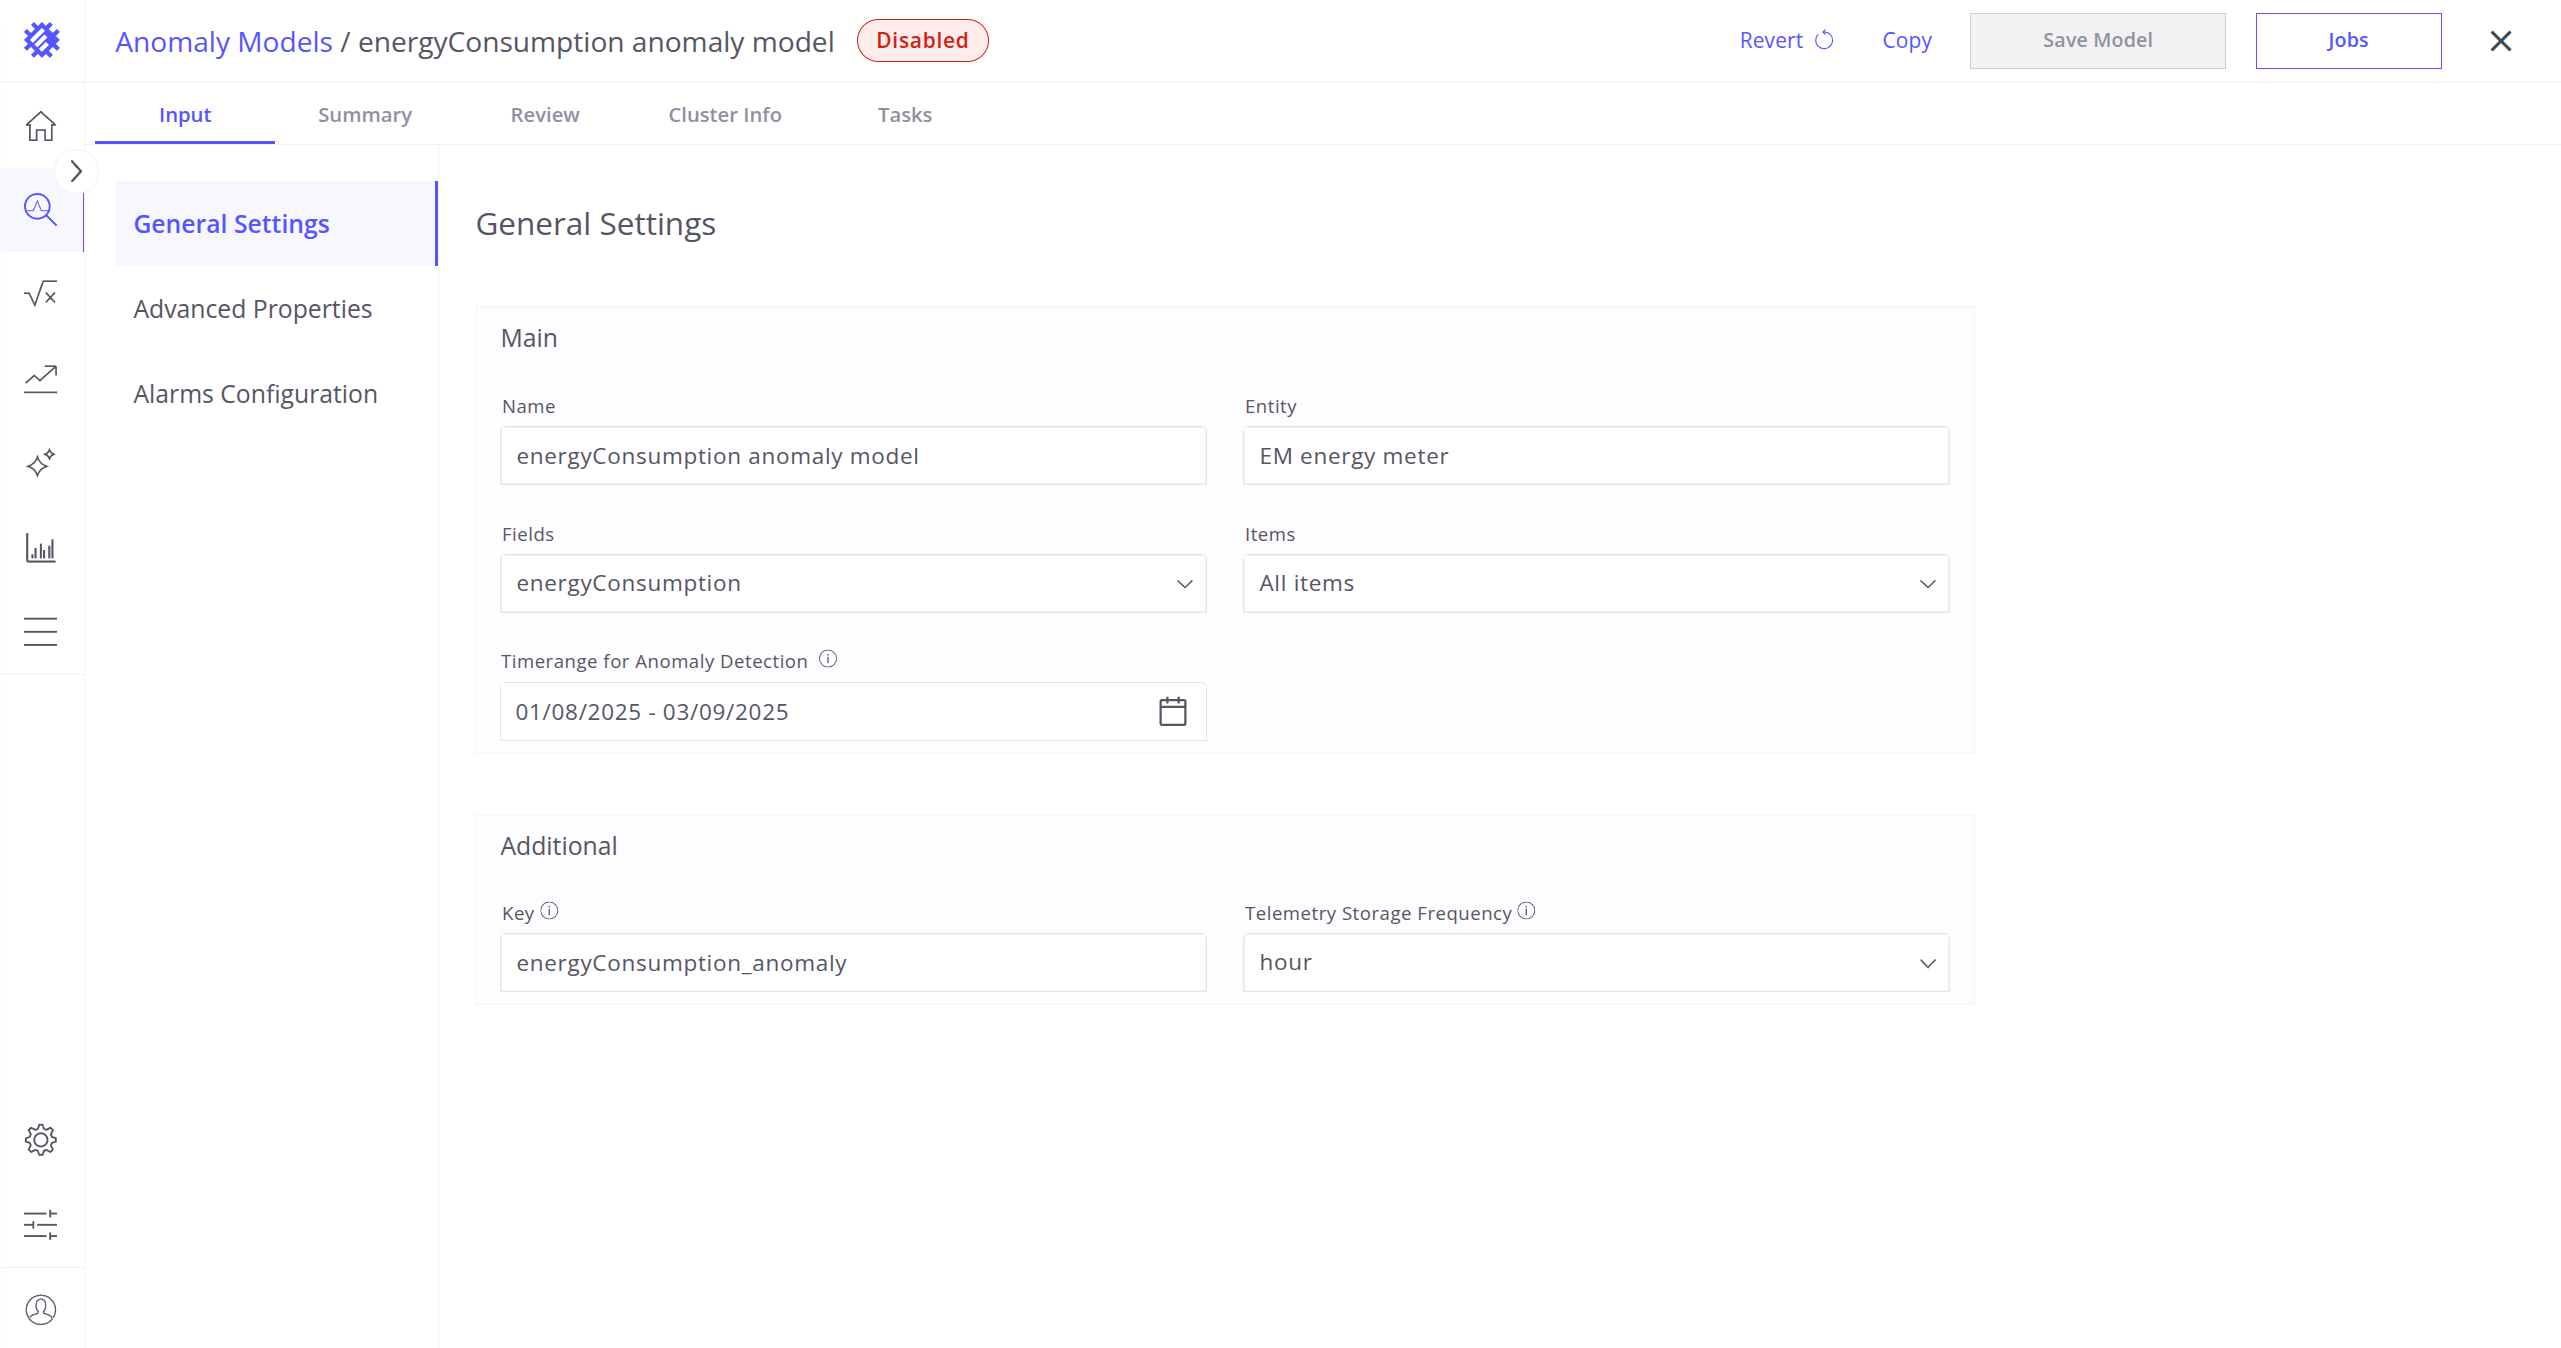
General settings are the most important in the anomaly model creation process. They determine which entities, telemetries, or devices and which time range will be used for training the anomaly model.
-
Entity: Select the entity for which the anomaly detection will be performed. This determines the context of the anomaly model.
-
Fields: Choose the specific field within the entity that you want to analyze. For example, this could be energy consumption, temperature, or another measurable parameter.
Note: Currently, it’s only possible to choose numeric telemetry here.
We recommend choosing only the necessary fields that are potentially related to each other. For example:
vibrations could be related to motor temperature or load. -
Items: (for Model Training)
Select the specific items (e.g., particular devices or assets) within the entity to focus your analysis.
We recommend choosing the most normal data to improve anomaly detection (you can identify this by building a model on all assets first). -
Timerange for Anomaly Detection: (for Model Training)
Define the historical data period that the model will use for training. For example, you can set a time range of the past 3 months or 1 year, depending on the availability and relevance of data.
Additionally, it’s possible to specify telemetry saving options here.
-
Key: Telemetry key that will be used during reprocess/refresh to save anomaly score and anomaly score index to ThingsBoard.
-
Telemetry Storage Frequency: This parameter specifies the aggregation level at which the anomaly score and anomaly score index will be stored in ThingsBoard.
We recommend specifying a telemetry storage frequency that is:- Less than the segment time range (for fixed segment strategy)
- Less than
segment size * sliding step % / 100(for sliding window strategy)
Find out more about refresh/reprocess here.
Find out more about saving telemetry to ThingsBoard here.
Advanced Properties
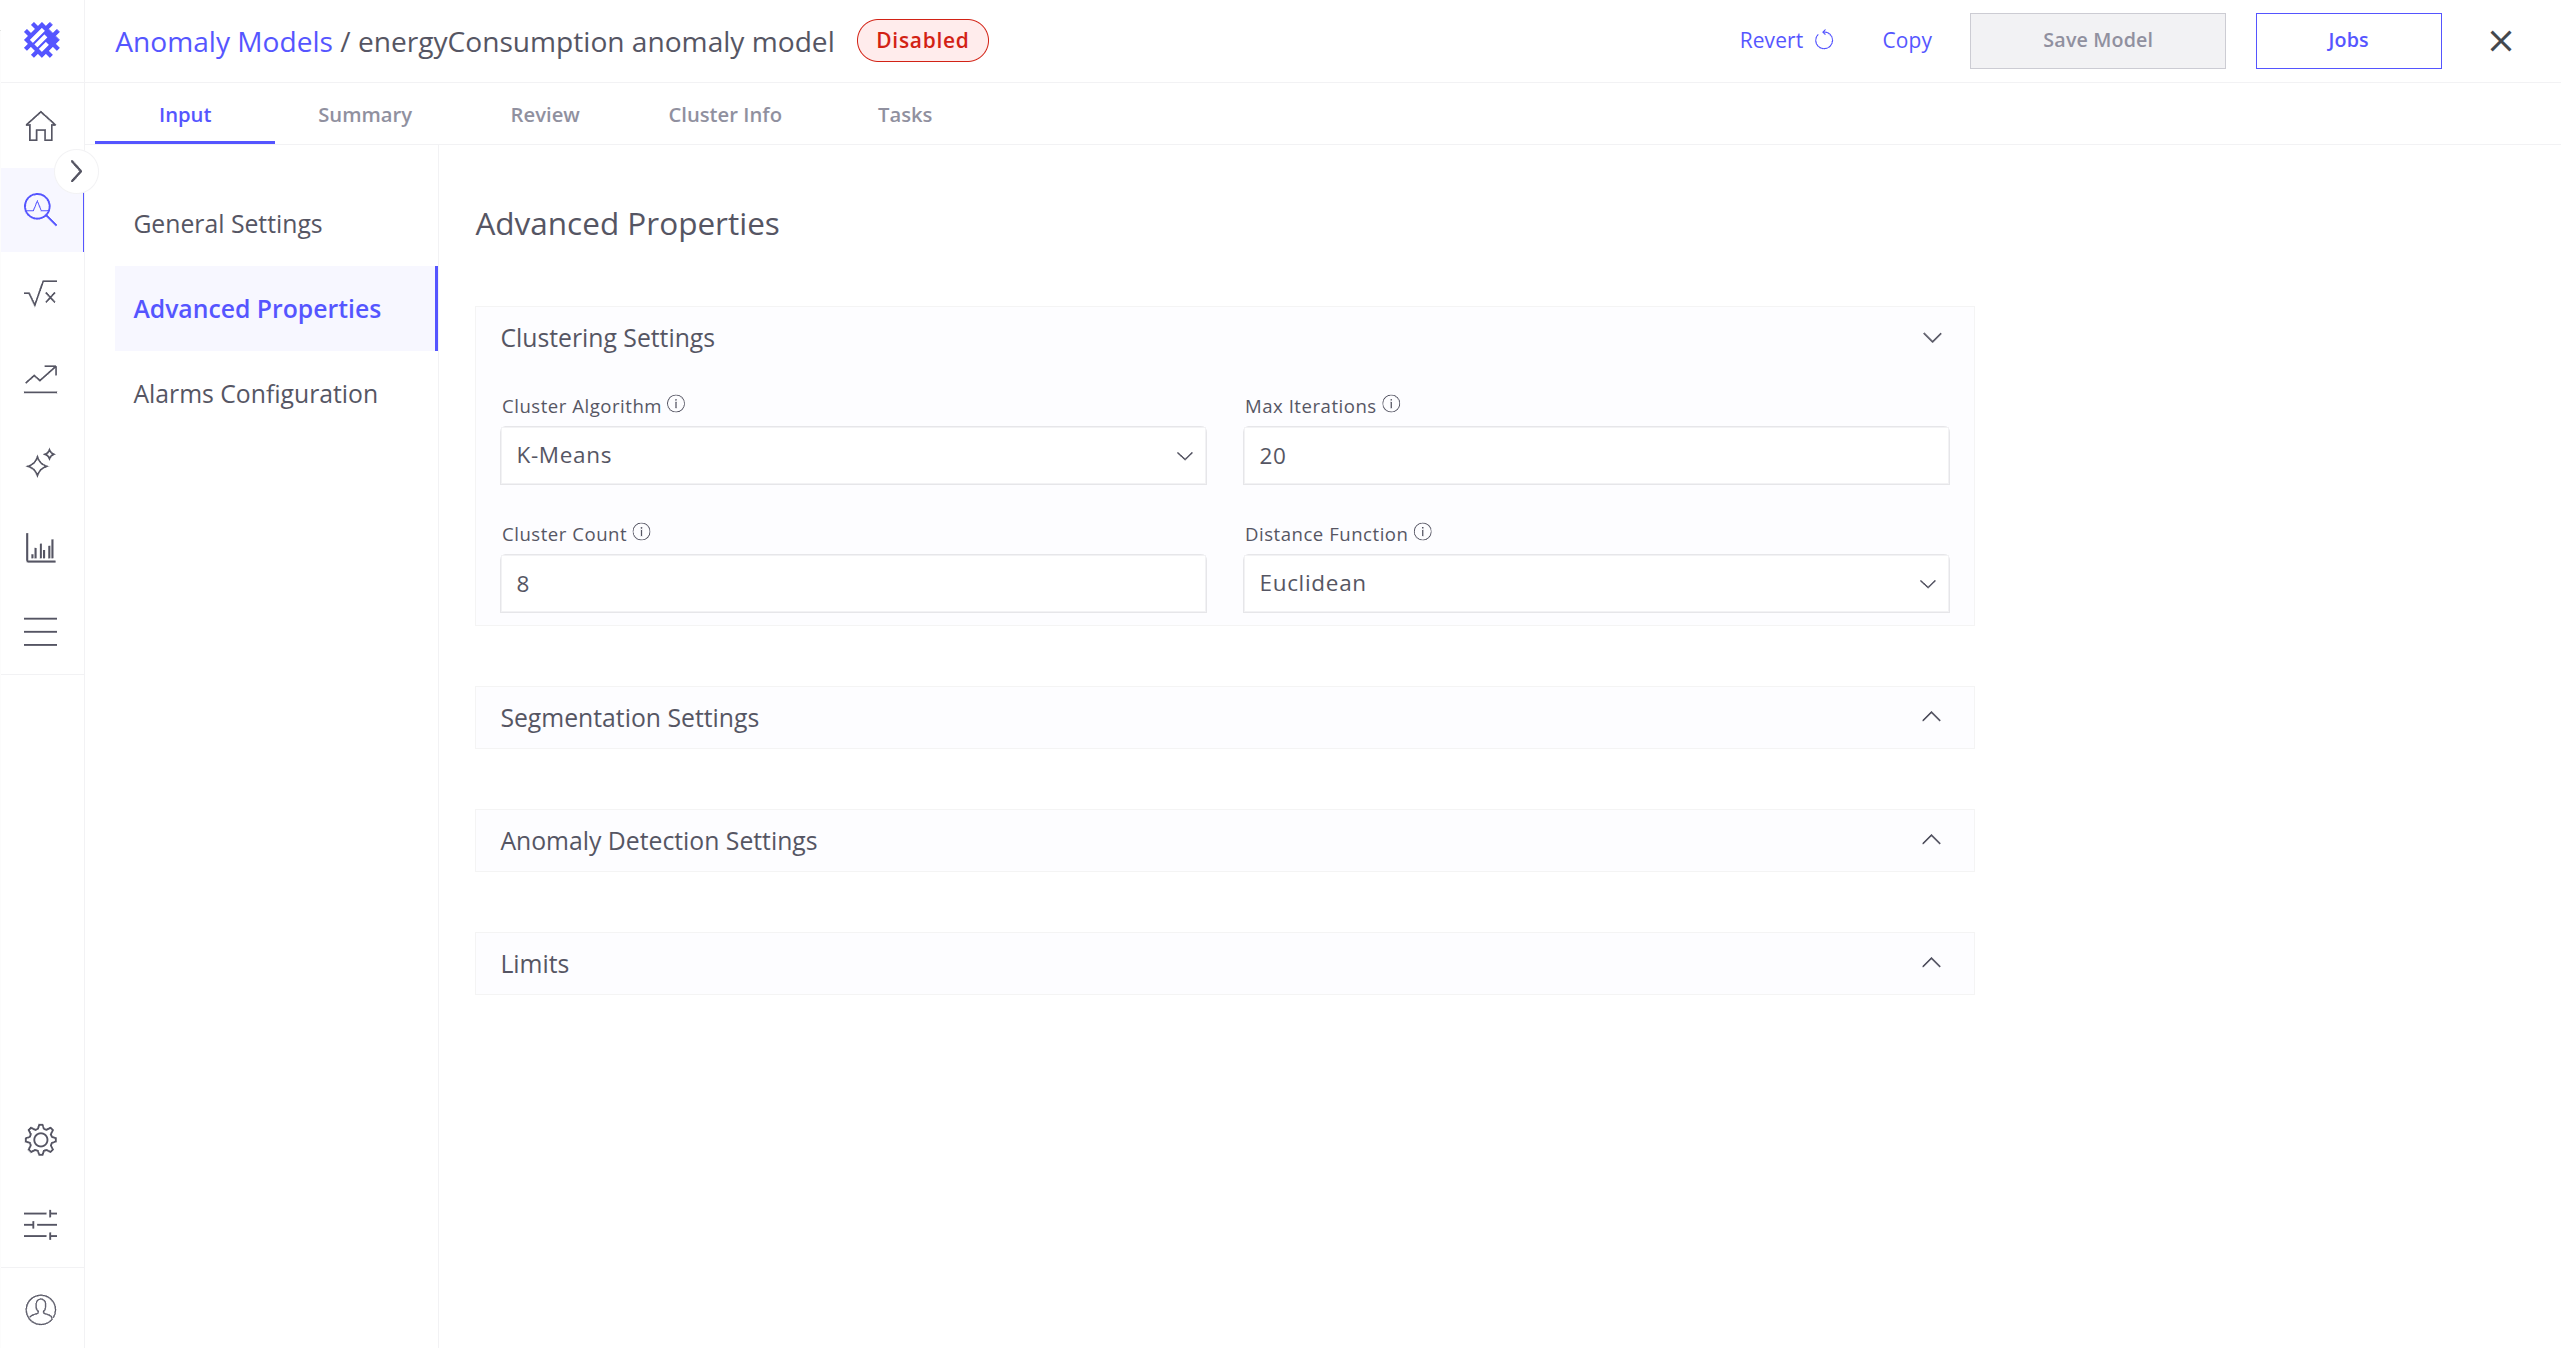
Clustering Settings
These settings define which clustering algorithm will be used to detect anomalies in your telemetry data, and how it will work.
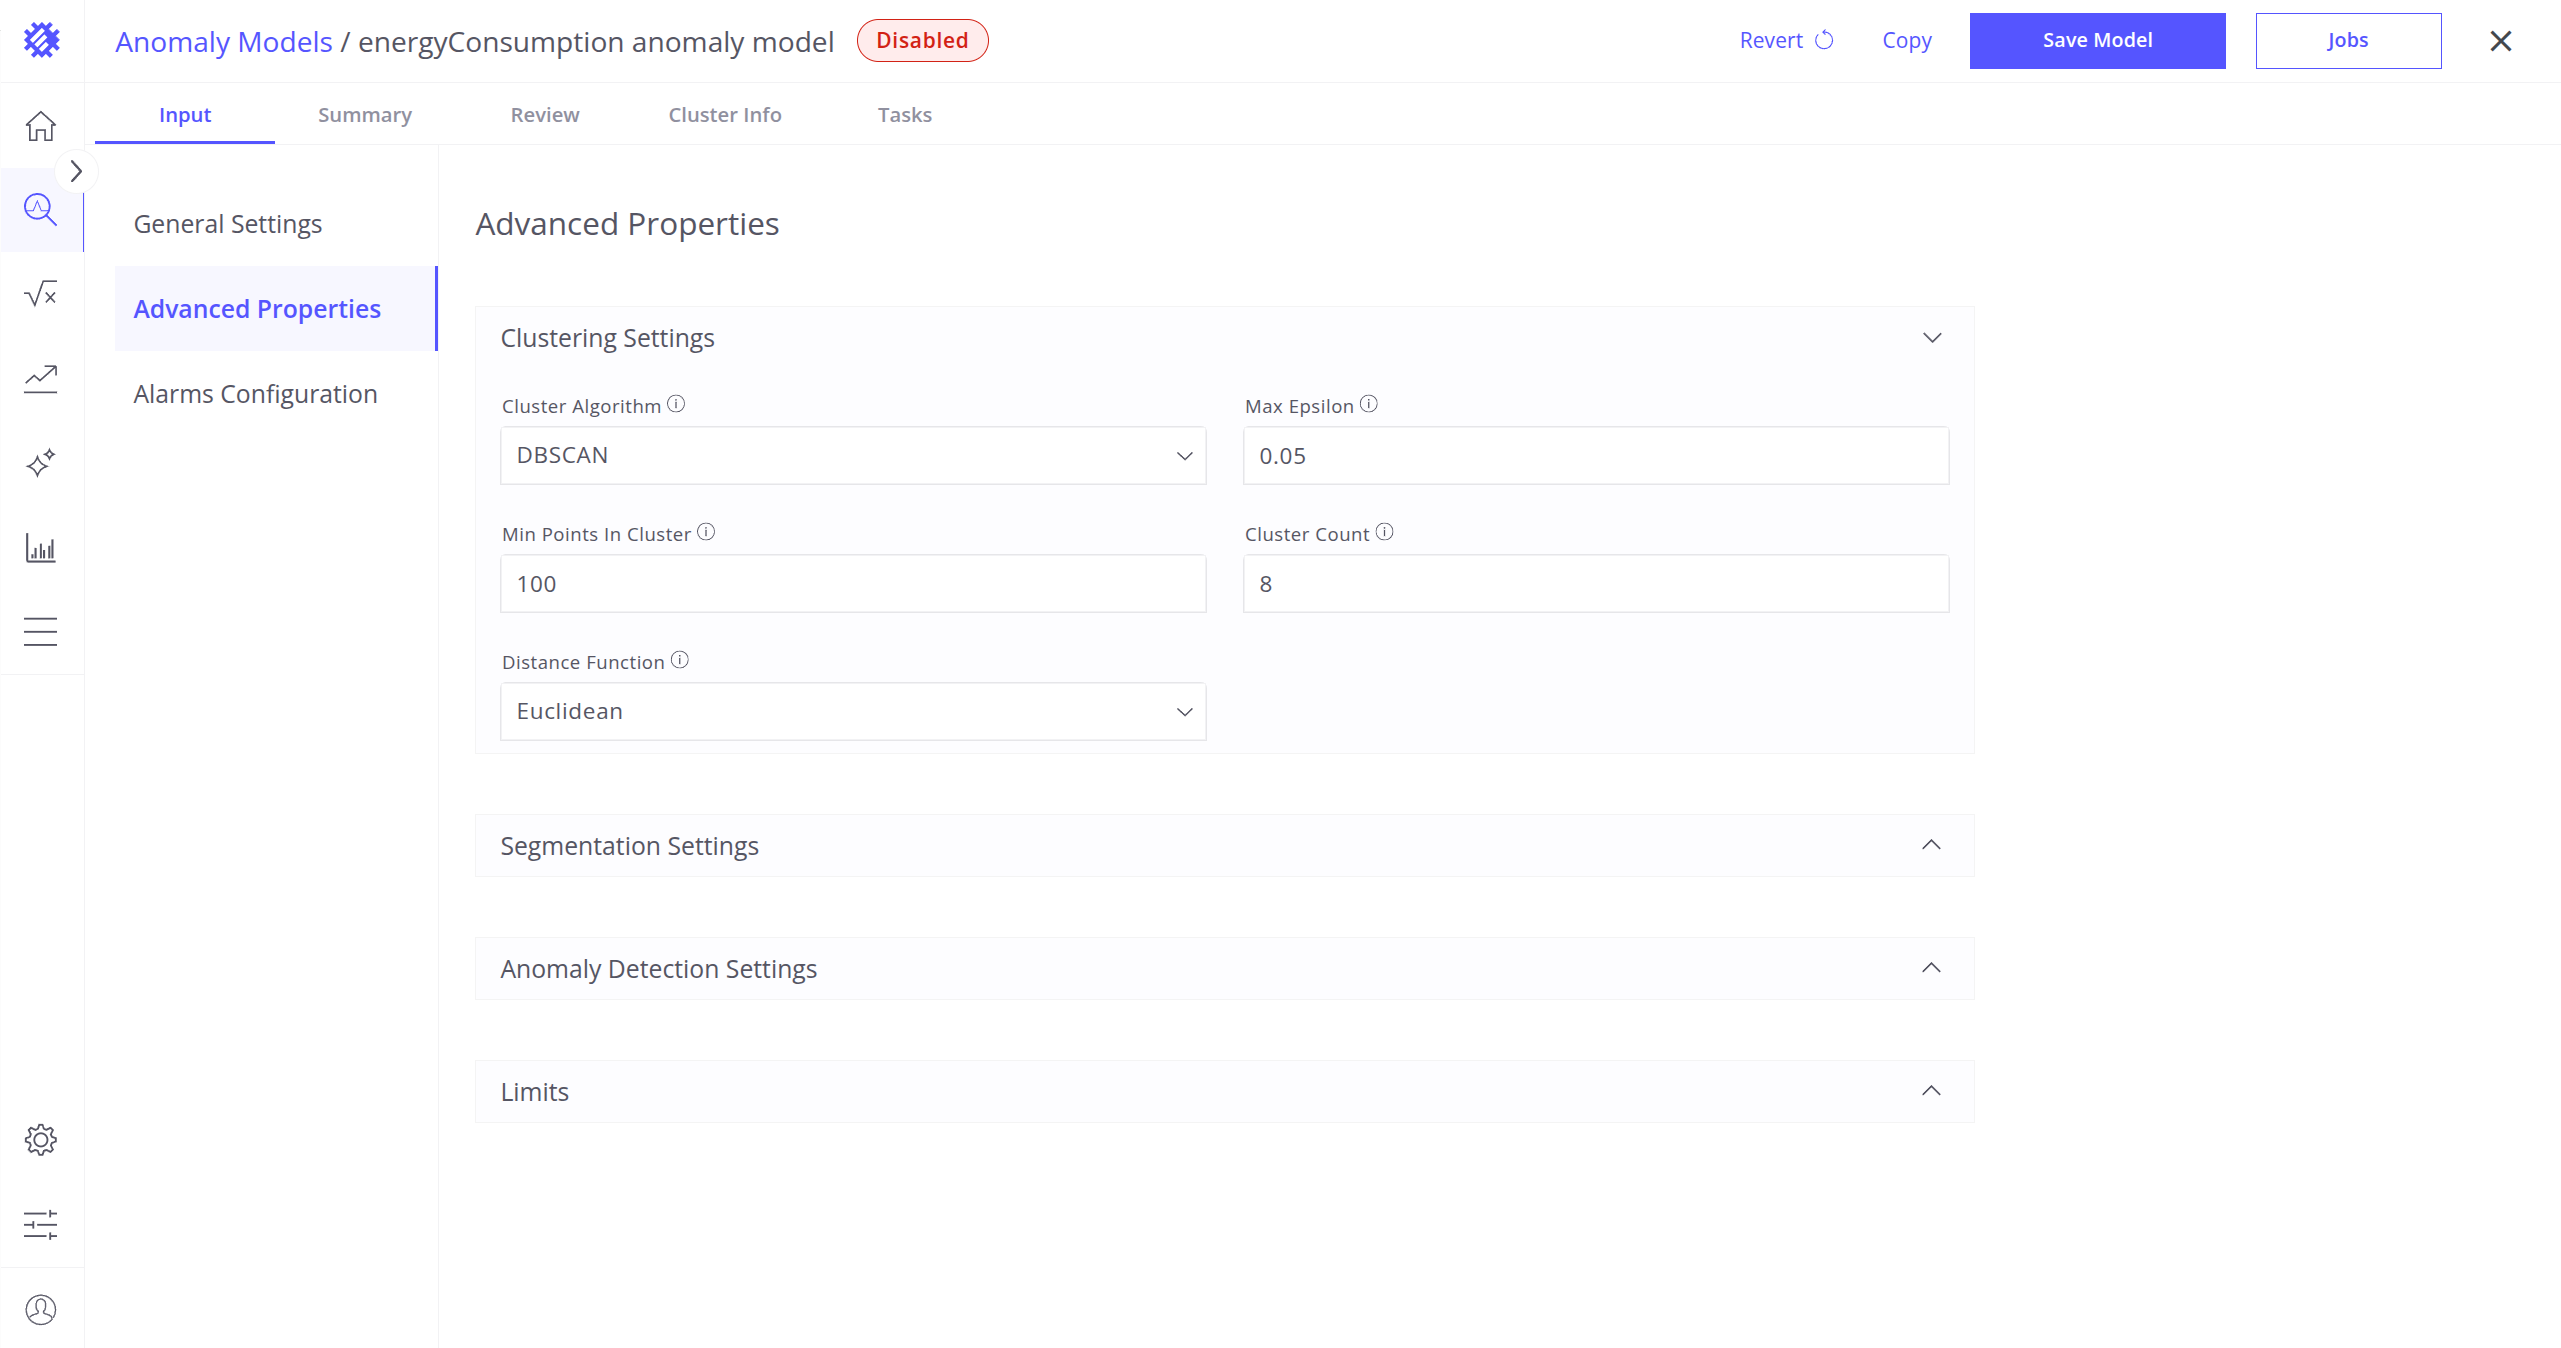
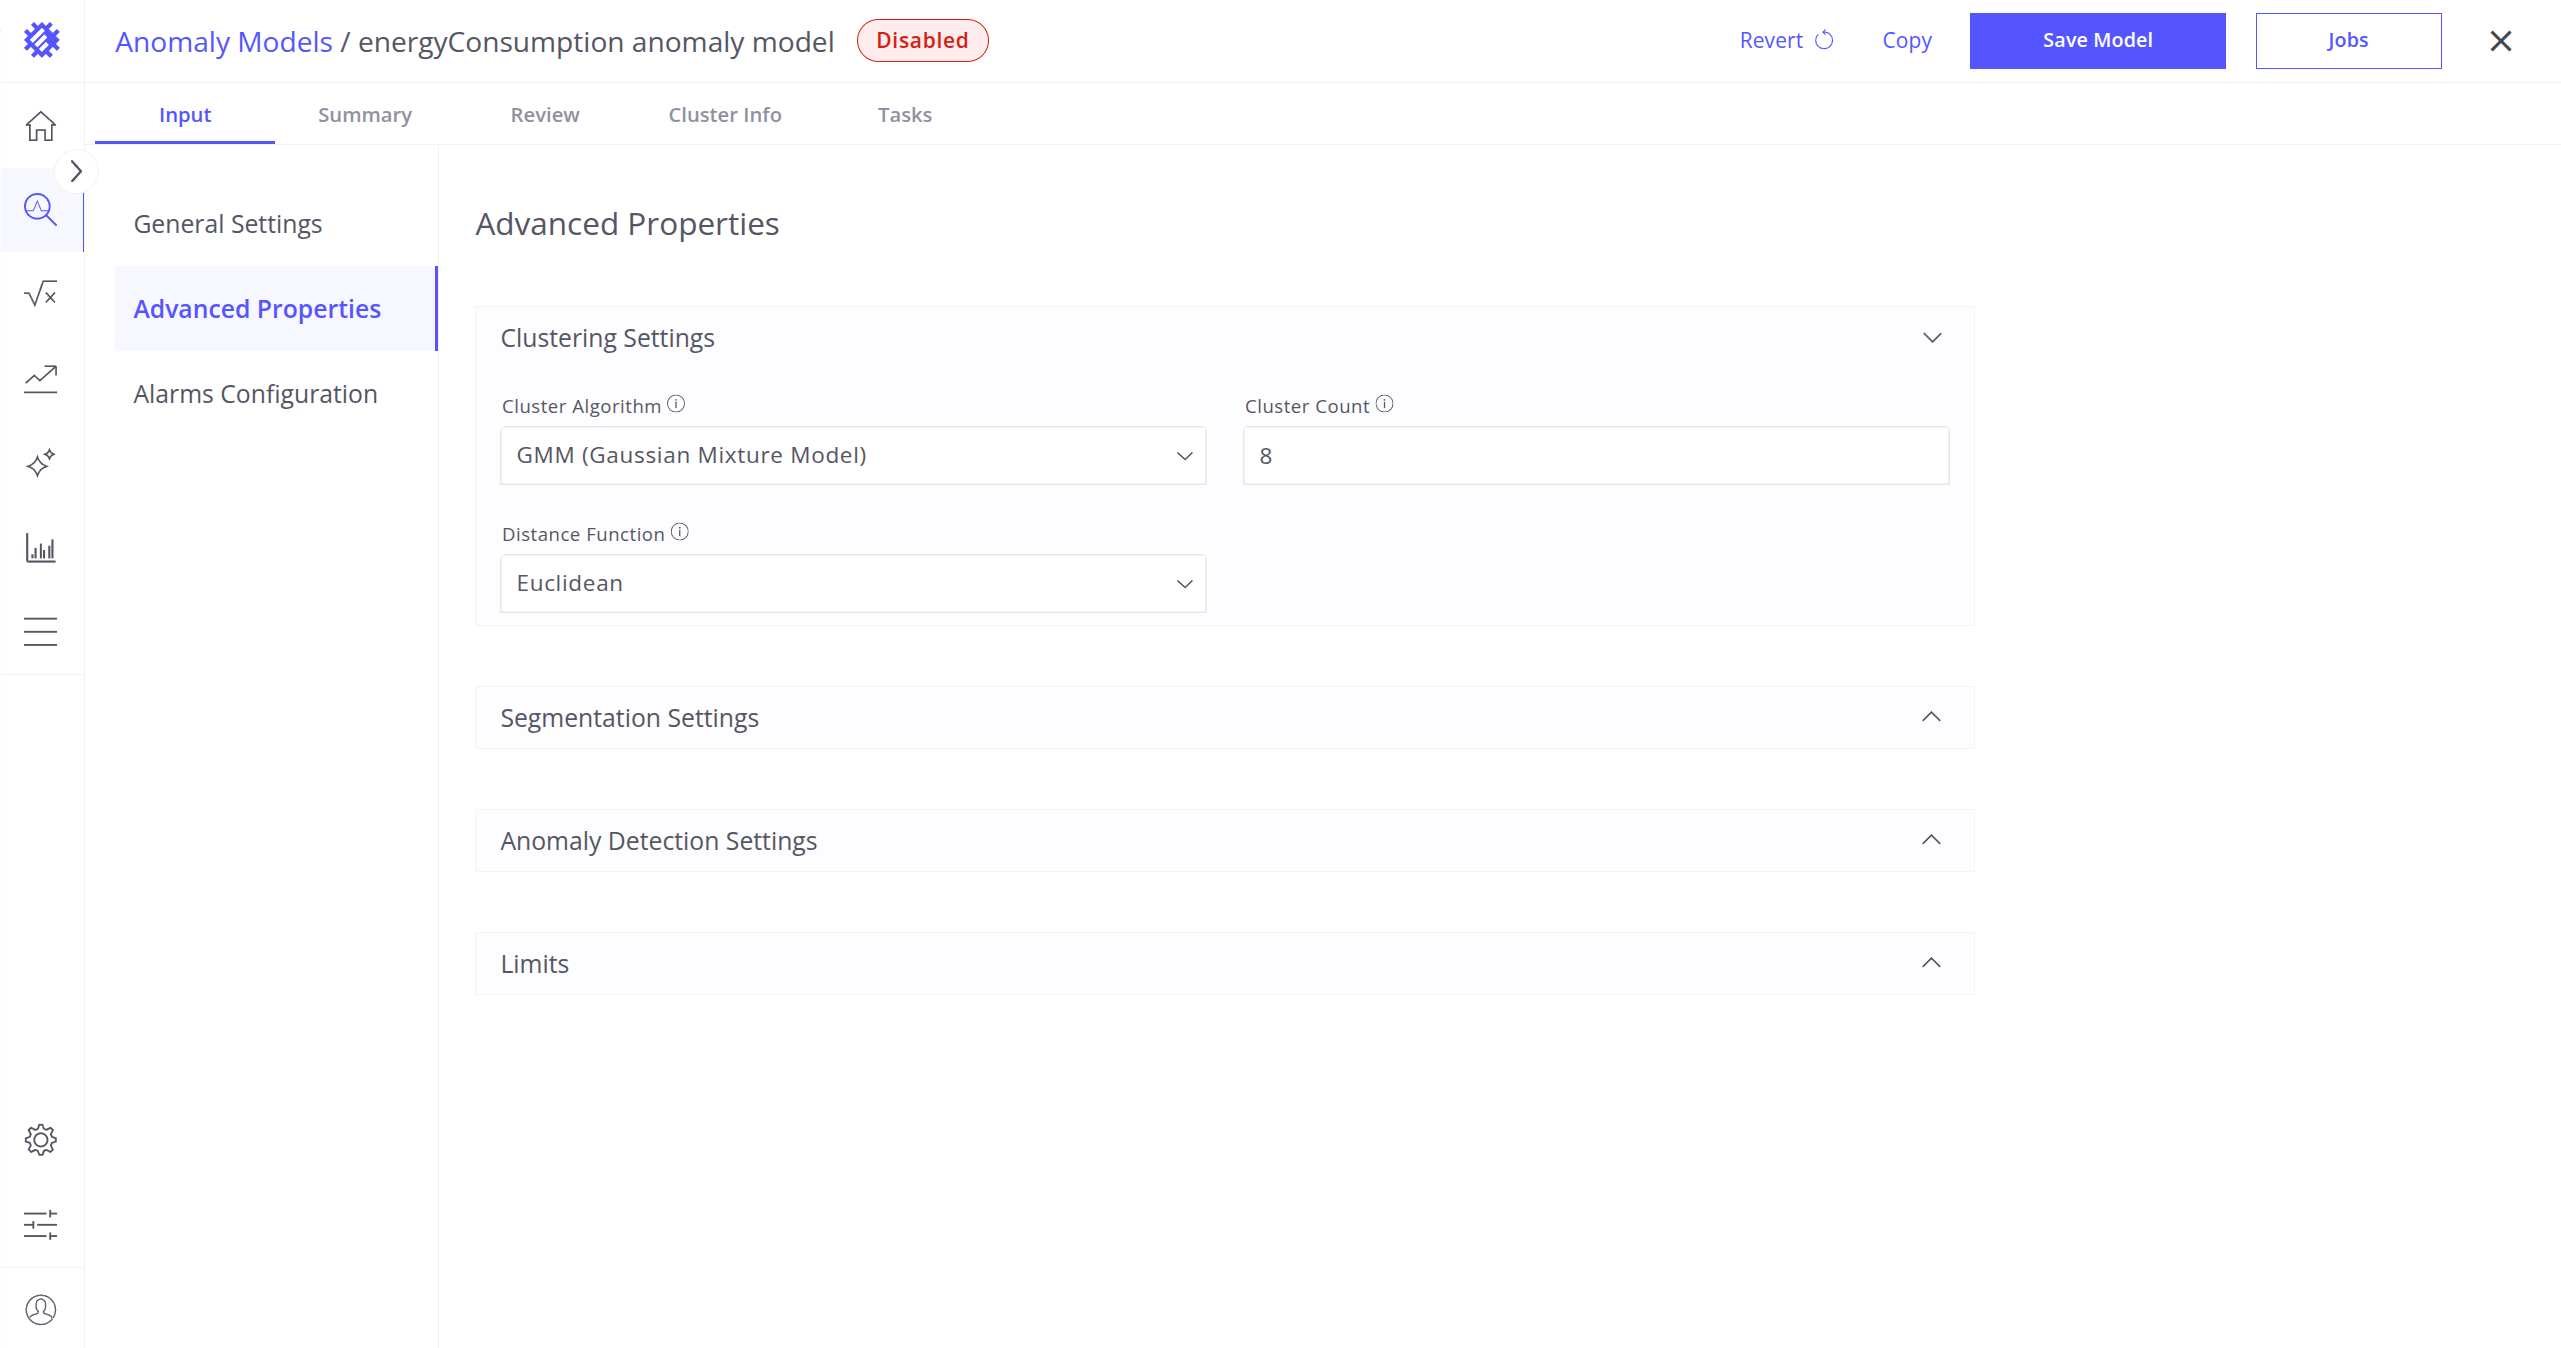
- Cluster Algorithm: Choose how the data will be grouped into clusters. Points that don’t fit well into any group will be considered anomalies.
Supported methods:-
K-Means: Splits data into a fixed number of groups. Anomalies are points far from their group center.
Use when: Data is clean, consistent, and you know how many clusters to expect.
Learn more about K-Means.Additional parameters:
- Max Iterations: How many times K-Means should try to improve the clustering.
-
DBSCAN: Groups data based on how close and dense points are. Anomalies are isolated or low-density points.
Use when: You have noisy data or clusters of different shapes/sizes.
Learn more about DBSCAN.Additional parameters:
- Max Epsilon: Maximum distance between points to consider them as part of the same group.
- Min Points in Cluster: Minimum number of nearby points to form a valid cluster.
-
GMM (Gaussian Mixture Model): Models data as a mix of several normal distributions. Anomalies are points with low probability.
Use when: You need flexible clustering and probabilistic results. Learn more about GMM.
-
-
Cluster Count: Number of clusters to create.
- Distance Function: How to measure similarity between telemetry time series.
- Dynamic Time Warping (DTW): Good for time series with similar shapes but different timing.
- Euclidean: Straight-line distance, simple and fast.
- Chebyshev: Focuses on the largest single difference.
- Manhattan: Adds up all absolute differences.
- Canberra: Highlights small values and sparsity.
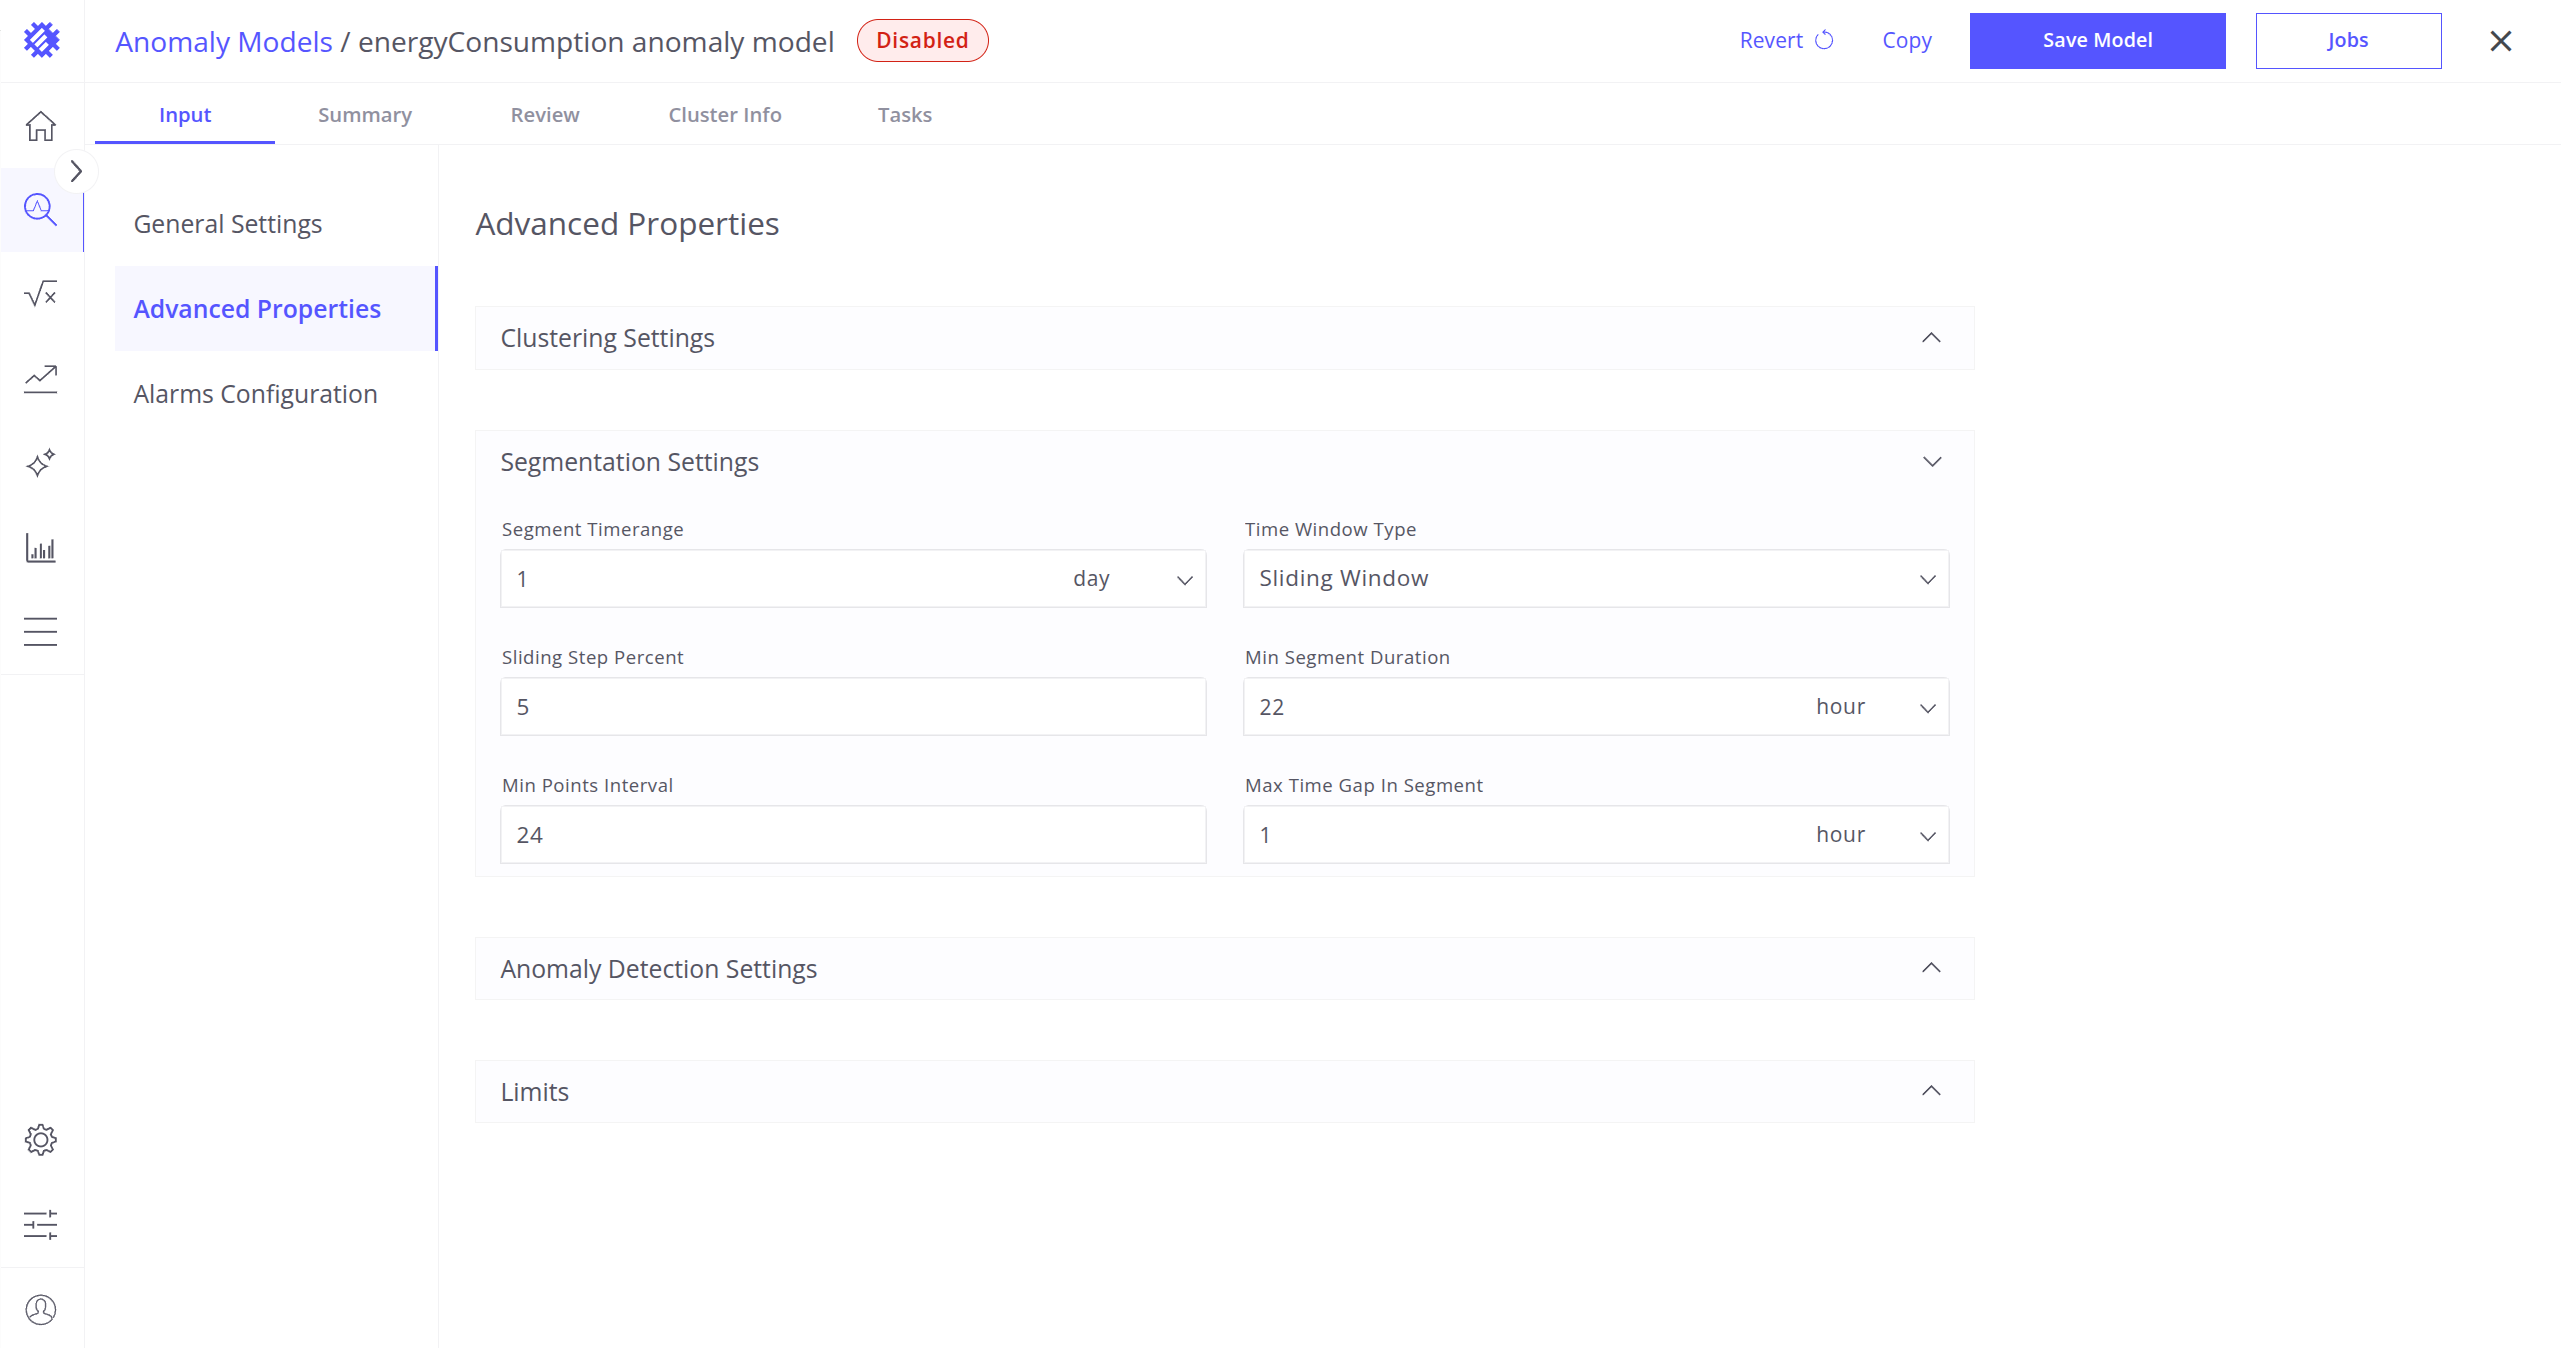
Segmentation Settings
Splitting telemetry into smaller, manageable time windows helps analyze behavior more accurately.
-
Segment Time Range: Duration of each data segment (e.g., 6 hours, 1 day).
- Time Window Type: How segments are built over time:
- Fixed Range: Non-overlapping segments.
- Sliding Window: Overlapping segments that move forward with a fixed step.
-
Sliding Step Percent: Applied only for Sliding Window time window type - fixed step for overlapping segments.
- Max Time Gap in Segment: Maximum allowed gap between data points in the same segment.
- Min Segment Duration: Minimum time span for a segment to be considered valid.
- Min Points in Segment: Minimum number of data points required for a valid segment.
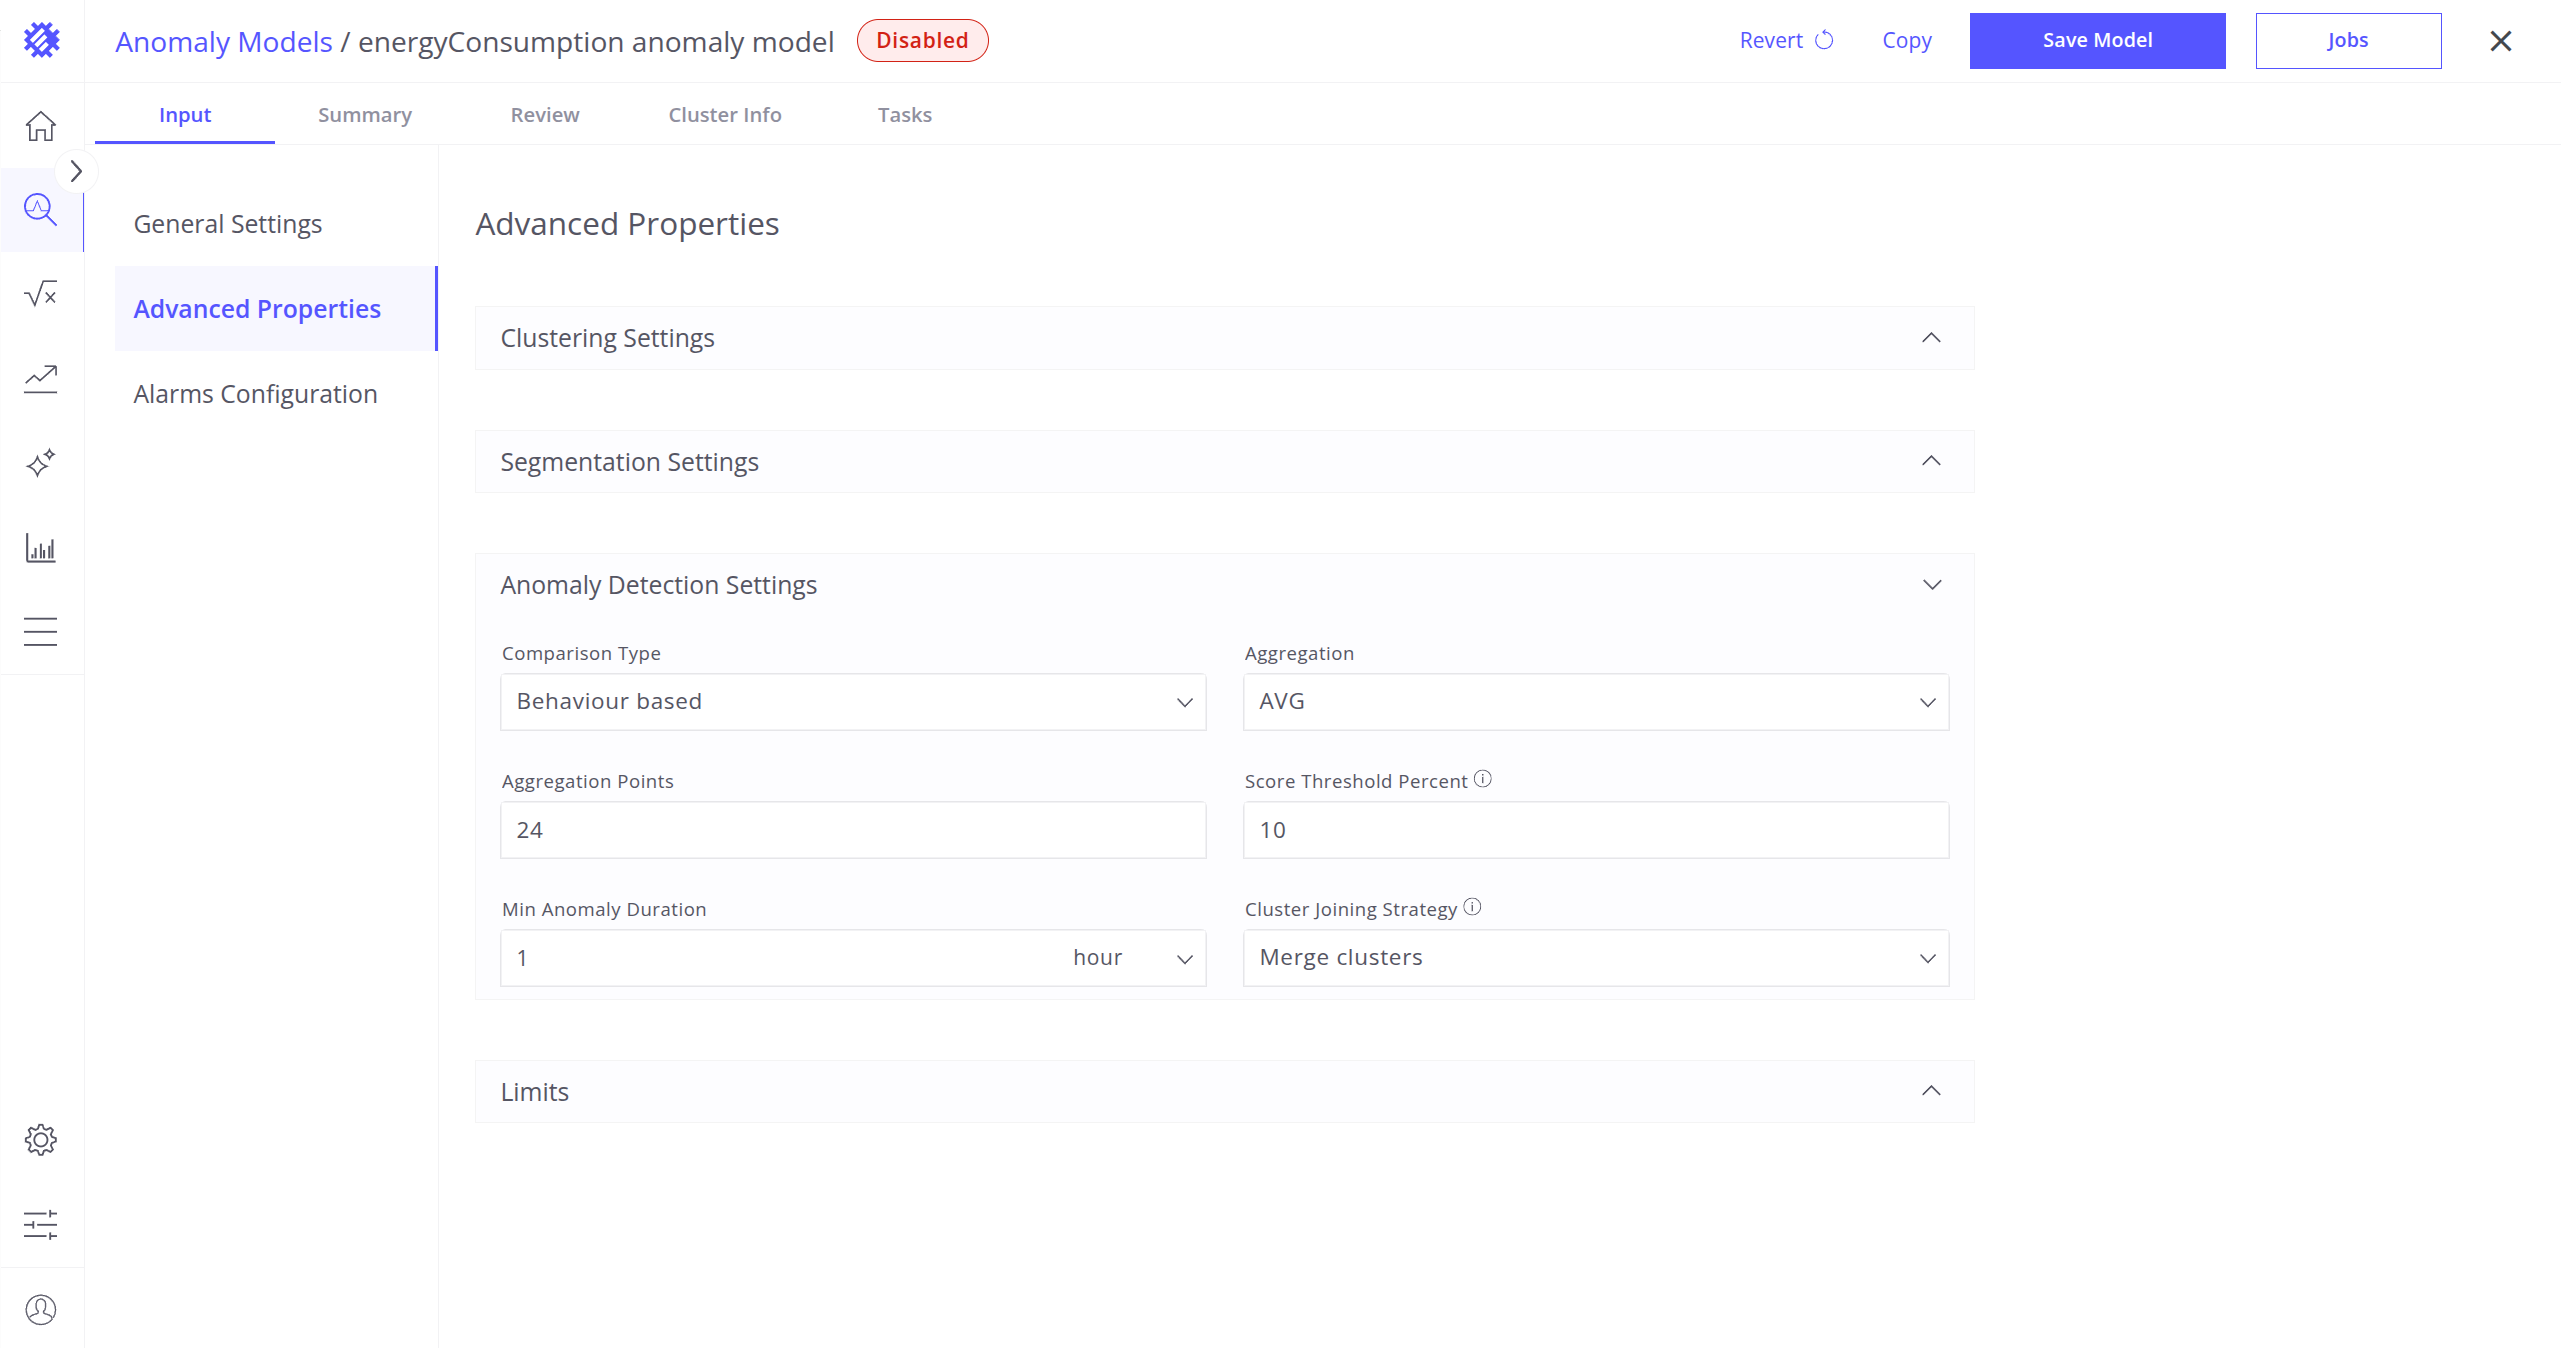
Anomaly Detection Settings
After segmenting the data, extract useful features that help the model understand behavior and check each segment for anomalies:
- Comparison Type: Defines how segments will be compared.
-
Behavior-based: Captures overall patterns and trends in the data.
Additional parameters:
- Aggregation: Function used to summarize data within a segment (AVG, MIN, MAX, SUM, COUNT).
- Aggregation Points: The number of points into which each segment will be divided before aggregation.
-
Feature-based: Focuses on specific measurements or attributes derived from the data.
-
-
Score Threshold Percent: This is the percentile threshold used to classify whether a segment is anomalous.
Segments with anomaly scores above this threshold are marked as anomalies.
Example: If set to 15%, the top 15% of segments with the highest scores will be considered anomalies. - Min Anomaly Duration: Minimum duration for an event to be considered an actual anomaly.
- Cluster Joining Strategy: This setting allows the system to treat anomalies from nearby segments even if they belong to different clusters as a single, continuous anomaly.

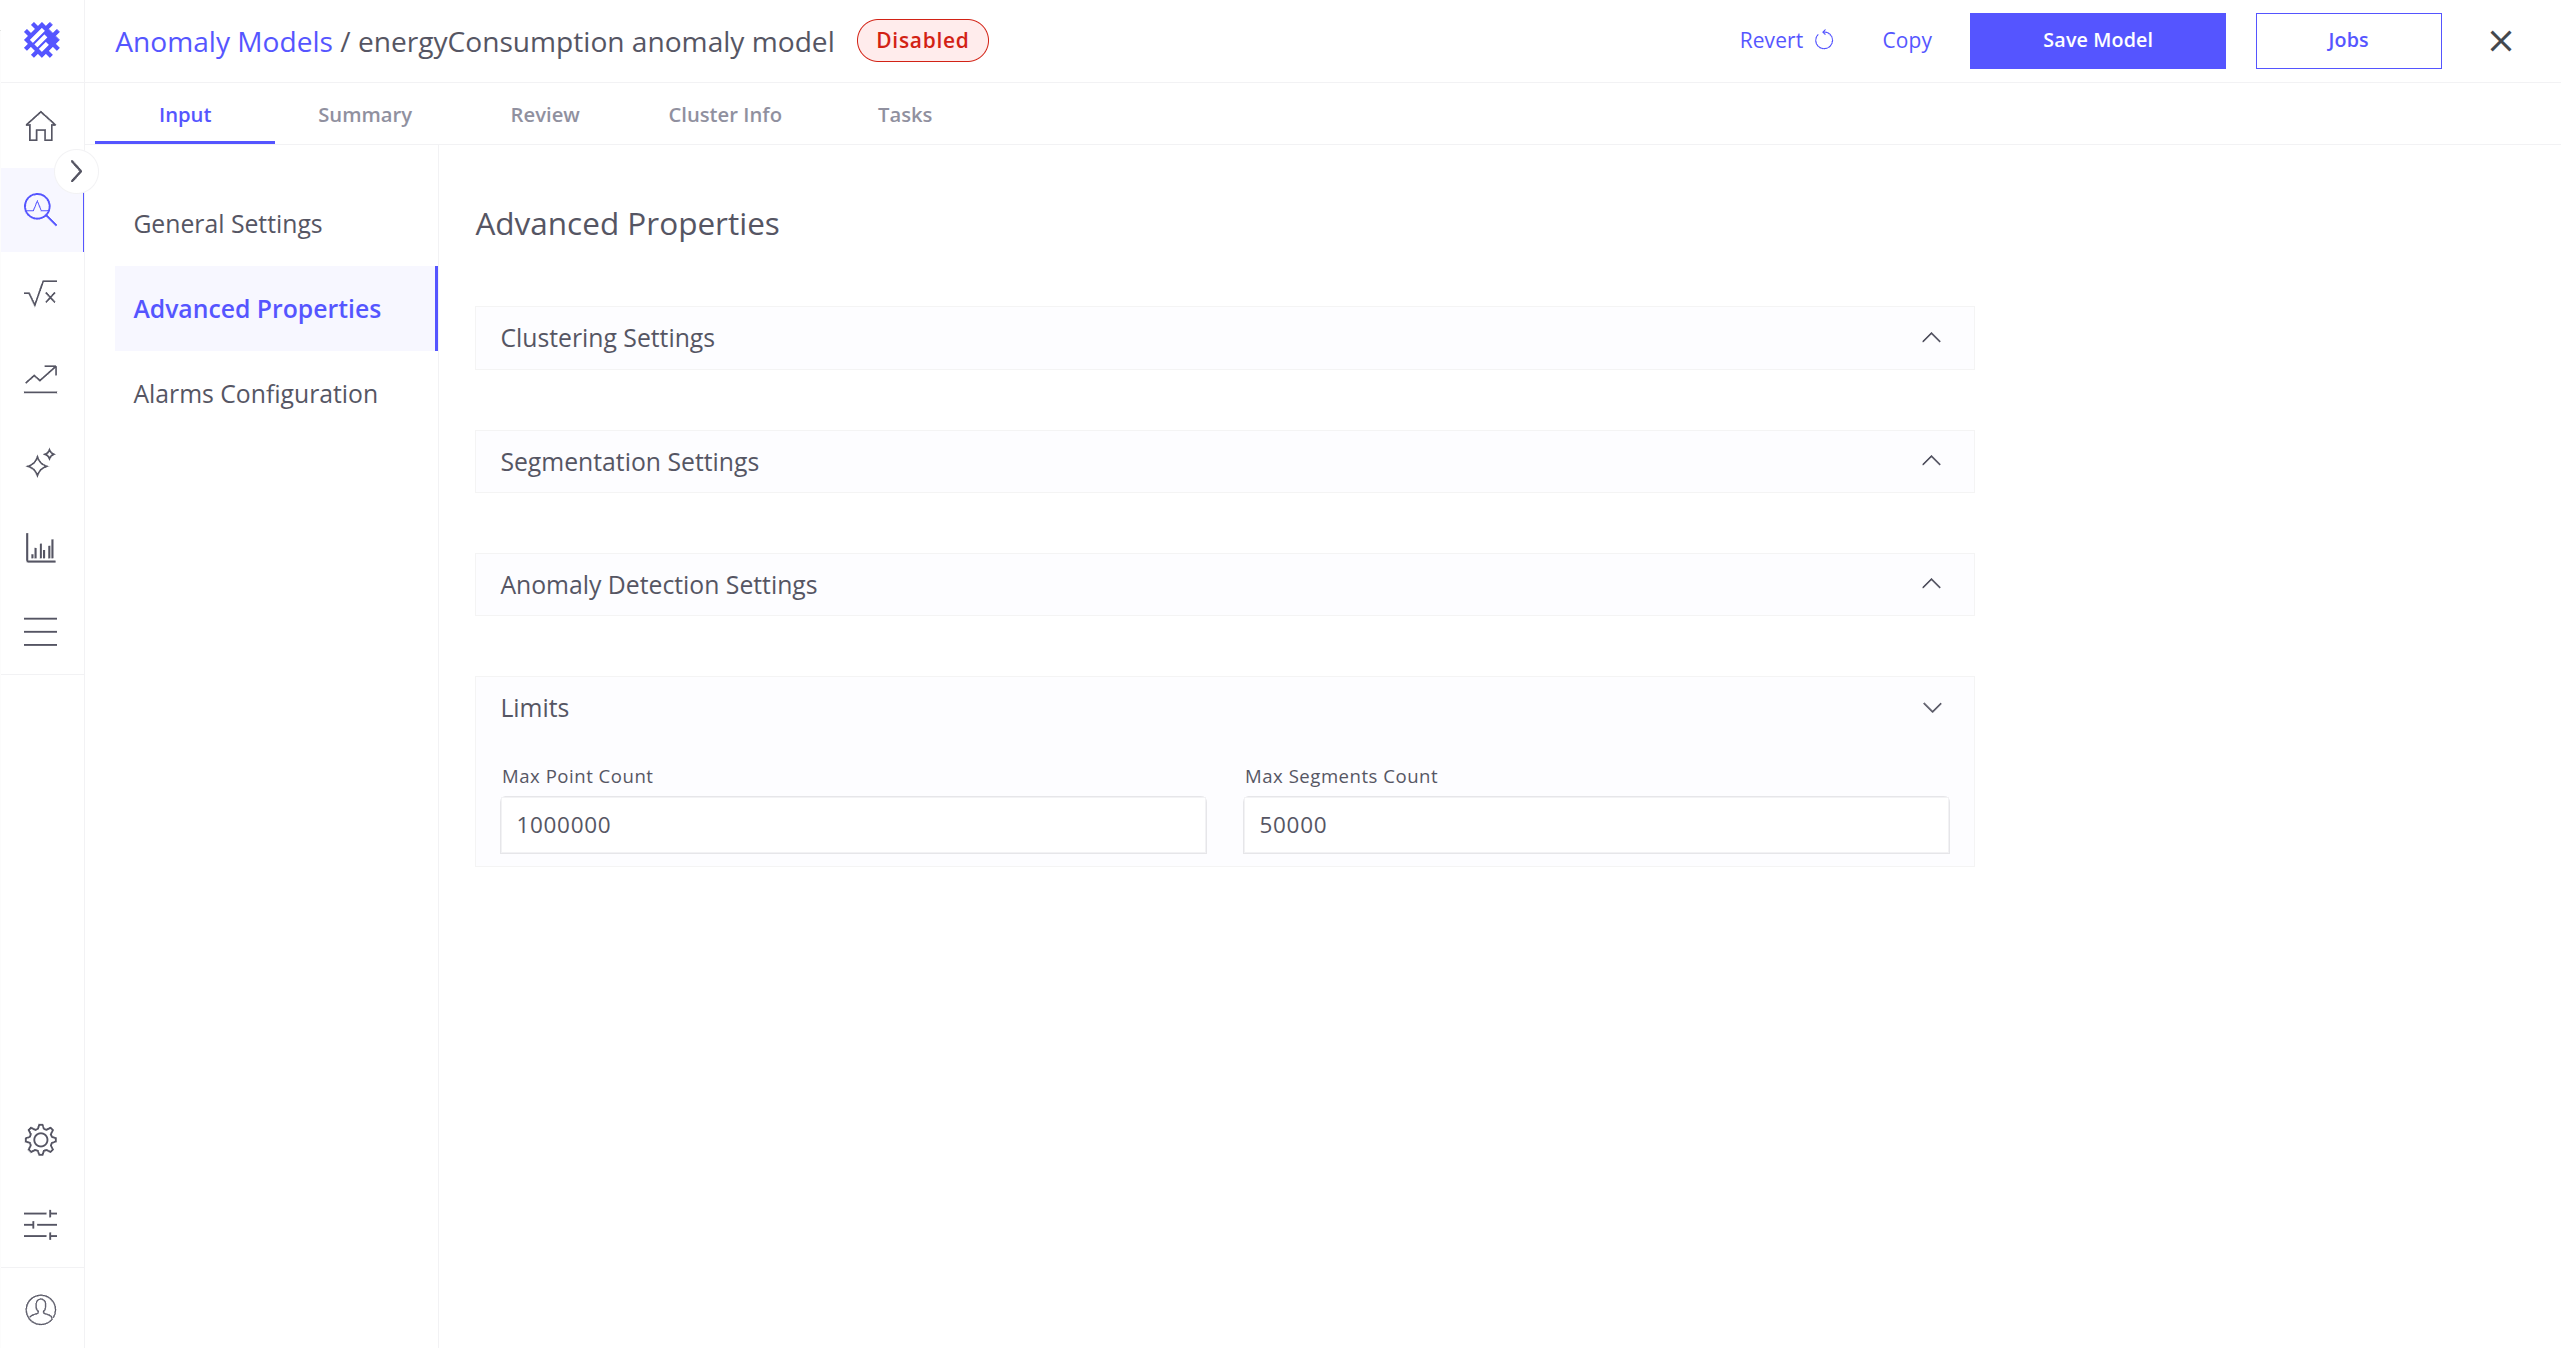
Limits
- Max Points Count: Maximum number of data points used for training and detection.
- Max Segments Count: Maximum number of segments the system will handle during processing.
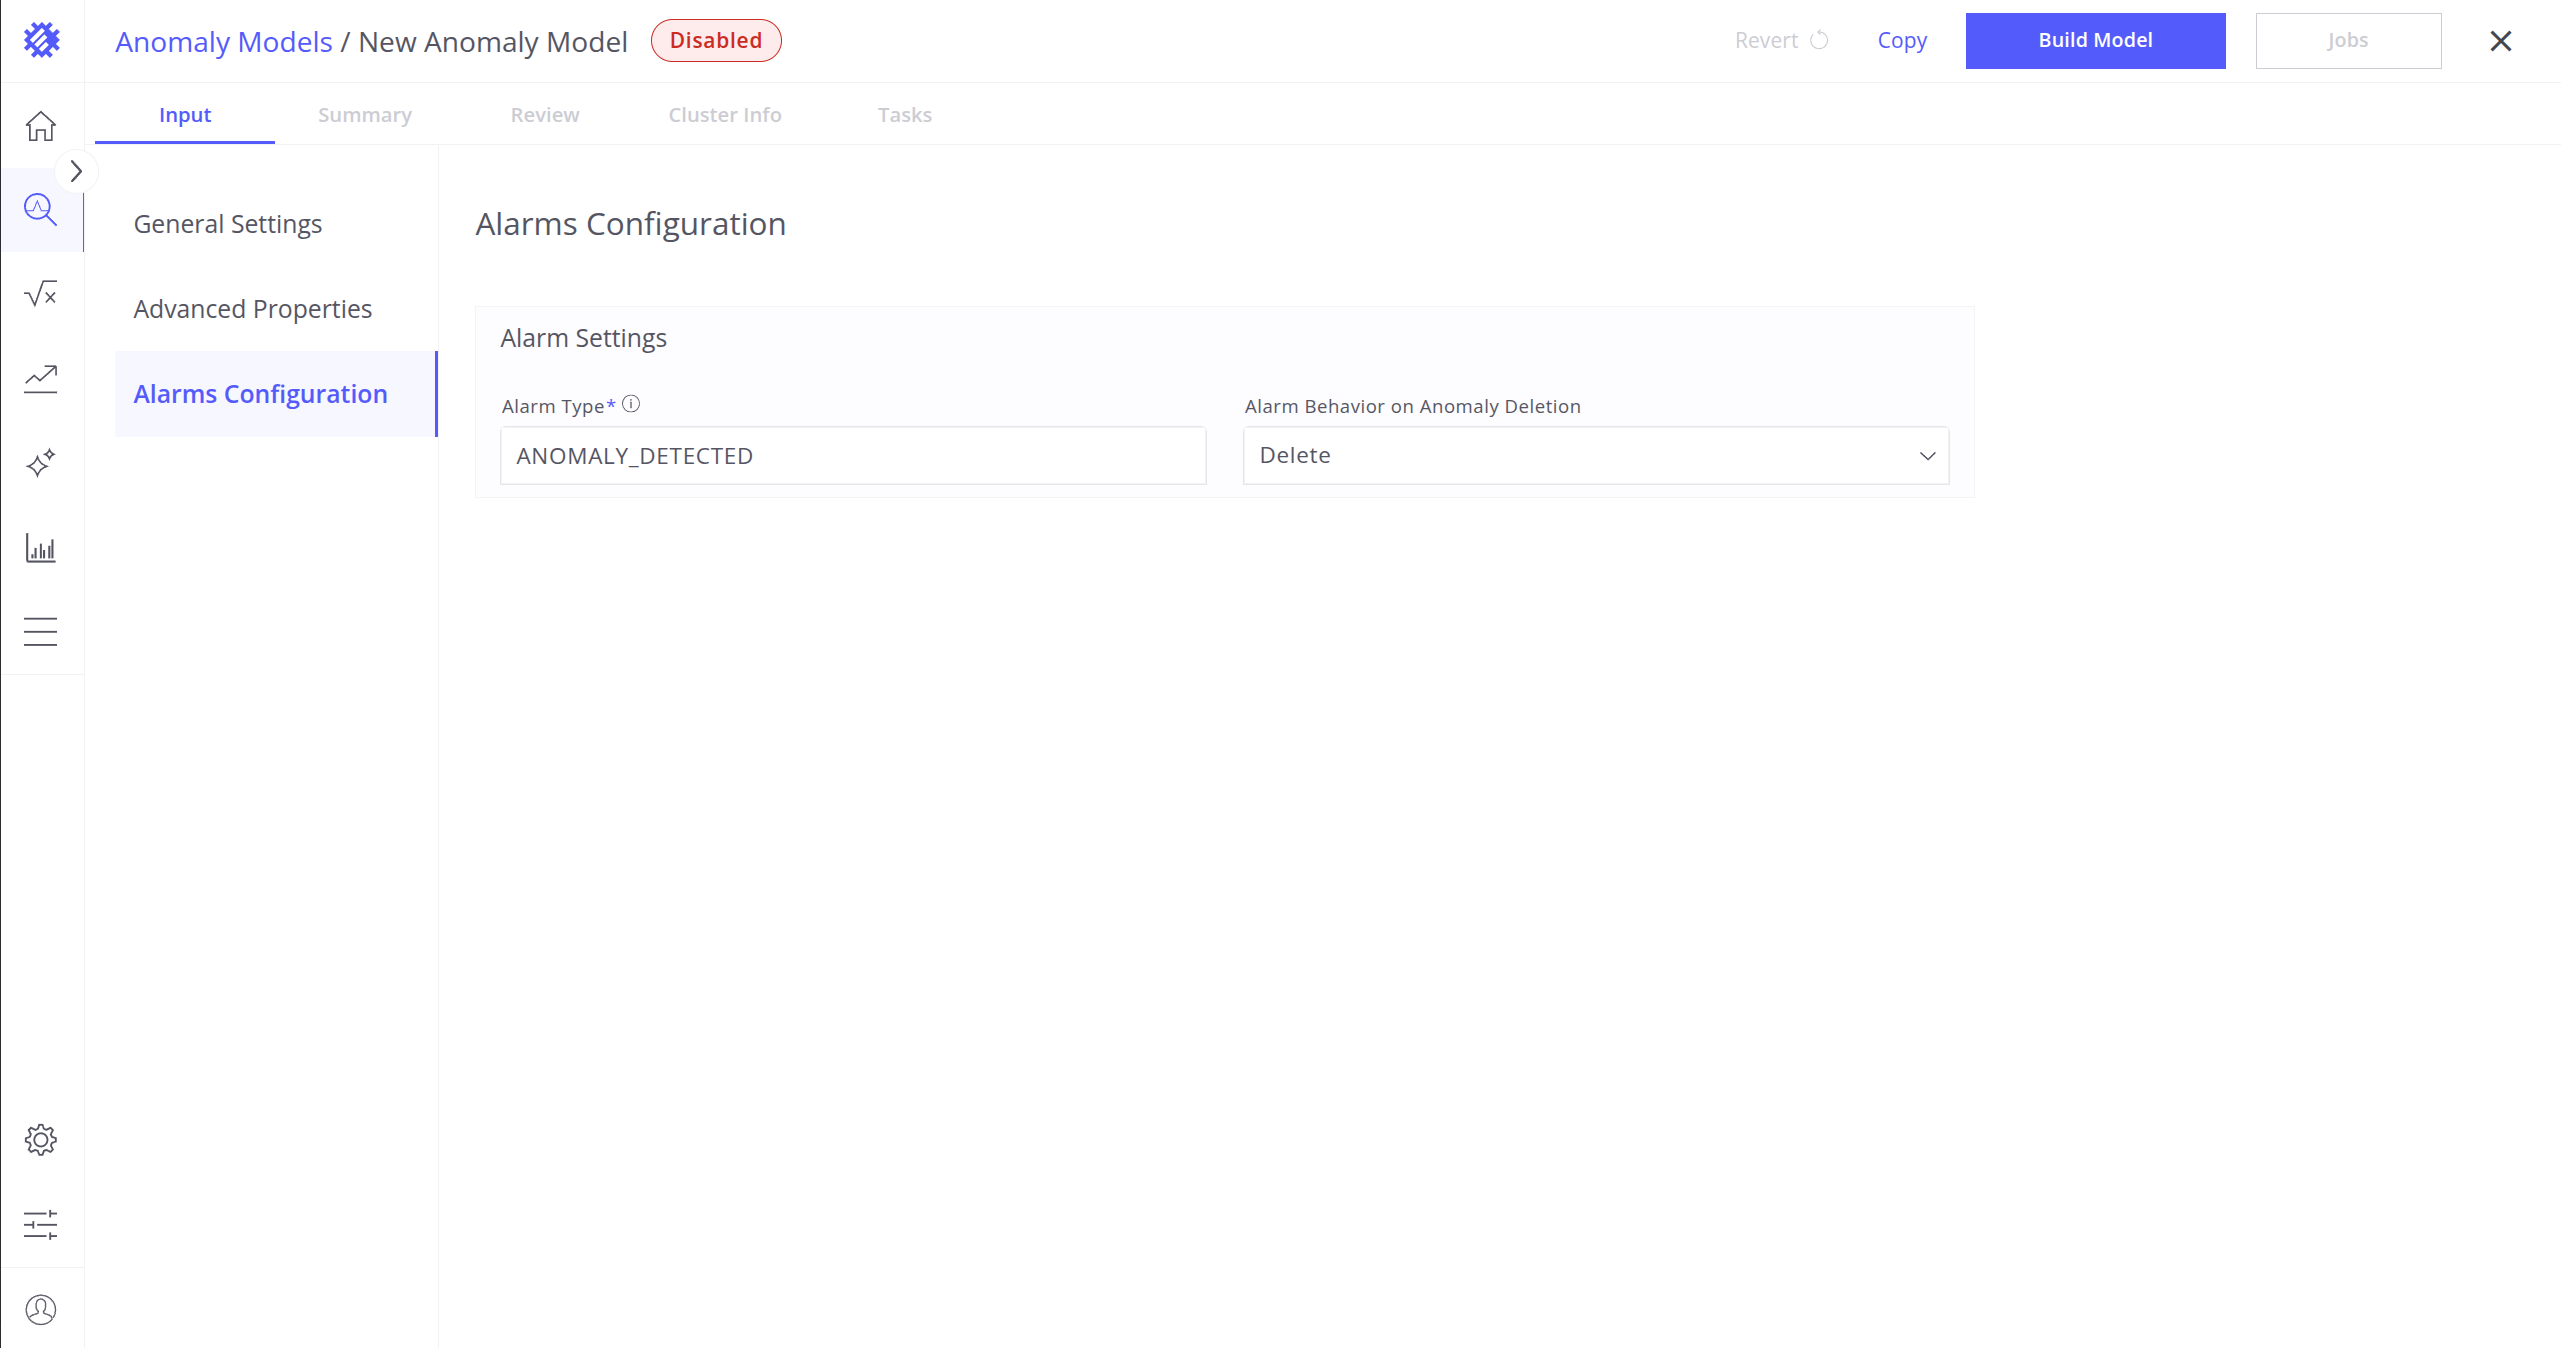
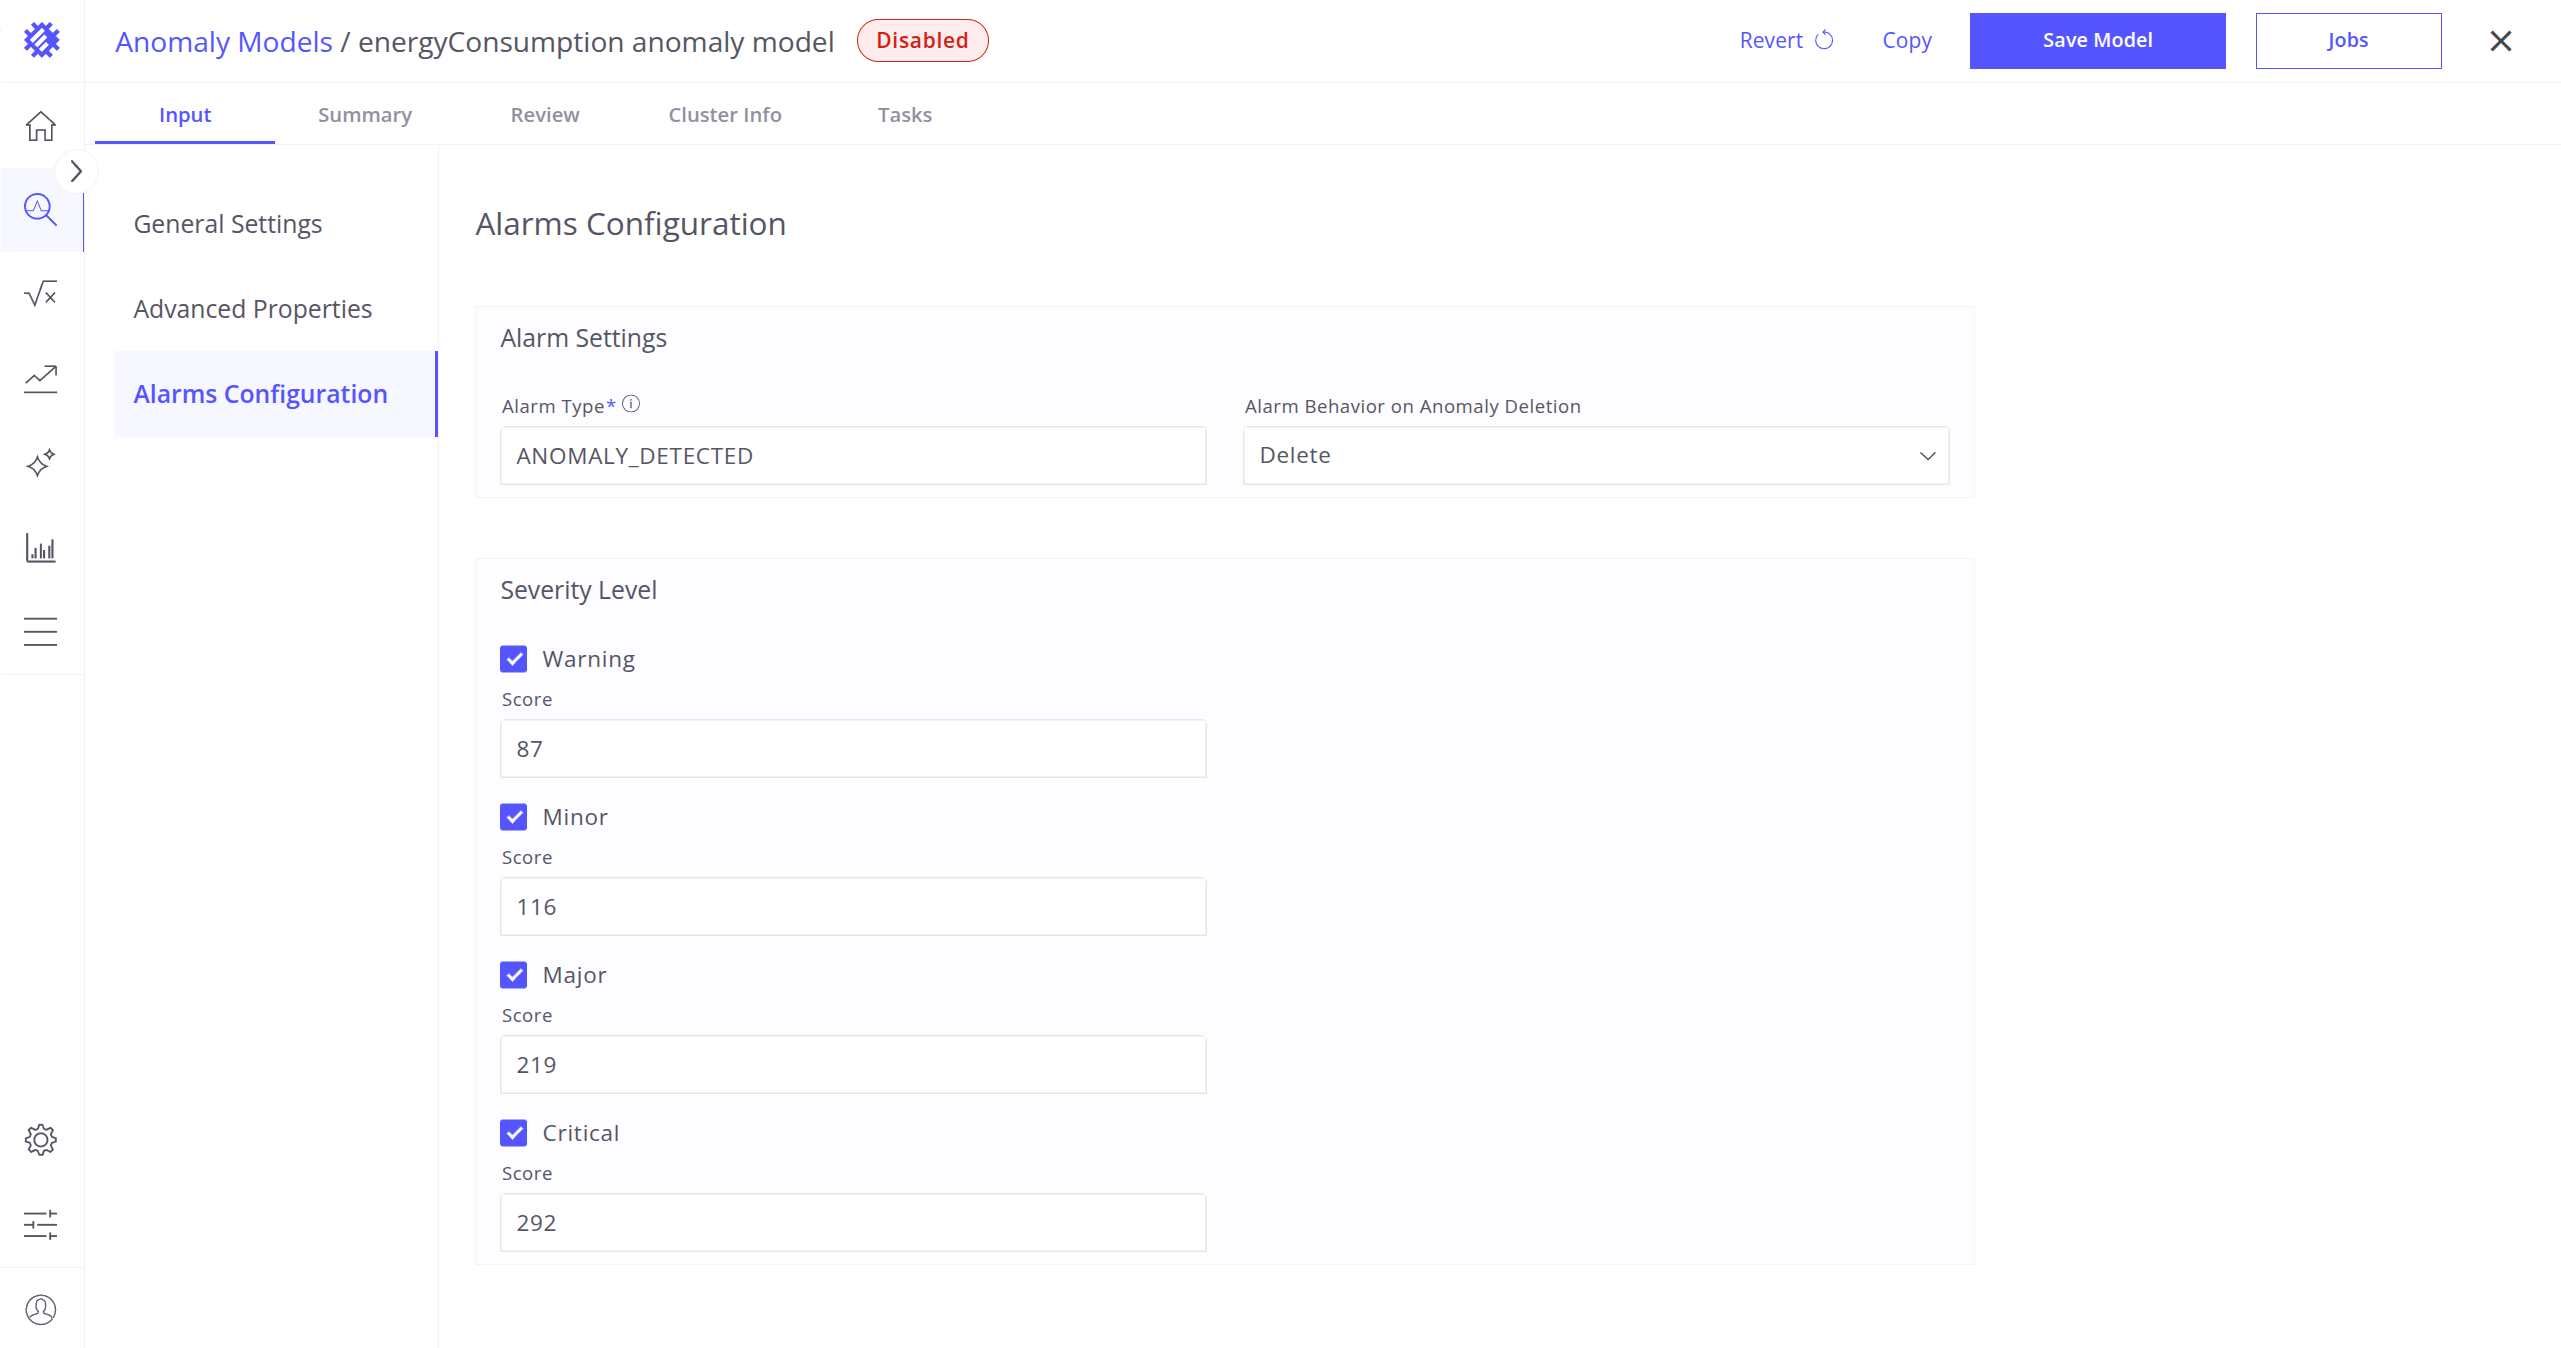
Alarm Configuration
-
Alarm Type: Configure the type/category of alarm that will be created for detected anomalies. This setting helps categorize alarms within ThingsBoard.
-
Alarm Behavior on Anomaly Detection: Defines how alarms are managed in anomaly deletion case.
-
Severities: This section becomes available after the first model build and allows you to configure threshold values for alarm severities (e.g., Critical, Major, Minor). Trendz automatically generates default thresholds based on the anomaly score distribution.
Best Practices
-
Select Relevant Data for Training:
Use the most representative and normal behavior data when training models to improve detection accuracy and reduce false positives. -
Tune Segmentation Carefully:
Choose segment duration and sliding steps that match the natural cycles or expected anomaly durations of your system. -
Configure Clustering Method to Data Characteristics:
Pick a clustering algorithm suitable for your data shape and noise level (e.g., DBSCAN for noisy data, K-Means for well-separated clusters). -
Adjust Alarm Thresholds According to Business Needs:
Set severity thresholds reflecting your operational priorities and tolerance for alerts. -
Enable Alarm Creation Only When Confident:
Activate alarms only after validating the model reliably detects real anomalies, to avoid alarm fatigue. -
Monitor Alarm Volume to Prevent Alarm Storms:
Keep an eye on the number and frequency of alarms to avoid overwhelming operators or systems. -
Test Model With Reprocess on Historical Data:
Use reprocess tasks on past data to validate model performance and refine settings before enabling refresh.
Next Steps
-
Getting started guide - These guide provide quick overview of main Trendz features.
-
Installation guides - Learn how to setup ThingsBoard on various available operating systems.
-
Metric Explorer - Learn how to explore and create new metrics with Trendz Metric Explorer.
-
Calculated Fields - Learn about Calculated fields and how to use them.
-
States - Learn how to define and analyse states for assets based on raw telemetry.
-
Prediction - Learn how to make forecasts and predict telemetry behavior.
-
Filters - Learn how filter dataset during analysis.
-
Available Visualizations - Learn about visualization widgets available in Trendz and how to configure them.
-
Share and embed Visualizations - Learn how to add Trendz visualizations on ThingsBoard dashboard or 3rd party web pages.
-
AI Assistant - Learn how to utilize Trendz AI capabilities.