- Introduction
- Prerequisites
- Step 1. Creation UpLink Data Converters.
- Step 2. Integration configuration.
- Step 3. Verifying the receipt of data from the device.
- Step 4. Creation Electricity Meter Asset.
- Step 5. Dashboard import and configuration.
- See also
- Your feedback
- Next steps
Introduction
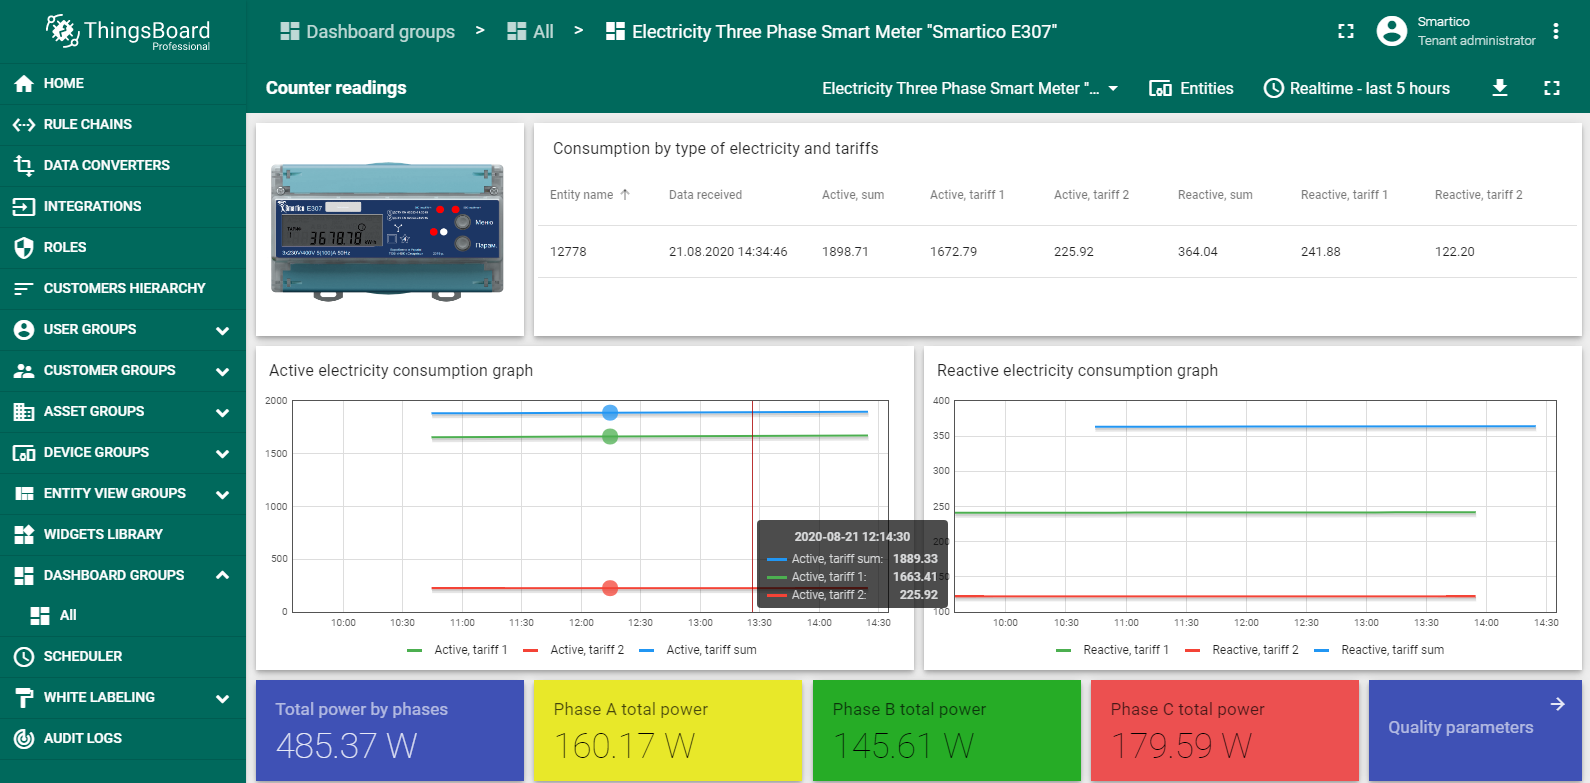
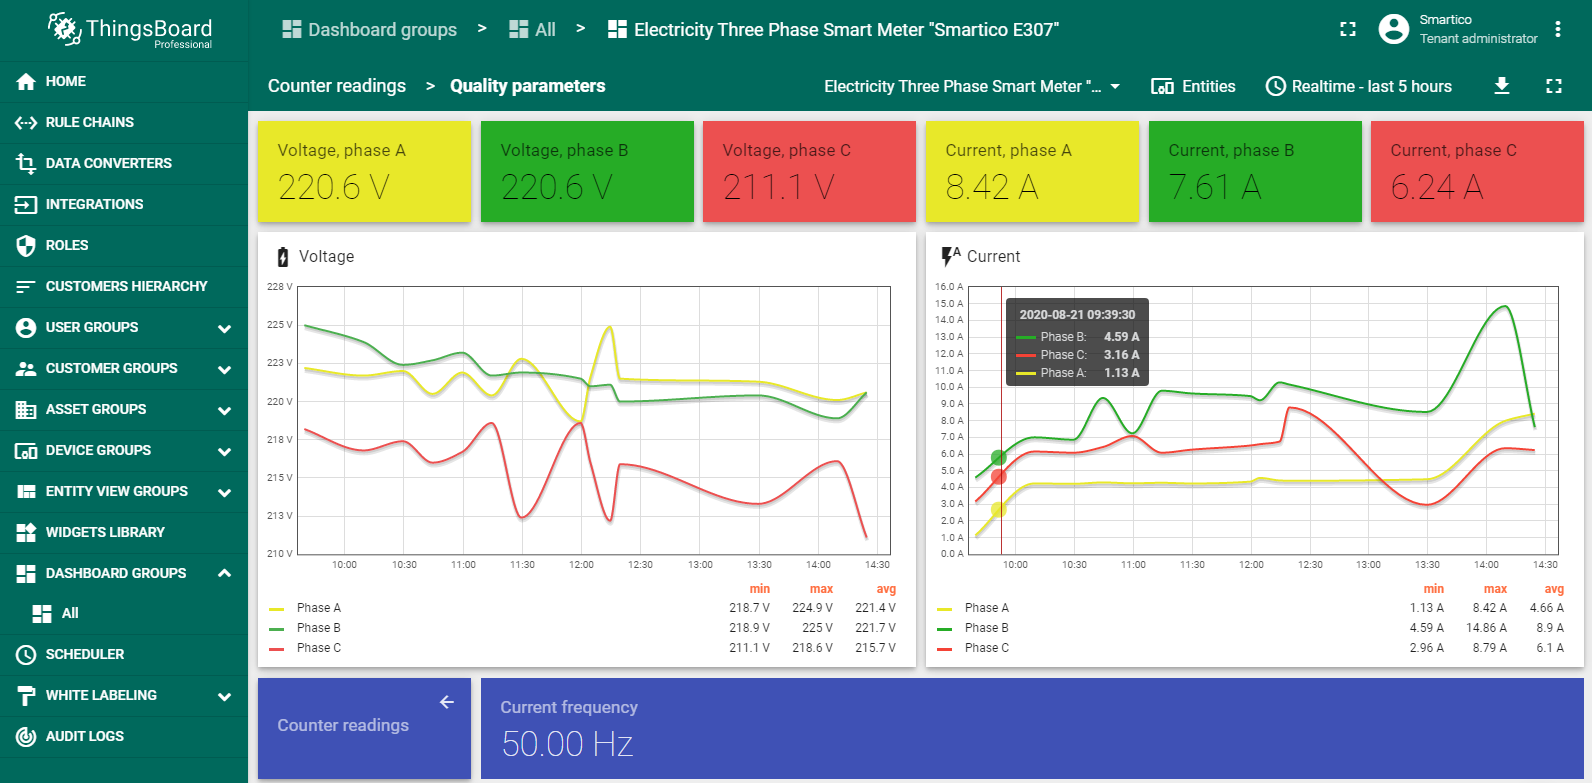
The three-phase Smart Electricity Meters “Smartico E307” is optimized for smart metering systems. It comes in many shapes and variants. The Smartico E307 is a true intelligent meter, able to store data in non-volatile memory and measure active/reactive energy in both consumed and delivered to the power grid. Main function is accuracy measure loop power grid parameters, including voltage, current, power, frequency and other parameters. The dashboard contains two states – Counter readings and Quality parameters. The figure shows states of dashboard with processed telemetry results.
Counter readings state of dashboard.
Quality parameters state of dashboard.
Prerequisites
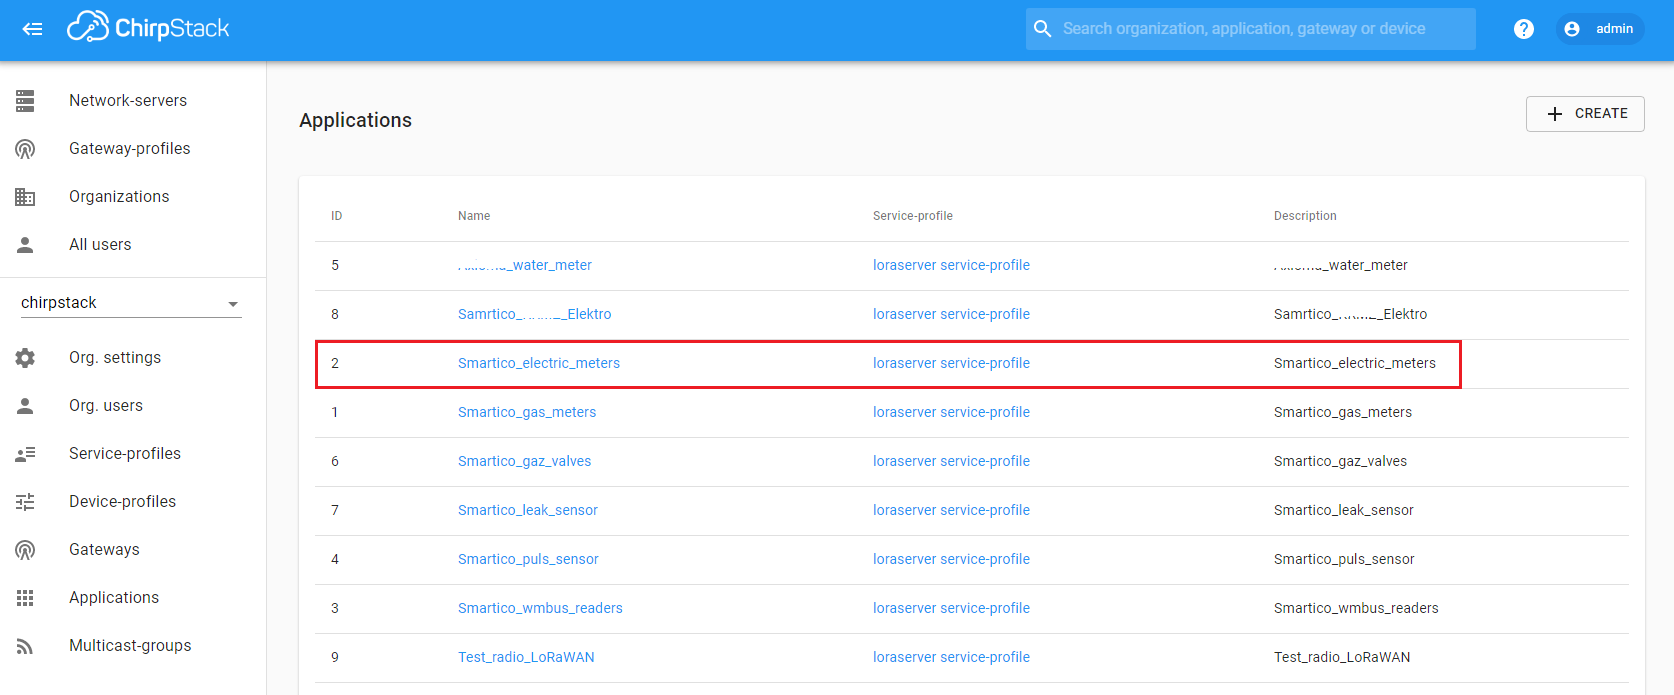
LoRaWAN technology is used to transfer data from the Electricity Meters “Smartico E307” to the ThingsBoard platform. This is the wireless communication technology that allows small amounts of data to be exchanged over a long distance. First of all, you need to configure the LoRaWAN server and make sure that data from the device goes to the server. This guide uses ChirpStack open-source LoRaWAN Network Server. After finishing the server configuration on the Applications page, an entry with the device type should appear in the table.
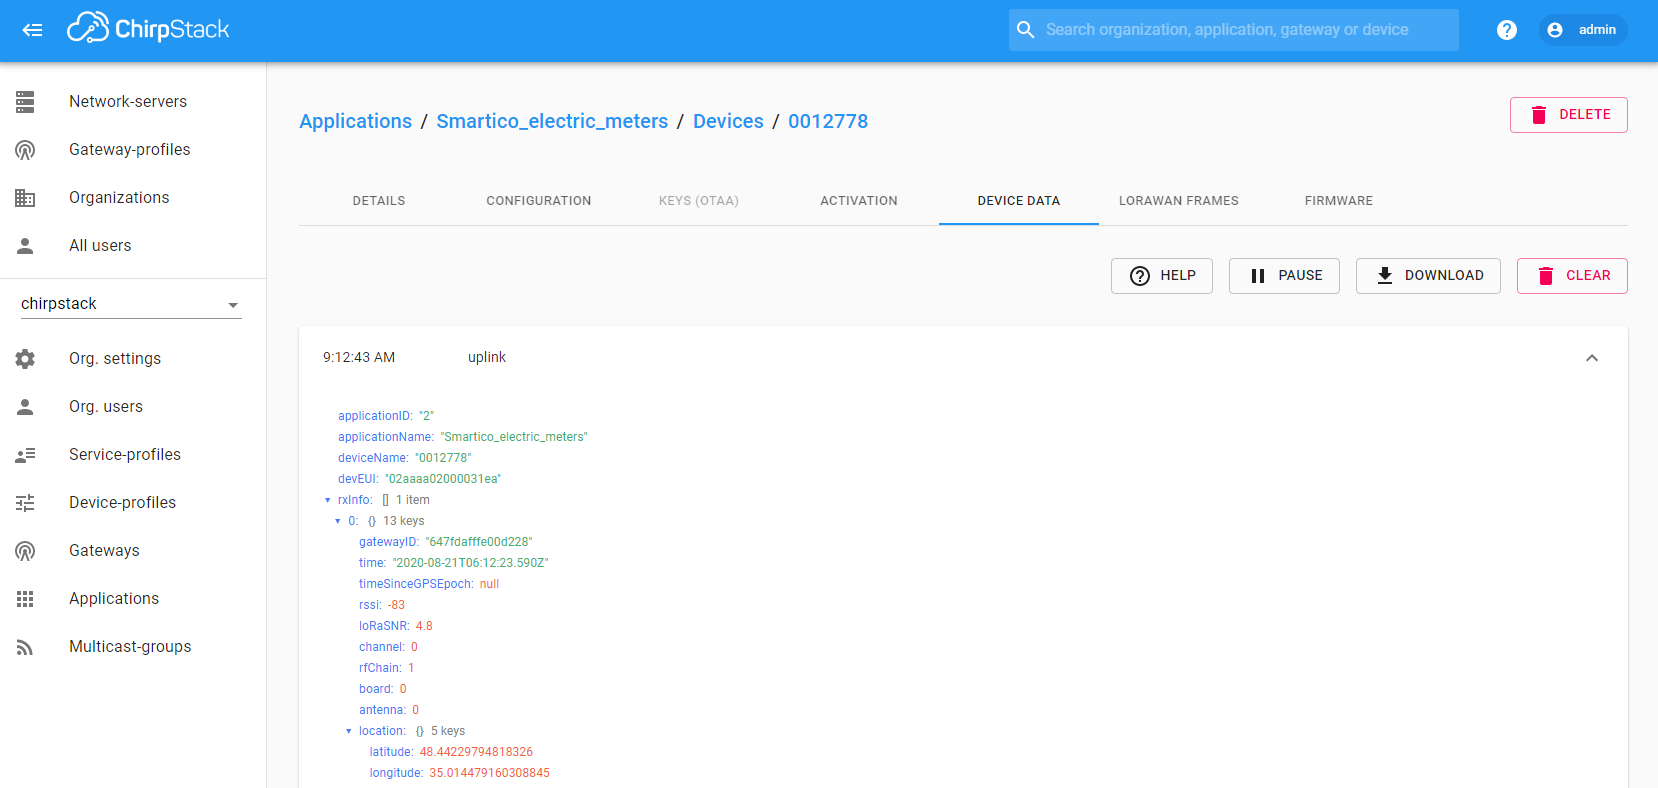
For example, we connected a device with the serial number 0012778. With the correct configuration of the LoRaWAN server, we should see the data flow from the device. The frequency of data transmission from the device depends on the Electricity Meter settings.
To be able to receive data via the MQTT protocol, you need to integrate the LoRaWAN server and the Mosquitto MQTT broker.
Step 1. Creation UpLink Data Converters.
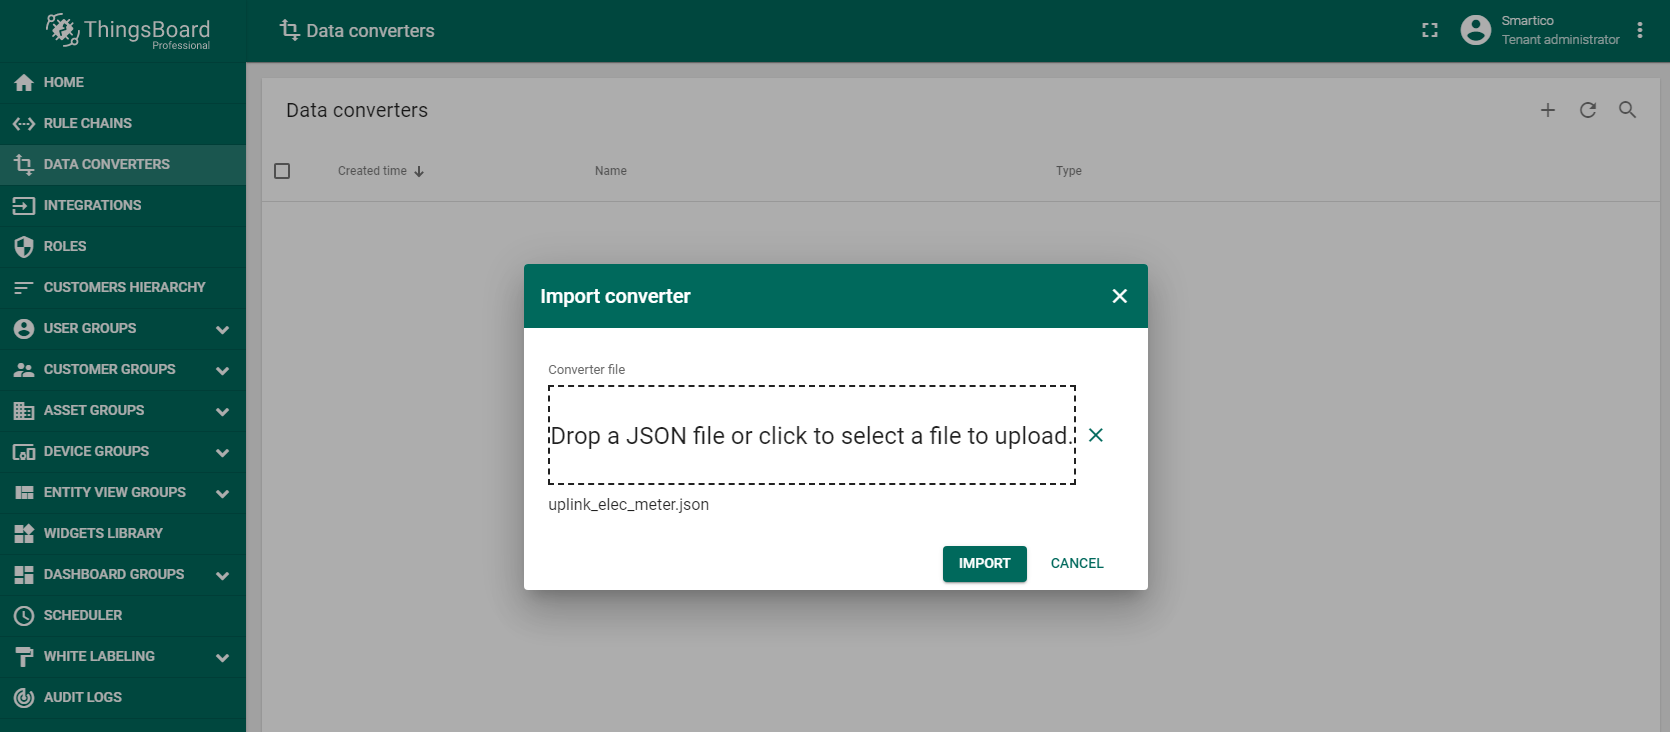
First, you should create the Uplink Data Converter according to the device protocol. The converter will decode incoming telemetry payload data from Electricity Meters “Smartico E307” that contains in encoded Base64 string to human readable, simplified ThingsBoard data format. Import uplink_elec_meter.json file with Uplink data converter.
Step 2. Integration configuration.
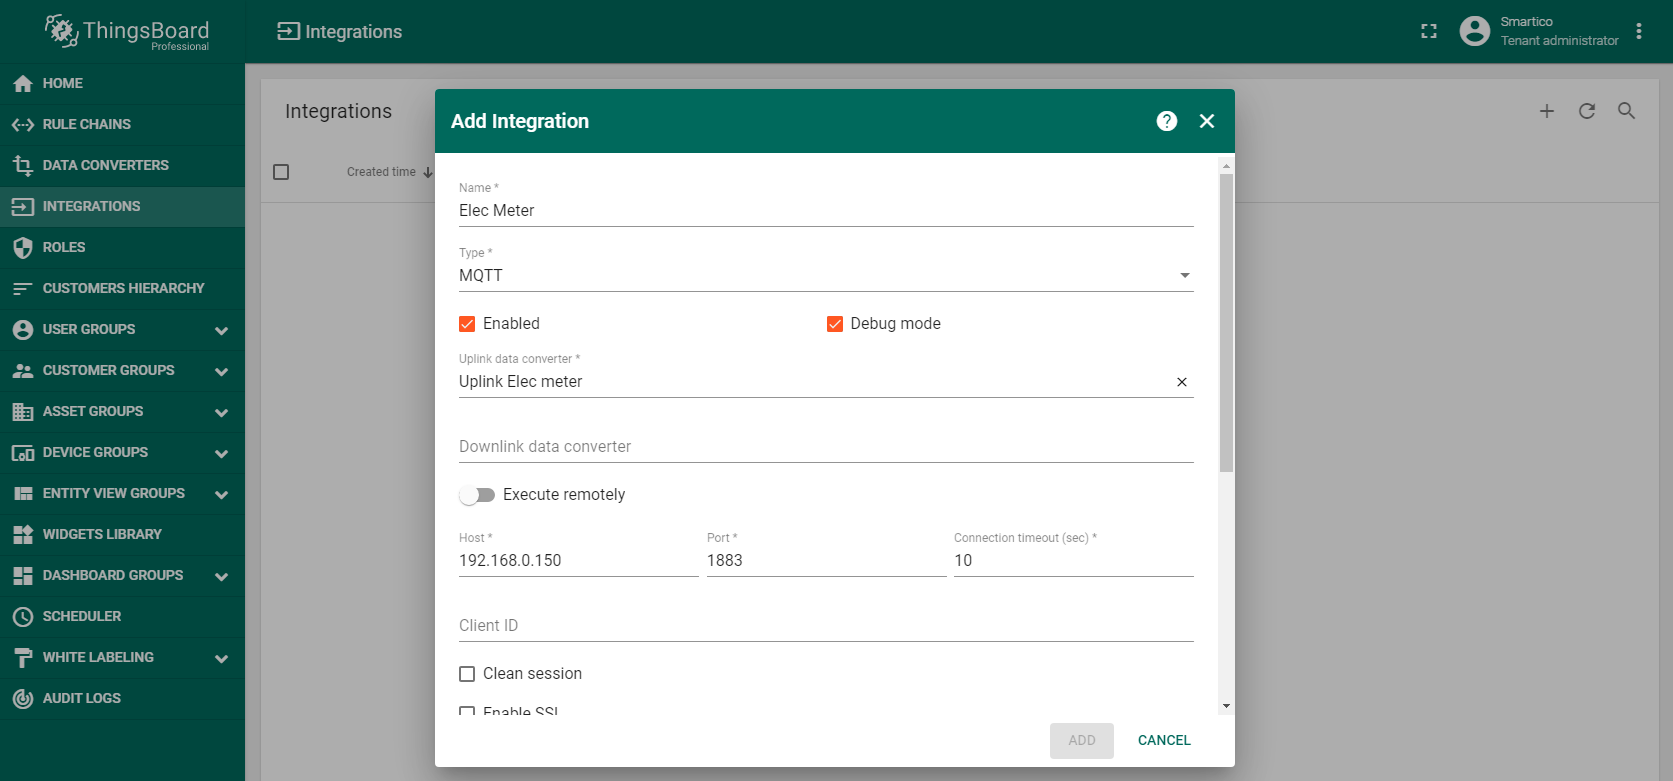
To integrate Electricity Meters “Smartico E307” into ThingsBoard platform you should create a new integration as shown on the figure.
Also below you should add the topic filter according to LoRaWAN server configuration (in this example application/2/device/+/rx ). In the Host and Port fields, enter the ip-address where the MQTT broker is installed and port for working with it.
Step 3. Verifying the receipt of data from the device.
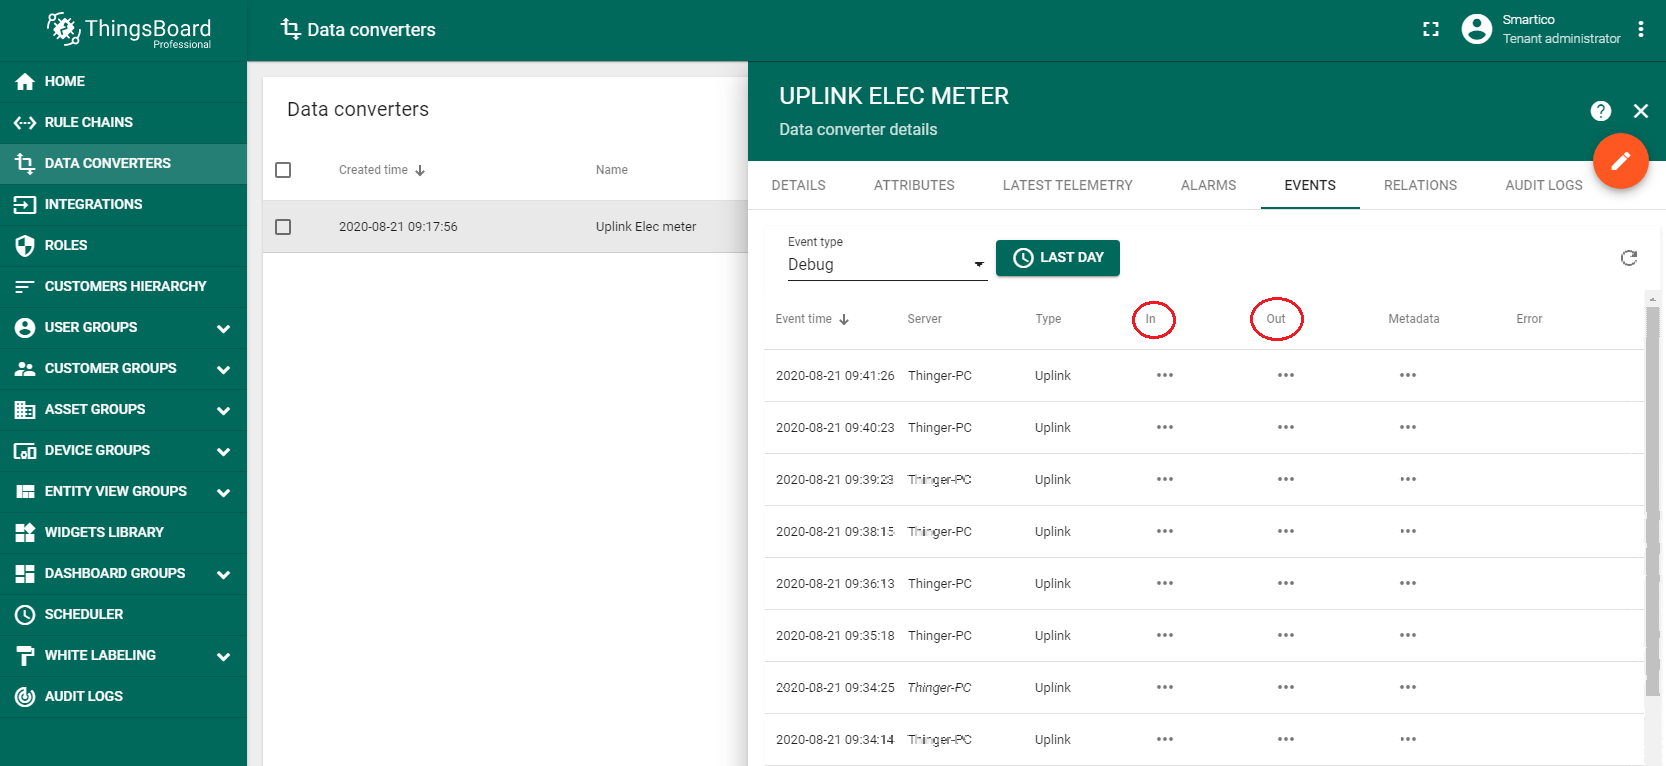
Connect Electricity Meter to transfer information. If the integration was performed without errors, after the transmission of the first telemetry, a new device with the name “0012778” will appear in the “Devices” page of the “Entities” section. Also you can verify the input and output data, respectively, before and after conversion in the “Data converters” page of the “Integrations center” section → Uplink Elec meter → “Events” tab.
Input data from Electricity Meters looks like this:
1
2
3
4
5
6
7
8
9
10
11
12
13
14
15
16
17
18
19
20
21
22
23
24
25
26
{
    "applicationID": "2",
    "applicationName": "Smartico_electric_meters",
    "deviceName": "0012778",
    "devEUI": "02aaaa02000031ea",
    "rxInfo": [{
        "gatewayID": "647fdafffe00d228",
        "uplinkID": "9d29d67f-8db2-4c7e-9fa8-b7f9bd5be9e6",
        "name": "tectelic_micro_lite_TECH",
        "rssi": -80,
        "loRaSNR": 5.2,
        "location": {
            "latitude": 48.44229794818326,
            "longitude": 35.014479160308845,
            "altitude": 144
        }
    }],
    "txInfo": {
        "frequency": 868500000,
        "dr": 0
    },
    "adr": true,
    "fCnt": 2202,
    "fPort": 15,
    "data": "QF8gJWwgSK4giMogyIYhQHEhgcshwTwiw1BBwABNNw=="
}
The payload is contained in the “data” field and encrypted in Base64. After decoding output data will look like this:
1
2
3
4
5
6
7
8
9
10
11
12
13
14
15
16
17
18
19
20
21
22
23
24
25
26
27
28
29
30
31
32
33
34
35
36
37
38
39
40
41
42
43
44
45
46
47
48
49
50
51
{
    "deviceName": "0012778",
    "deviceType": "elecMeter",
    "attributes": {
        "integrationName": "Elec Meter"
    },
    "telemetry": {
        "REAL_TIME": "27.08.2020 09:51:49",
        "SN": "0012778",
        "deviceTypeTelemetry": "Smartico E307",
        "NAME_DEV": "Electricity Meter 'Smartico E307'",
        "VOLTAGE_A": 222.2,
        "VOLTAGE_B": 225,
        "VOLTAGE_C": 218.2,
        "CURRENT_A": 1.13,
        "CURRENT_B": 4.59,
        "CURRENT_C": 3.16,
        "FREQUENCY": 50,
        "POWER_FULL_SUMMARY": 197.67,
        "POWER_FULL_A": null,
        "POWER_FULL_B": null,
        "POWER_FULL_C": null,
        "POWER_ACTIVE_SUMMARY": null,
        "POWER_ACTIVE_A": null,
        "POWER_ACTIVE_B": null,
        "POWER_ACTIVE_C": null,
        "POWER_REACTIVE_SUMMARY": null,
        "POWER_REACTIVE_A": null,
        "POWER_REACTIVE_B": null,
        "POWER_REACTIVE_C": null,
        "VALUE": null,
        "ENERGY_ACTIVE_SUMMARY": null,
        "ENERGY_ACTIVE_T1": null,
        "ENERGY_ACTIVE_T2": null,
        "ENERGY_ACTIVE_T3": null,
        "ENERGY_ACTIVE_T4": null,
        "ENERGY_ACTIVE_T5": null,
        "ENERGY_ACTIVE_T6": null,
        "ENERGY_ACTIVE_T7": null,
        "ENERGY_ACTIVE_T8": null,
        "ENERGY_REACTIVE_SUMMARY": null,
        "ENERGY_REACTIVE_T1": null,
        "ENERGY_REACTIVE_T2": null,
        "ENERGY_REACTIVE_T3": null,
        "ENERGY_REACTIVE_T4": null,
        "ENERGY_REACTIVE_T5": null,
        "ENERGY_REACTIVE_T6": null,
        "ENERGY_REACTIVE_T7": null,
        "ENERGY_REACTIVE_T8": null
    }
}
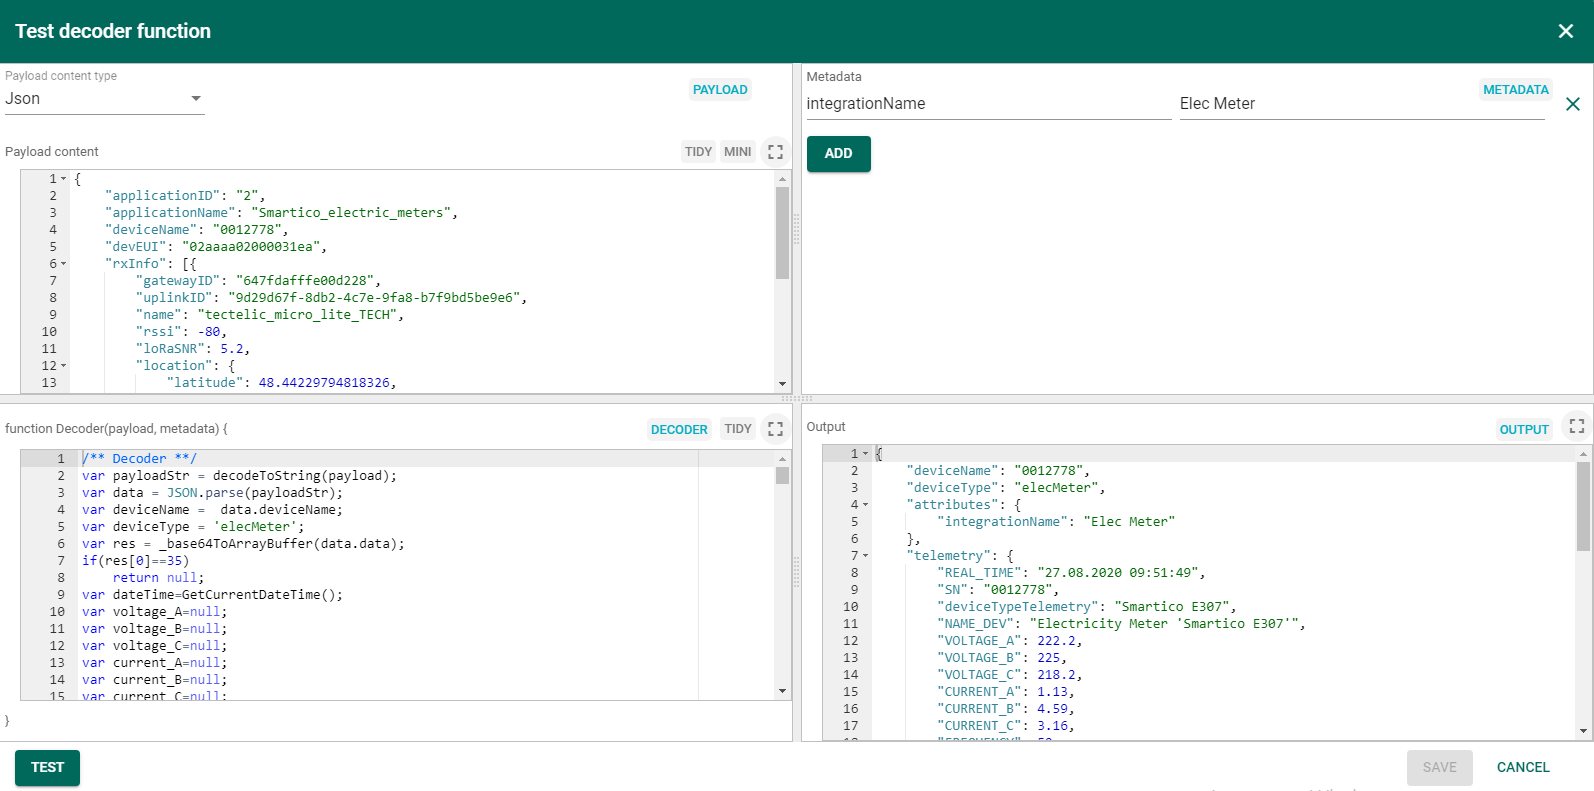
The input and output data are for example purposes only and not related to the dashboard shown at the beginning of the guide. Before turning on the device, you can verify the functionality of programming code from uplink_elec_meter.json file. For this purpose, open the Test decoder function for Uplink Elec meter in the DATA CONVERTERS and copy the input data from this guide into Payload content field. Press TEST button then in Output field should appear decoding output data as shown on the figure (the REAL_TIME field displays the current date and time).
Step 4. Creation Electricity Meter Asset.
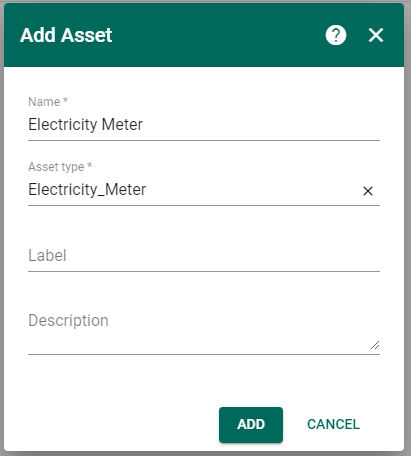
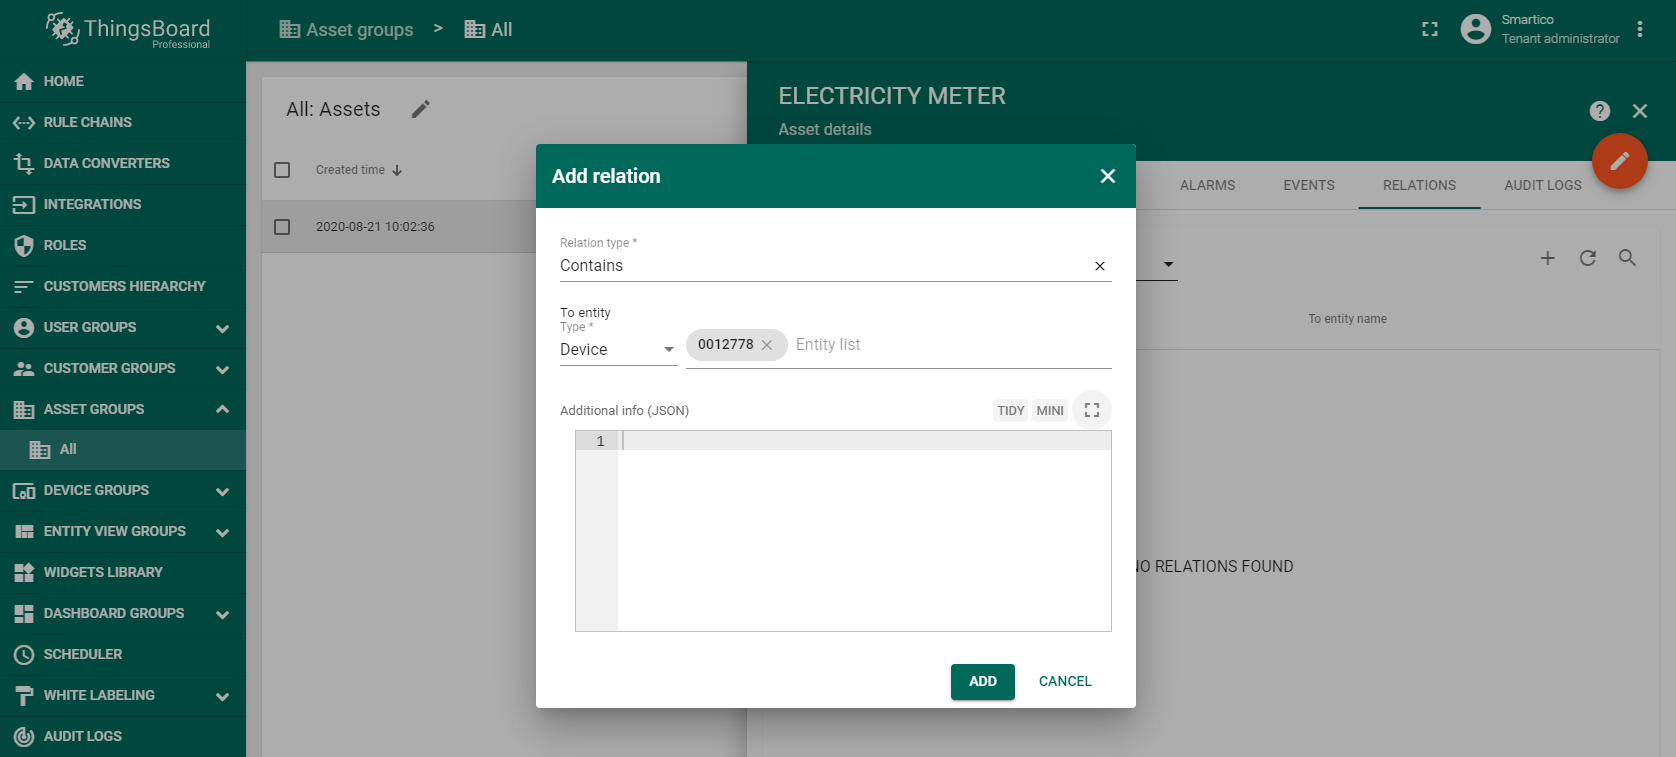
To be able to display data in the dashboard, you should first create an asset and add device 0012778 in the RELATIONS, as shown in the figures.
Step 5. Dashboard import and configuration.
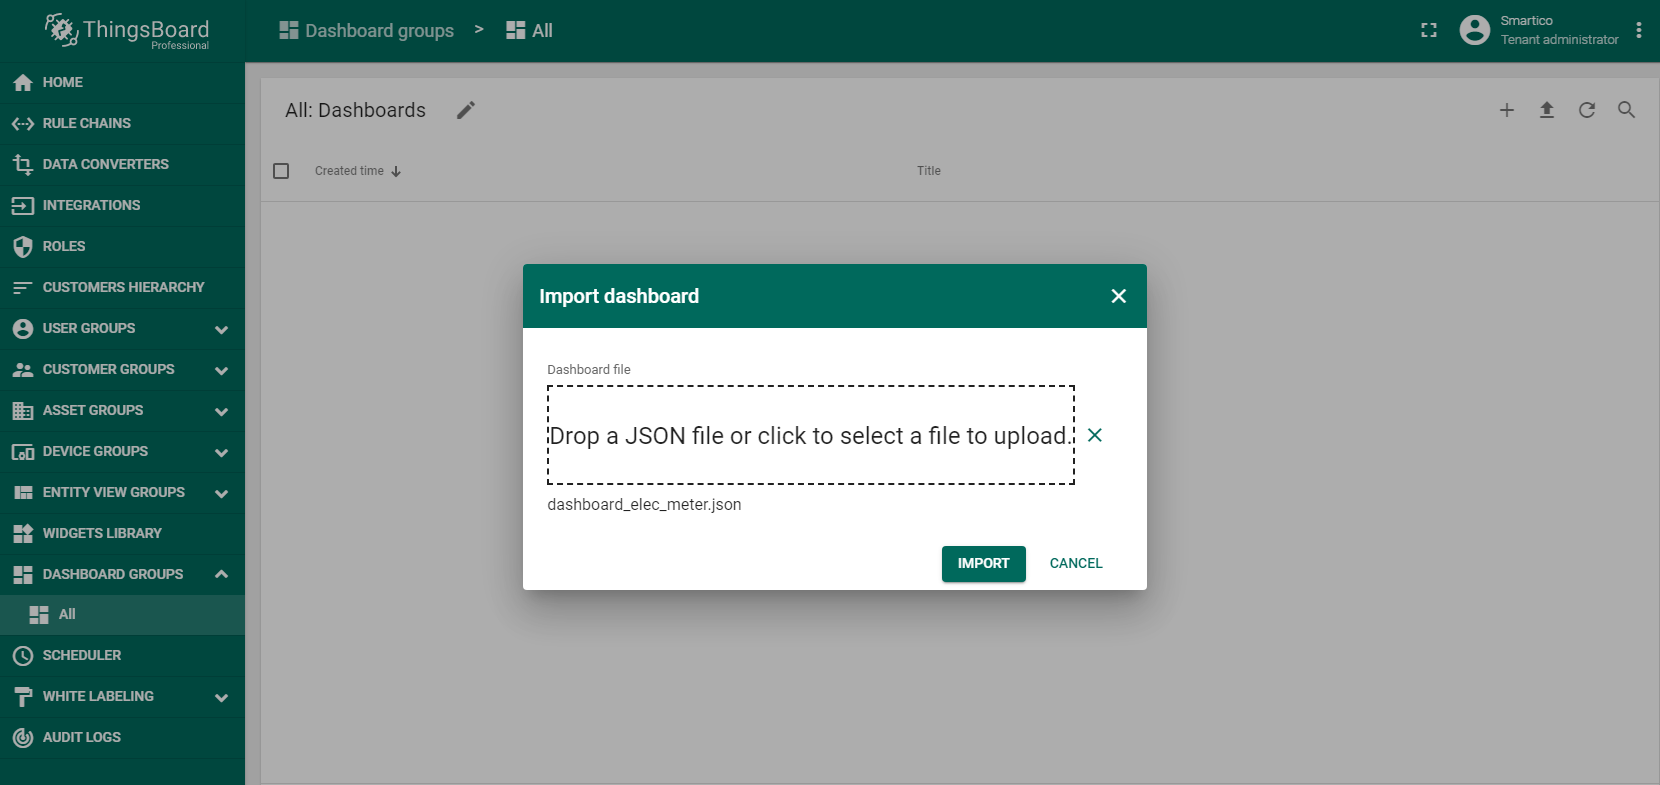
To display data to users, you need to create a dashboard that can be imported from dashboard_elec_meter.json file.
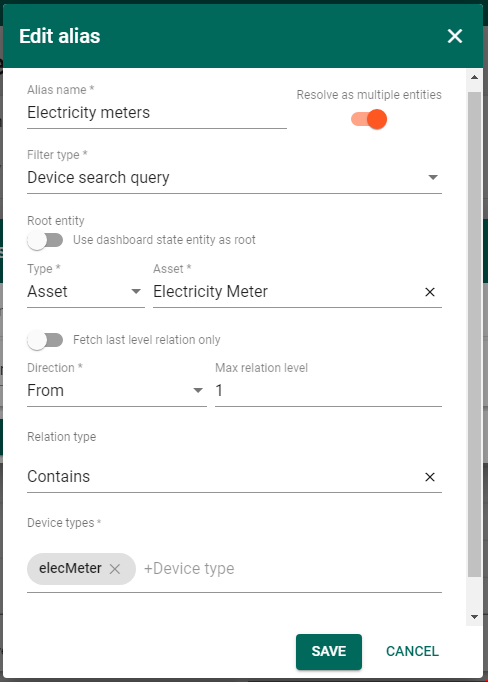
When importing a dashboard, it will be necessary to create an alias, as shown in the figure.
If everything was done correctly, in the “Dashboards” page you will see the new dashboard Electricity Three Phase Smart Meter “Smartico E307” that was provided at the beginning of the guide.
See also
Browse other samples or explore guides related to main ThingsBoard features:
- Device attributes - how to use device attributes.
- Telemetry data collection - how to collect telemetry data.
- Using RPC capabilities - how to send commands to/from devices.
- Rule Engine - how to use rule engine to analyze data from devices.
- Data Visualization - how to visualize collected data.
Your feedback
Don’t hesitate to star ThingsBoard on github to help us spread the word. If you have any questions about this sample - post it on the issues.
Next steps
-
Getting started guides - These guides provide quick overview of main ThingsBoard features. Designed to be completed in 15-30 minutes.
-
Connect your device - Learn how to connect devices based on your connectivity technology or solution.
-
Data visualization - These guides contain instructions on how to configure complex ThingsBoard dashboards.
-
Data processing & actions - Learn how to use ThingsBoard Rule Engine.
-
IoT Data analytics - Learn how to use rule engine to perform basic analytics tasks.
-
Advanced features - Learn about advanced ThingsBoard features.
-
Contribution and Development - Learn about contribution and development in ThingsBoard.
