- Adding alarm rules
- Adding alarms table widget
- Alarm trigger testing
- Adding alarm widget to all other states
- Final view of the dashboard for this lesson
- Next step
We continue developing our dashboard. In the previous lesson, we added and configured separate states for each device and configured them to display telemetry data.
If you have not completed the previous lesson yet, we strongly recommend reviewing it before proceeding.
Lesson 3: Adding and configuring individual states for each device
In this lesson, we focus on configuring alarm rules and visualizing alarms on the dashboard.
Specifically, we will:
- Configure alarm rules for the Indoor Air Quality Sensor that generate alarms when temperature or humidity thresholds are violated, or when CO₂ levels exceed the defined limits.
- Add dashboard widgets for monitoring active alarms.
- Test alarm triggering, acknowledgment, and clearing.
Let's get started.
An alarm is a notification generated when critical conditions defined in alarm rules are detected in your IoT system.
For more information on working with alarms and configuring alarm rules, refer to the relevant documentation.
Adding alarm rules
The Indoor Air Quality sensor device that sends telemetry data such as temperature, humidity, and CO₂ levels to ThingsBoard uses the air-sensor device profile.
Configure alarm rules for this profile to ensure they are applied to all sensors using the profile.
High temperature alarm rule
First, configure an alarm rule with the High temperature type using the following conditions:
- If the temperature exceeds 24 °C but does not exceed 26 °C (inclusive), a Major severity alarm is created.
- If the temperature exceeds 26 °C, a Critical severity alarm is created.
- If the temperature drops below 24 °C, the alarm is automatically cleared.
1. Create new alarm rule
- Go to the Alarm rules tab of the Alarms page.
- Click the “+” button in the top-right corner and select Create new alarm rule.
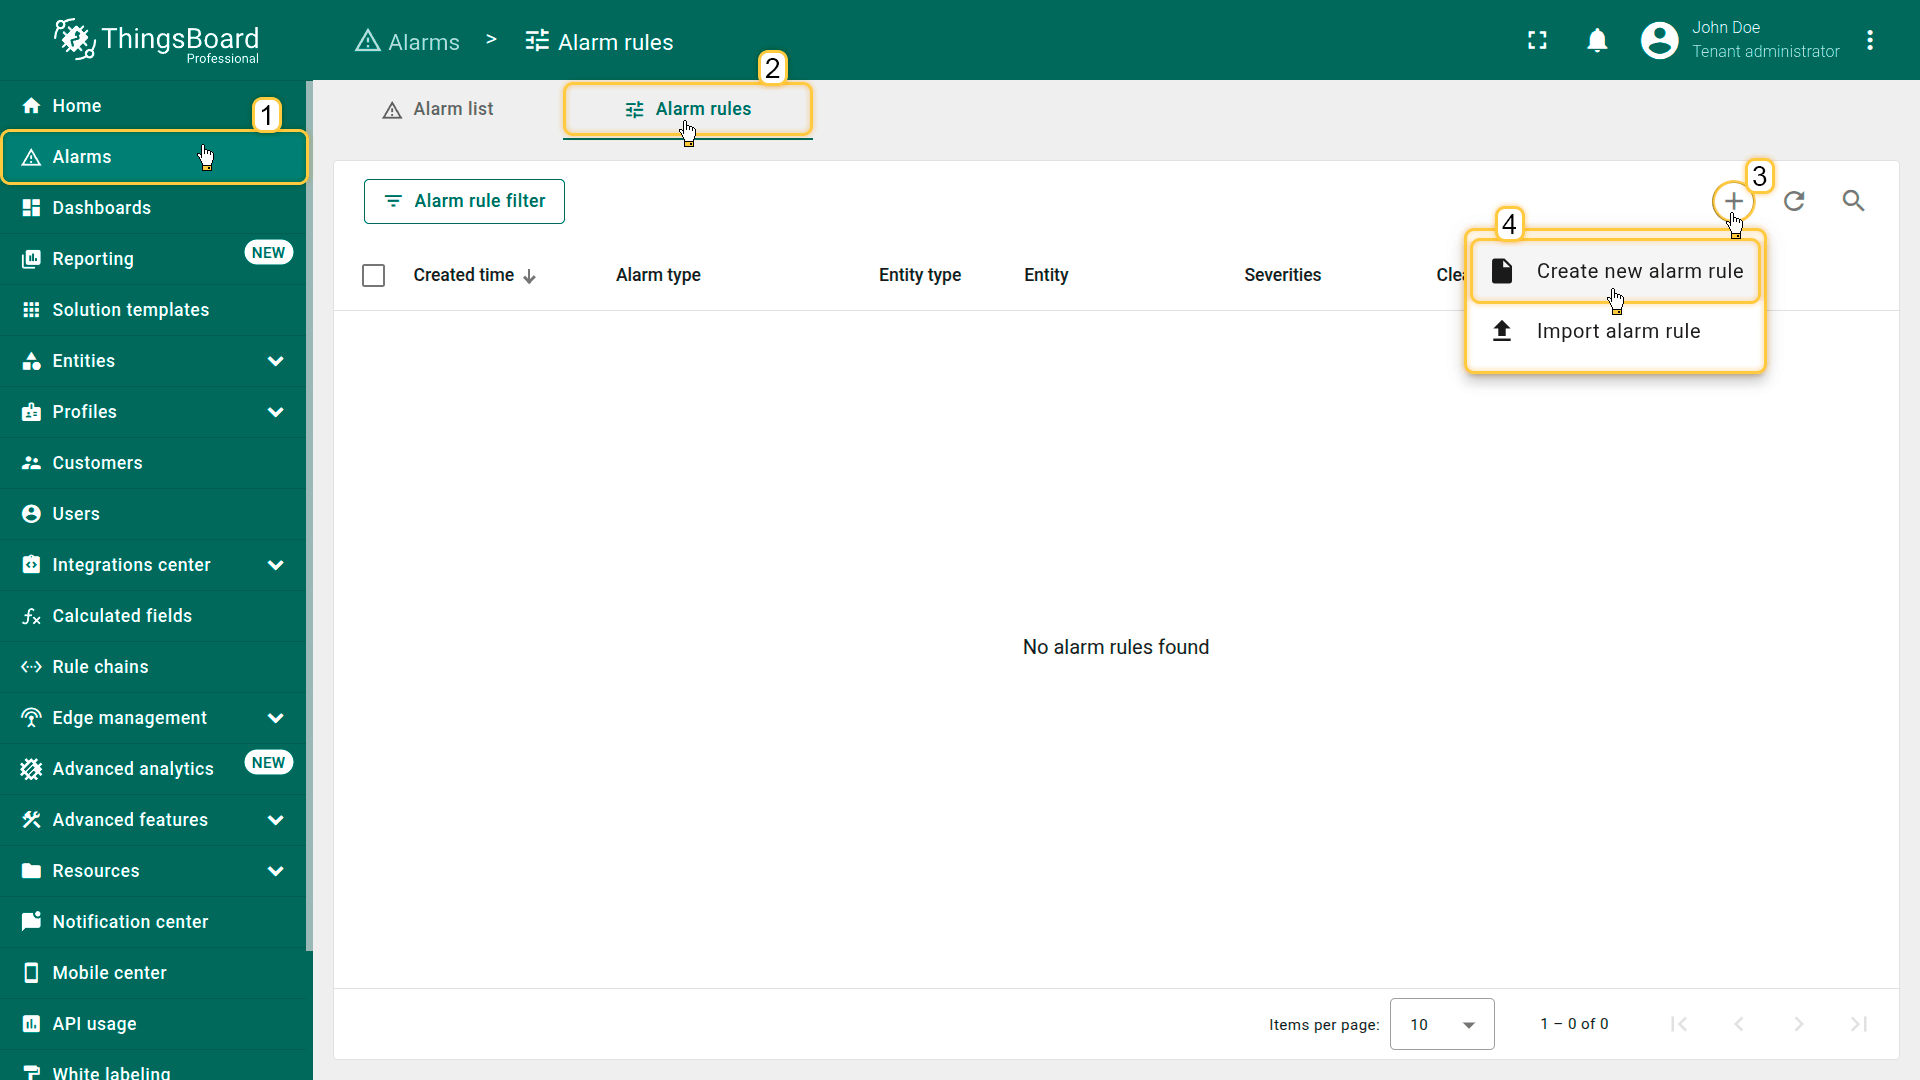
- Click the "+" button (3) in the top-right corner and select Create new alarm rule (4).
2. Configure the General parameters
In the General section, specify the following settings:
- Alarm type: High temperature
- Entity type: Device profile
- Device profile: air-sensor
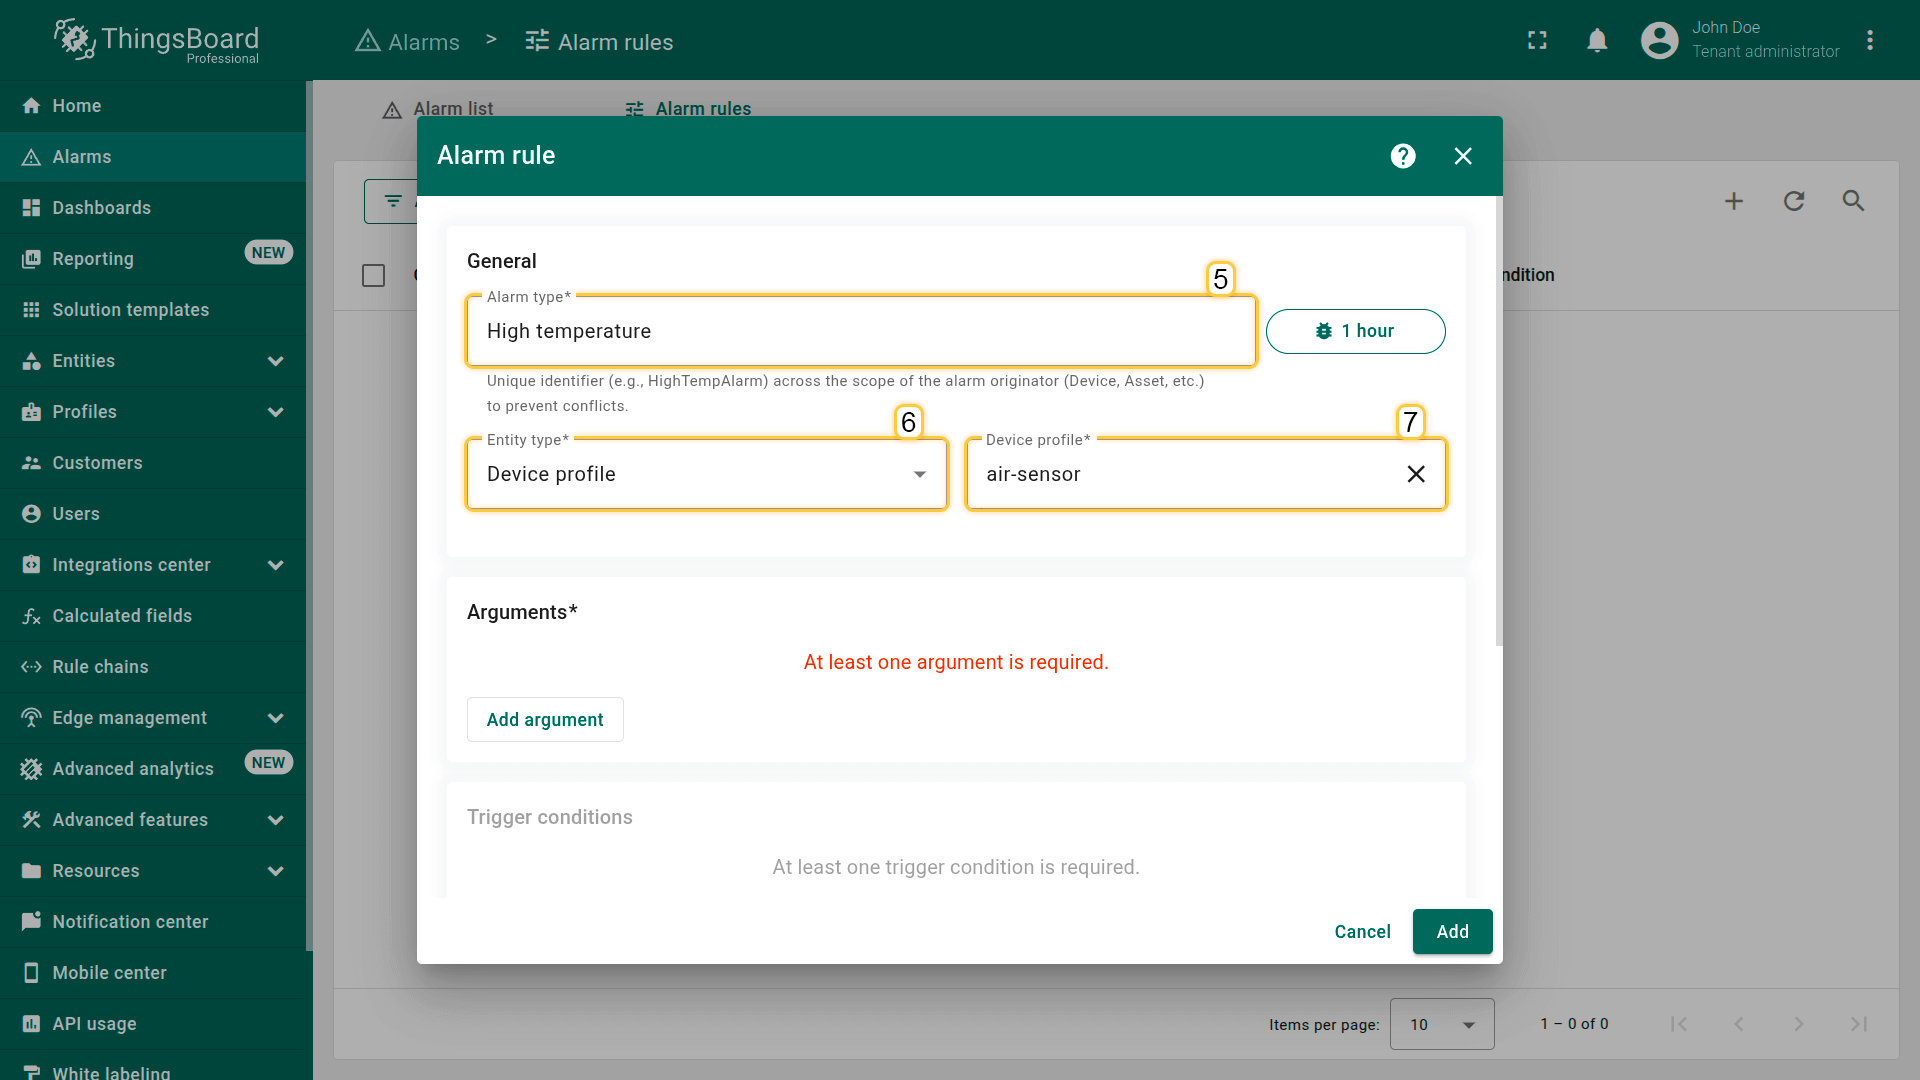
- Alarm type (5): High temperature
- Entity type (6): Device profile
- Device profile (7): air-sensor
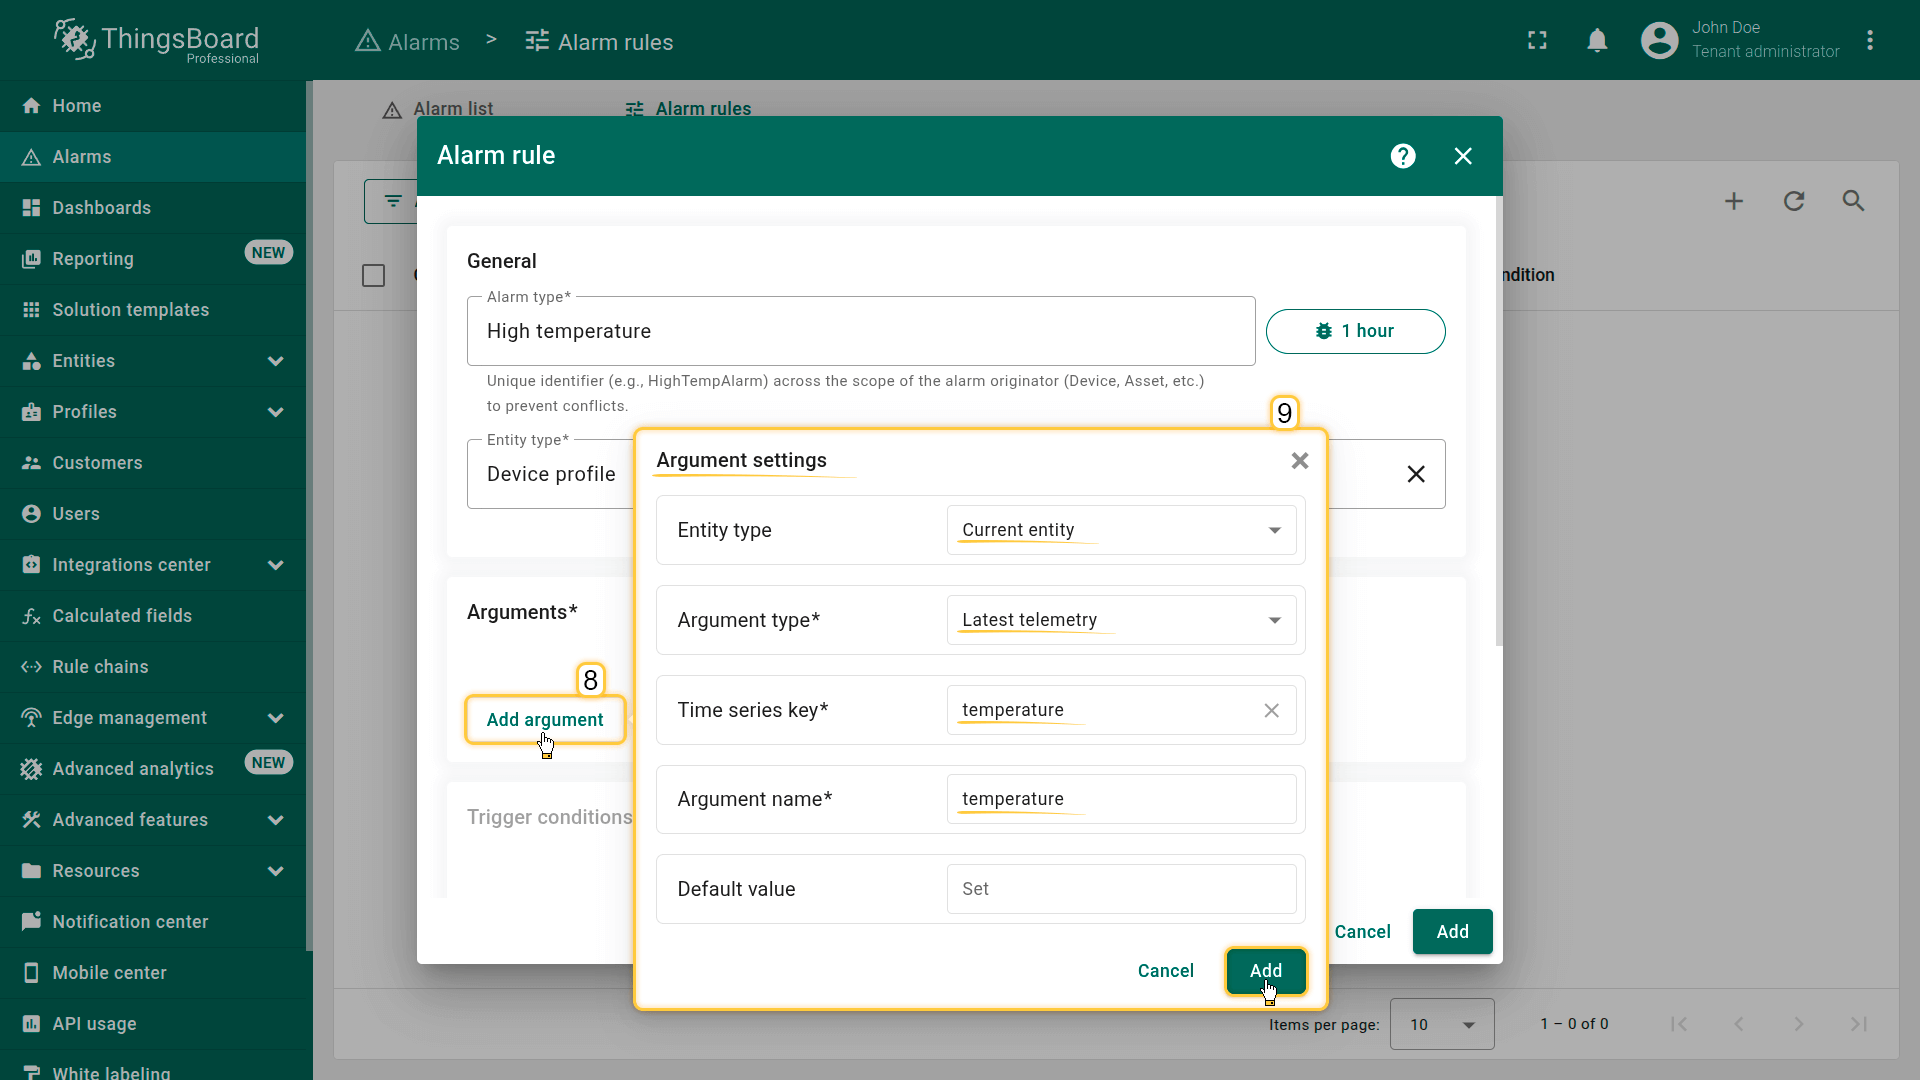
3. Add an argument
Add an argument — the variable whose data will be used in the rule condition.
In the Arguments section:
- Click Add argument and fill in:
- Entity type: Current entity
- Argument type: Latest telemetry
- Time series key: temperature
- Argument name: temperature
- Click Add.
4. Add "Critical" trigger condition
Add an alarm trigger condition with “Critical” severity that is activated when the temperature exceeds 26 °C.
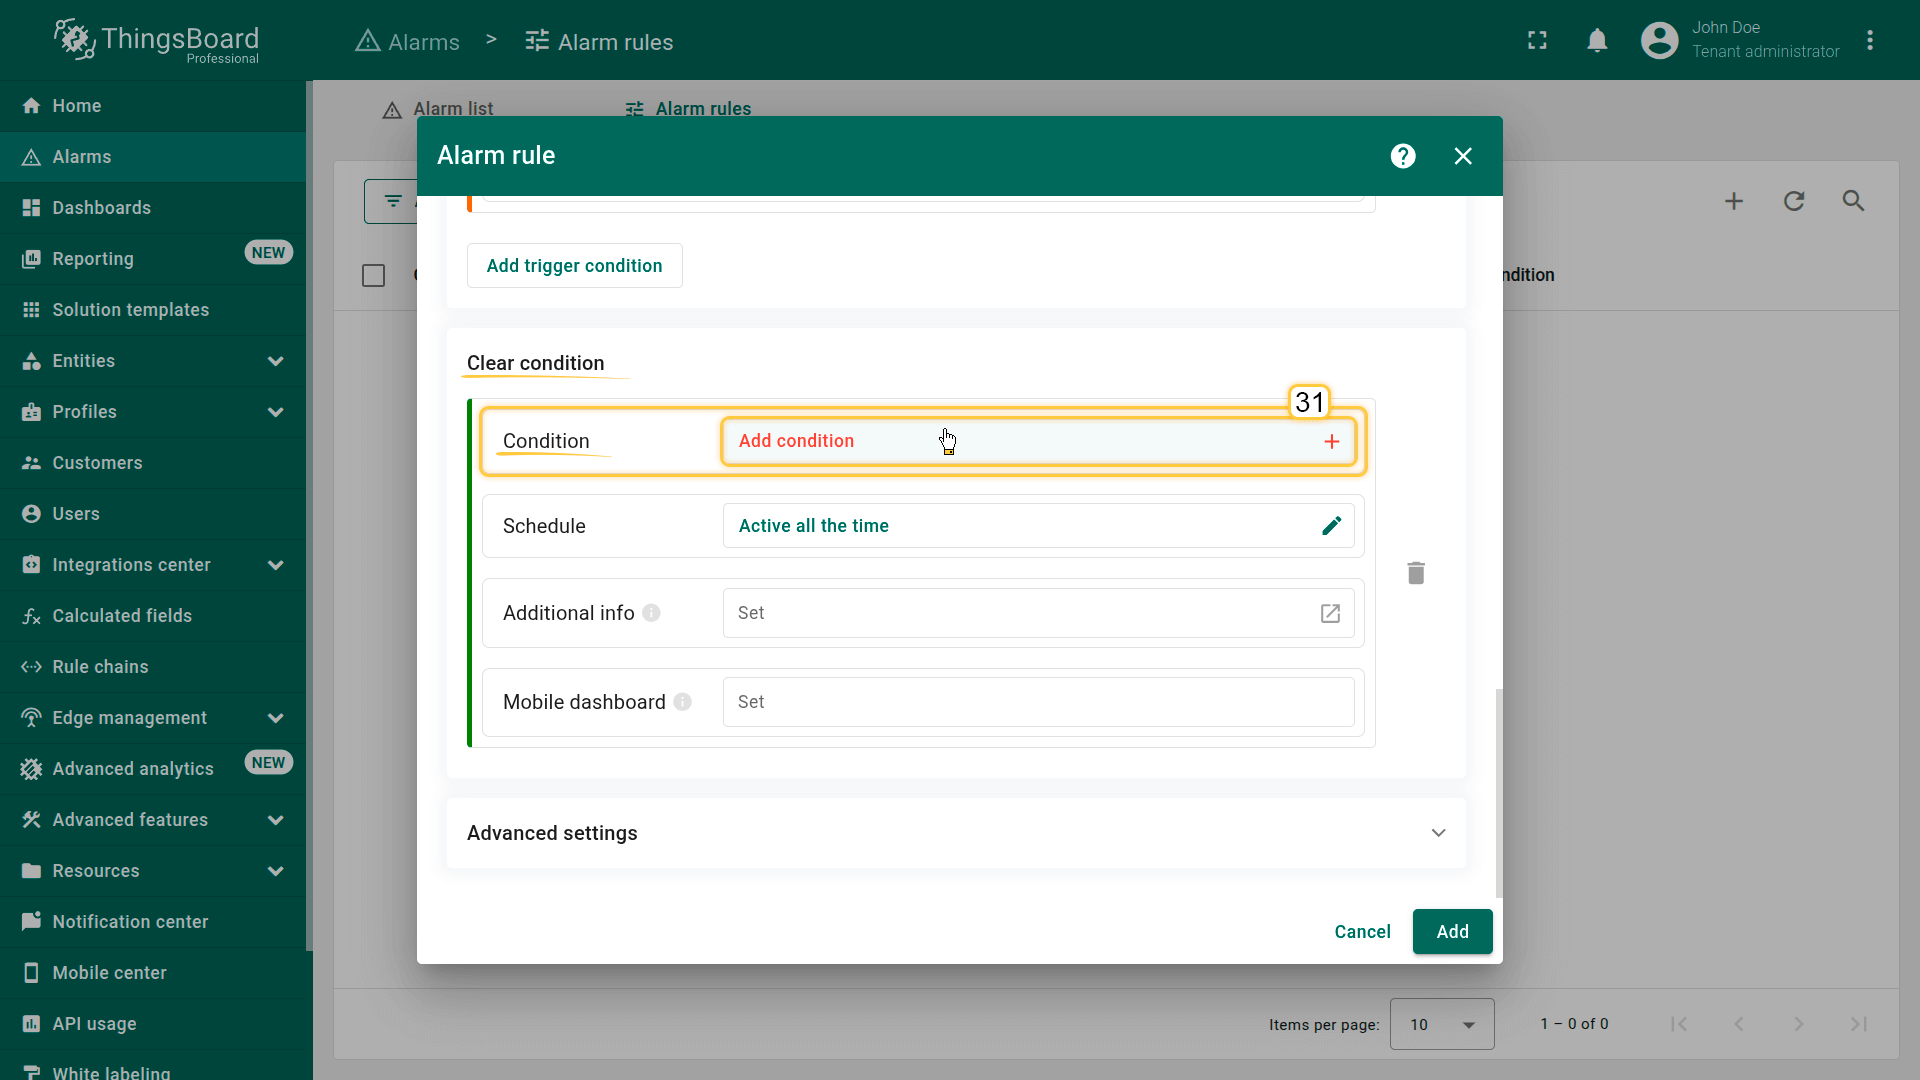
In the Create condition section, click Add create condition.
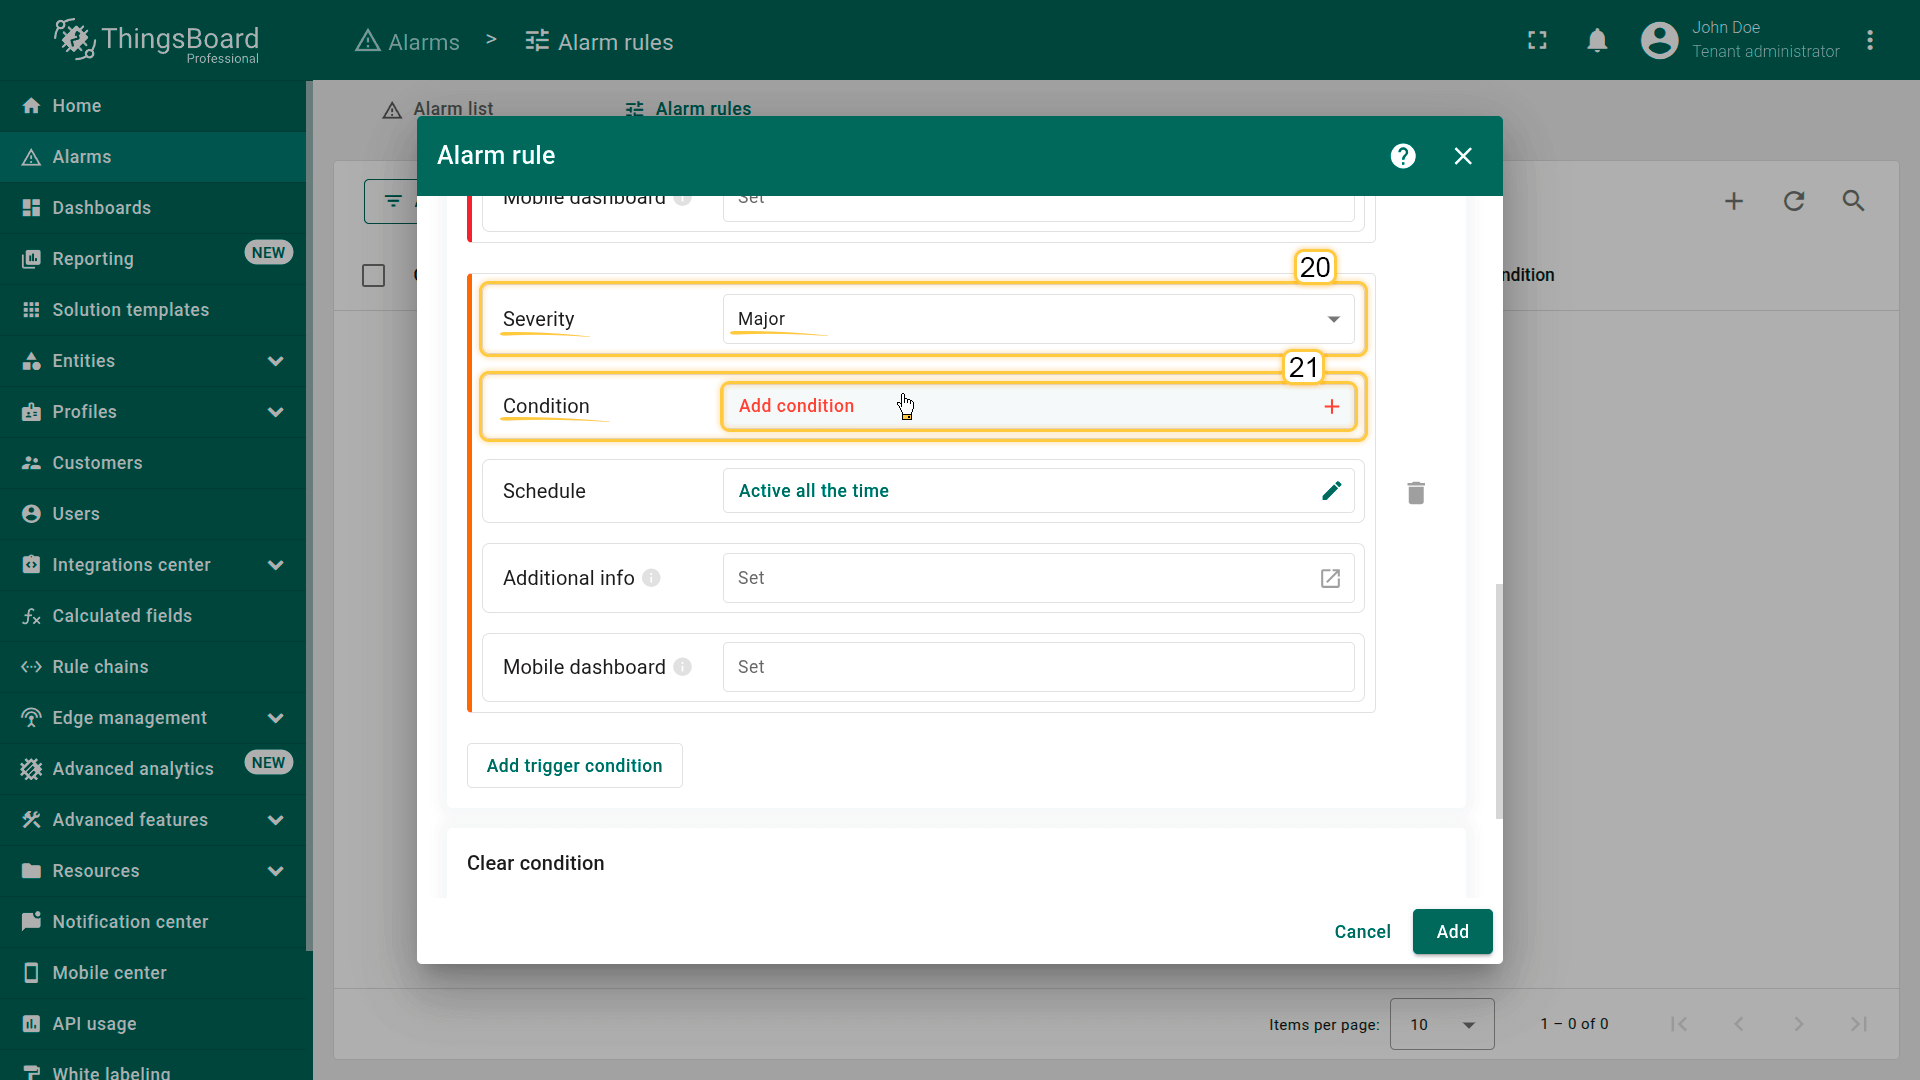
- Severity: Critical
- Condition
- Click Add condition.
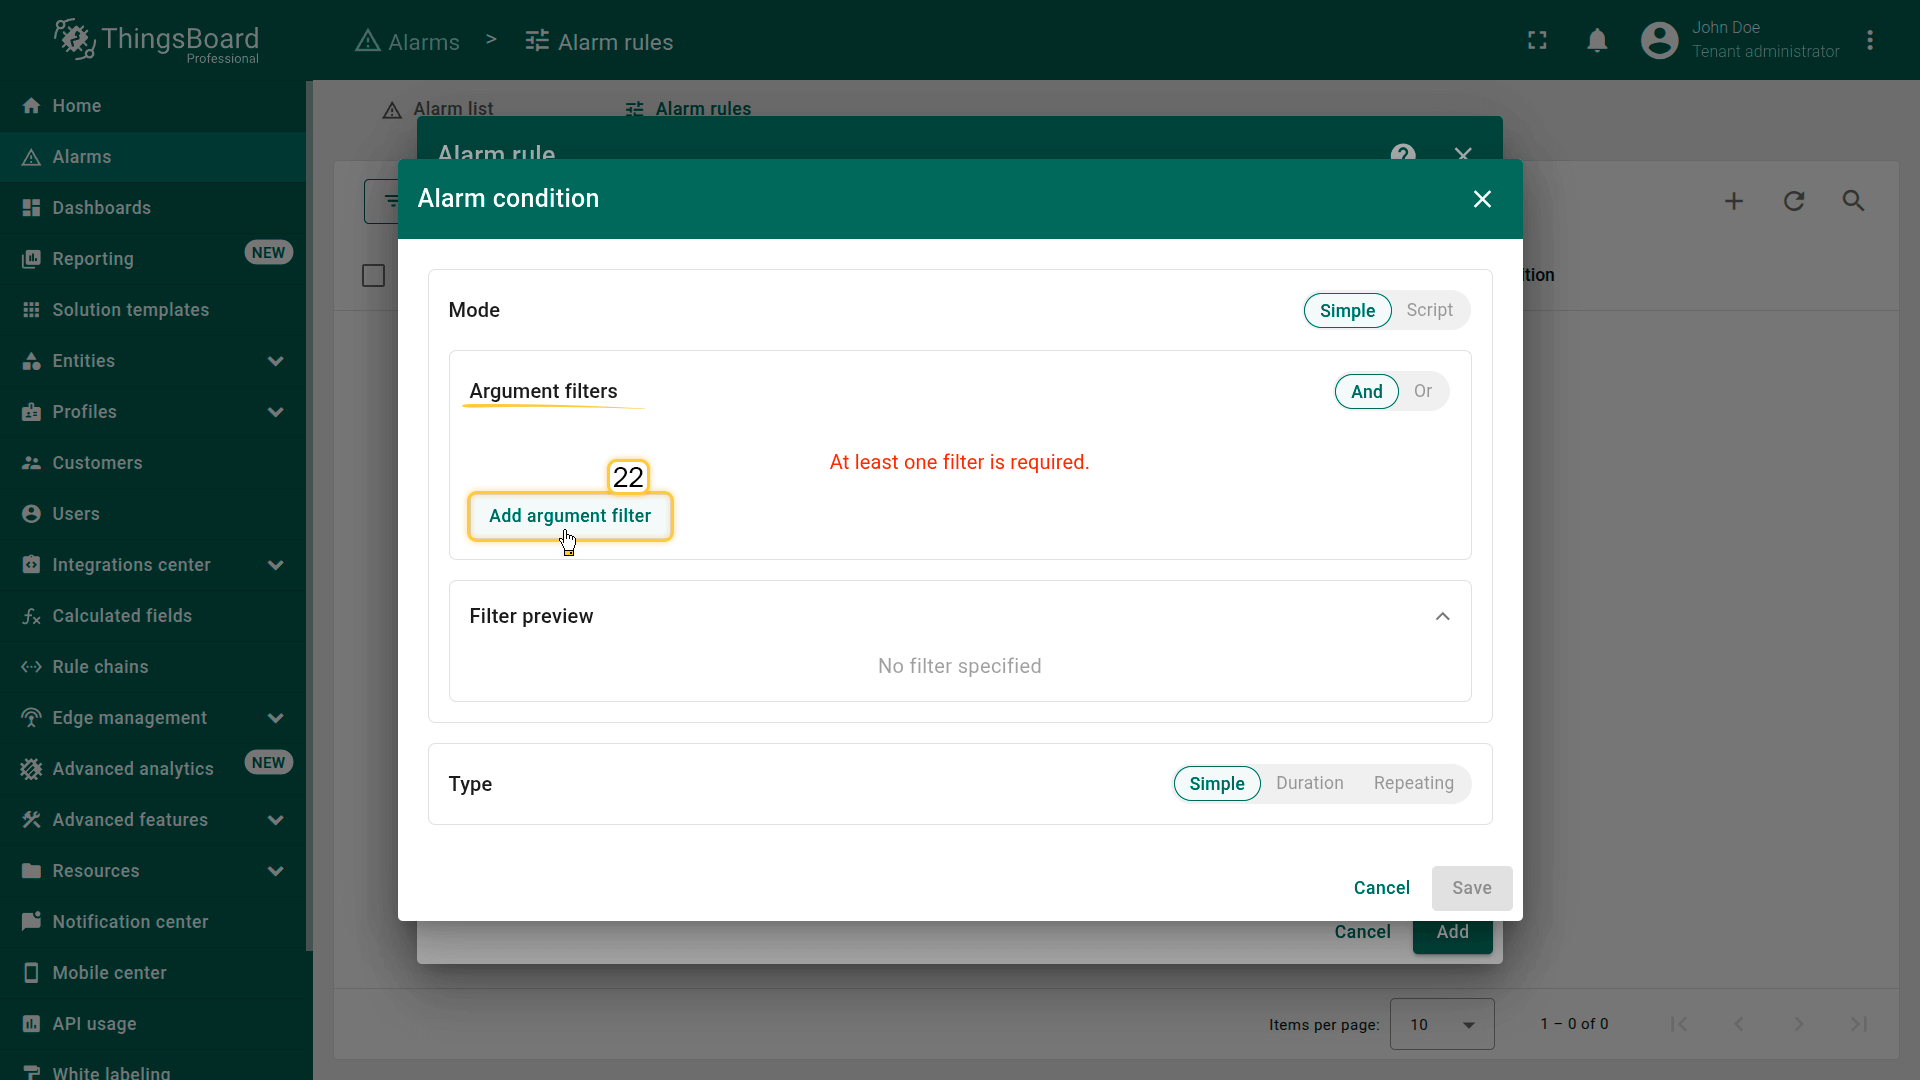
- In the configuration window, click Add argument filter and specify:
- General block:
- Argument: temperature (the argument added earlier)
- Value type: Numeric
- Filters block:
- Click Add filter:
- Operation: greater than
- Value source: Static
- Value: 26
- Click Add filter:
- Click Add.
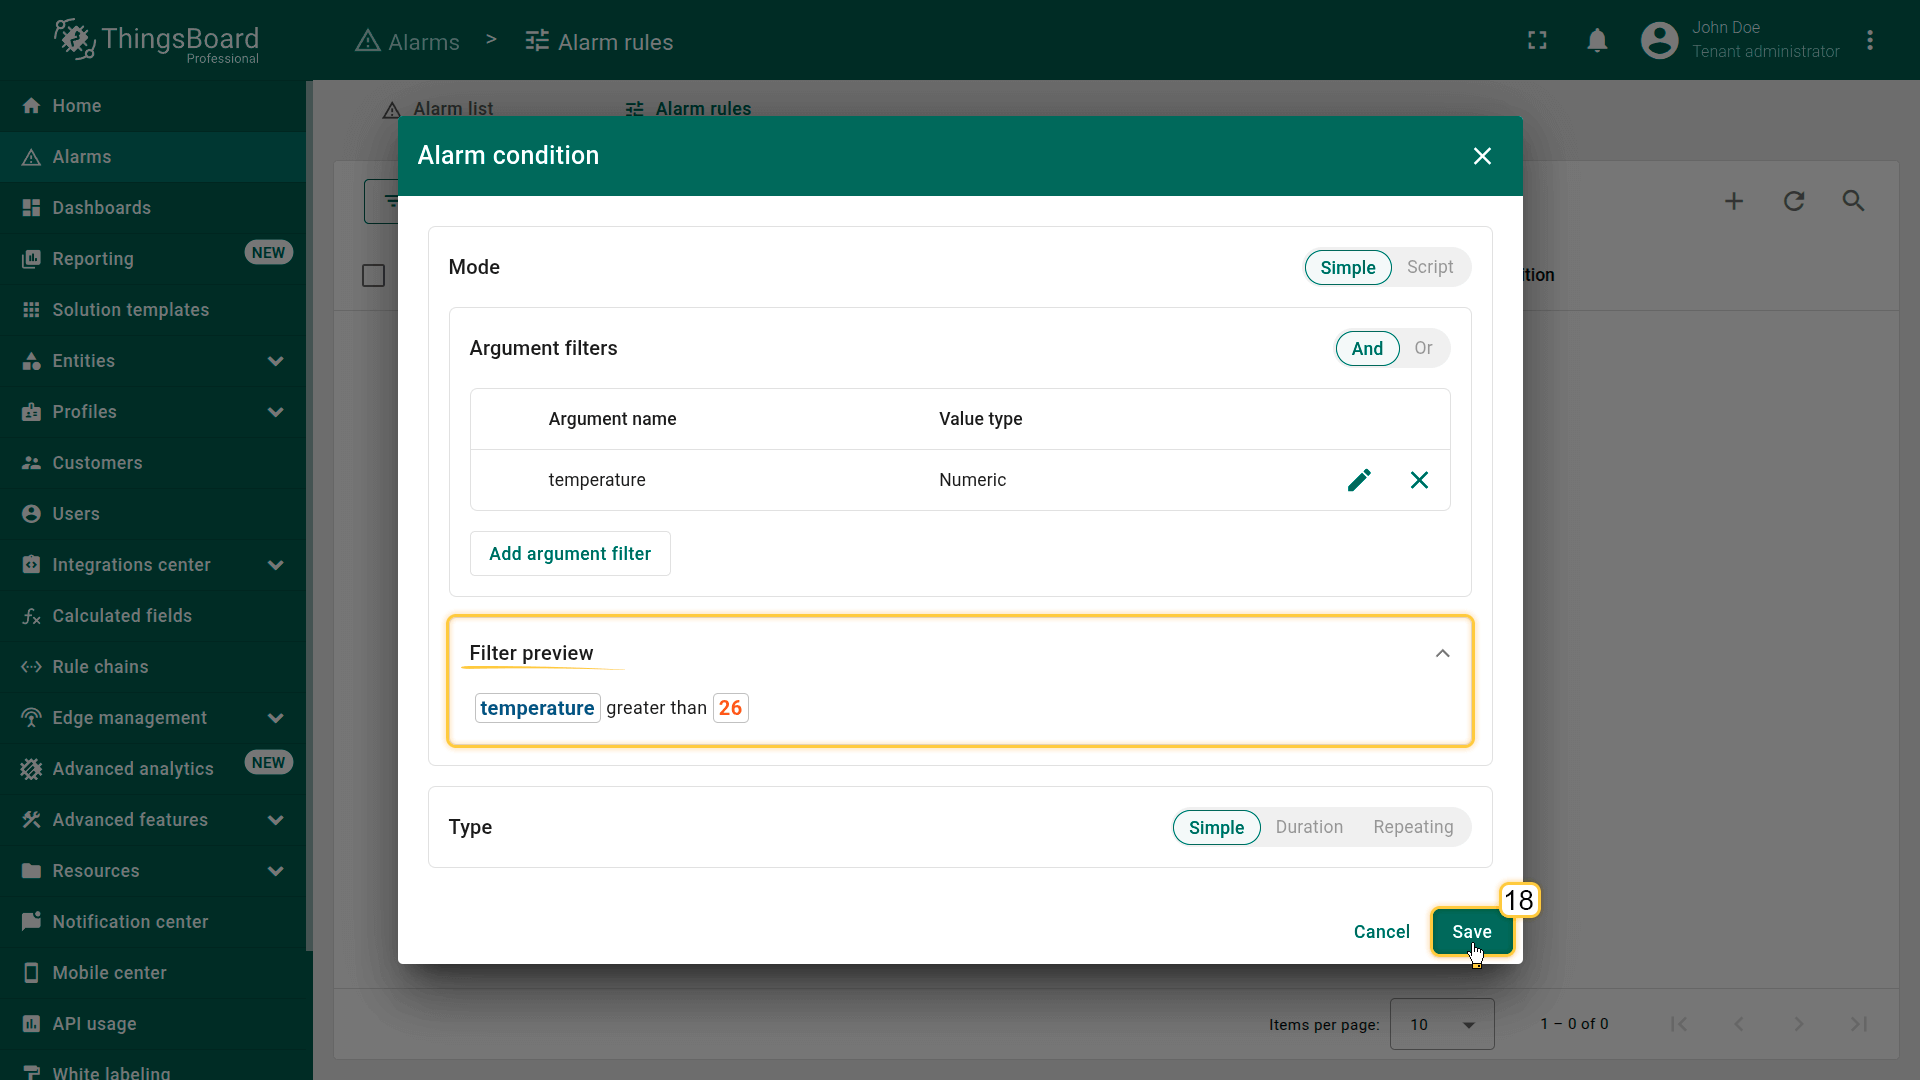
- General block:
- Click Save.
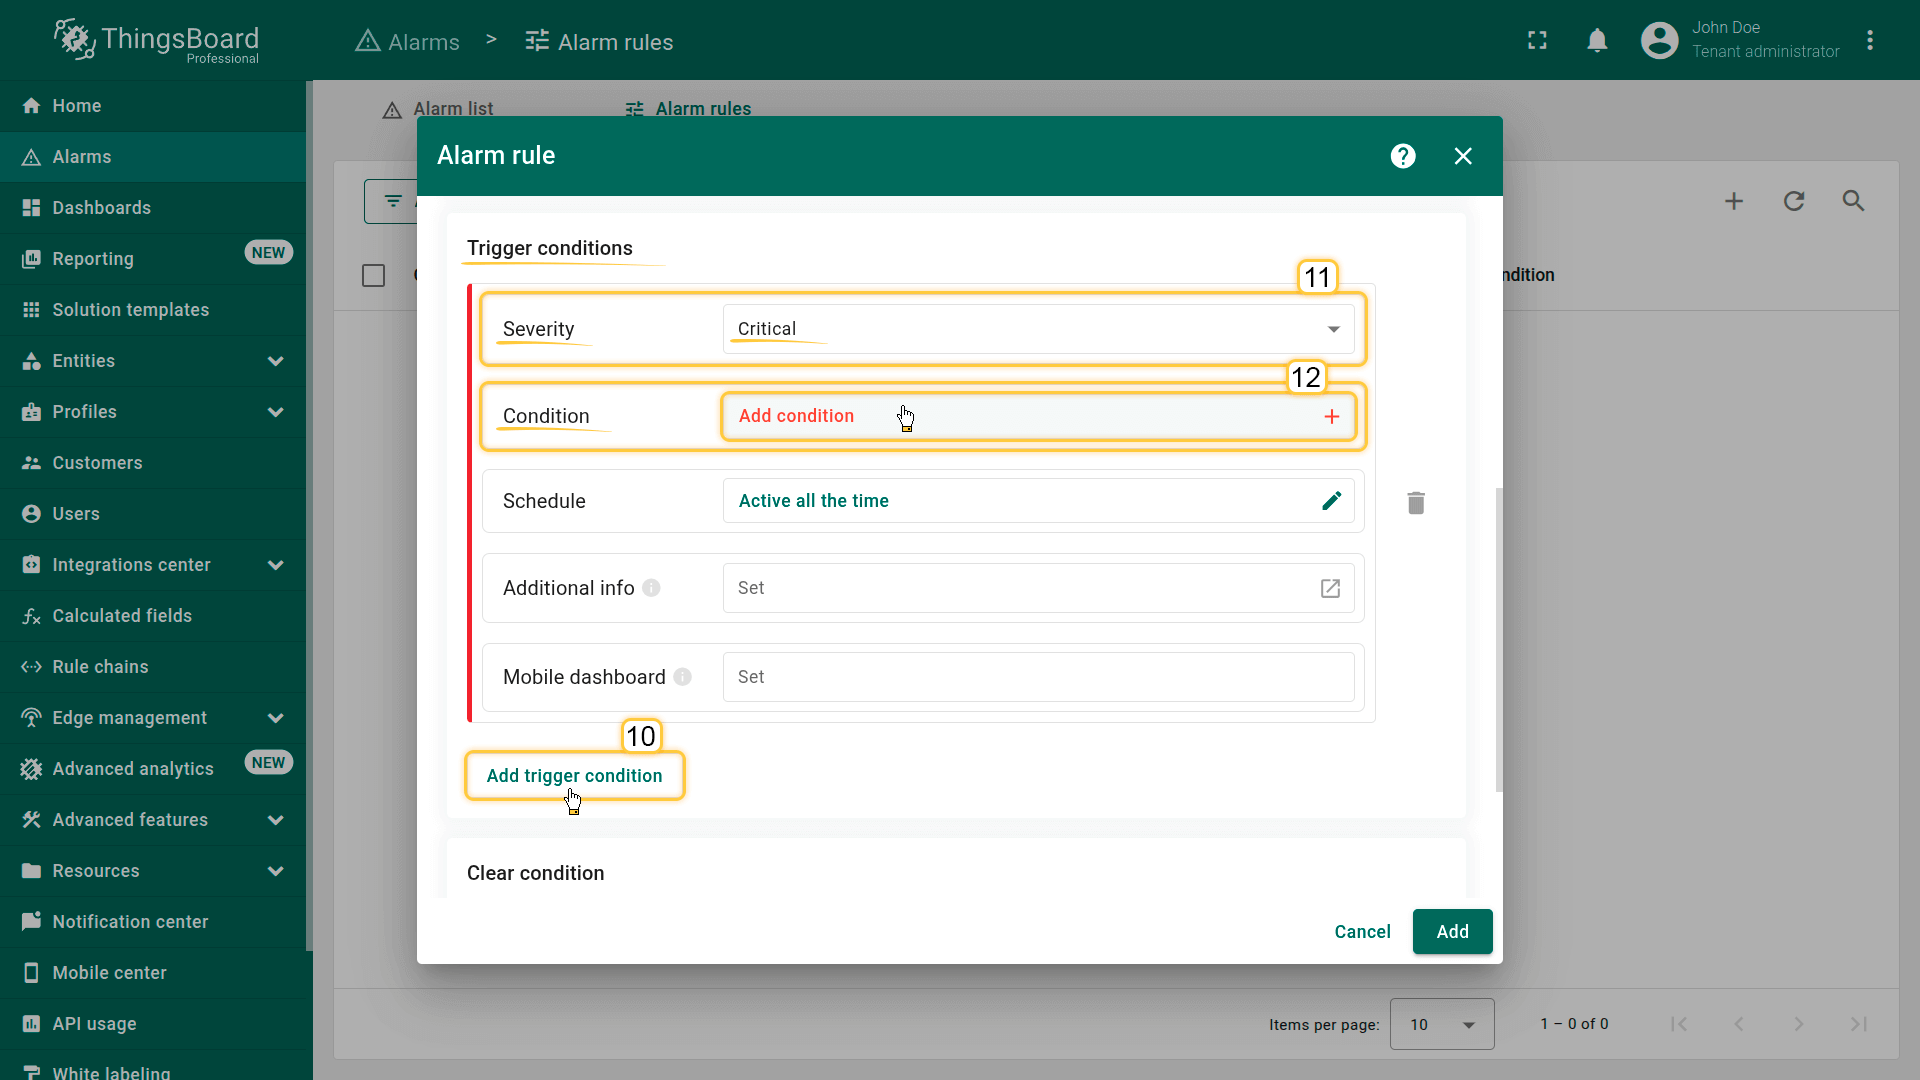
Set severity level to Critical (11), and click Add condition (12).

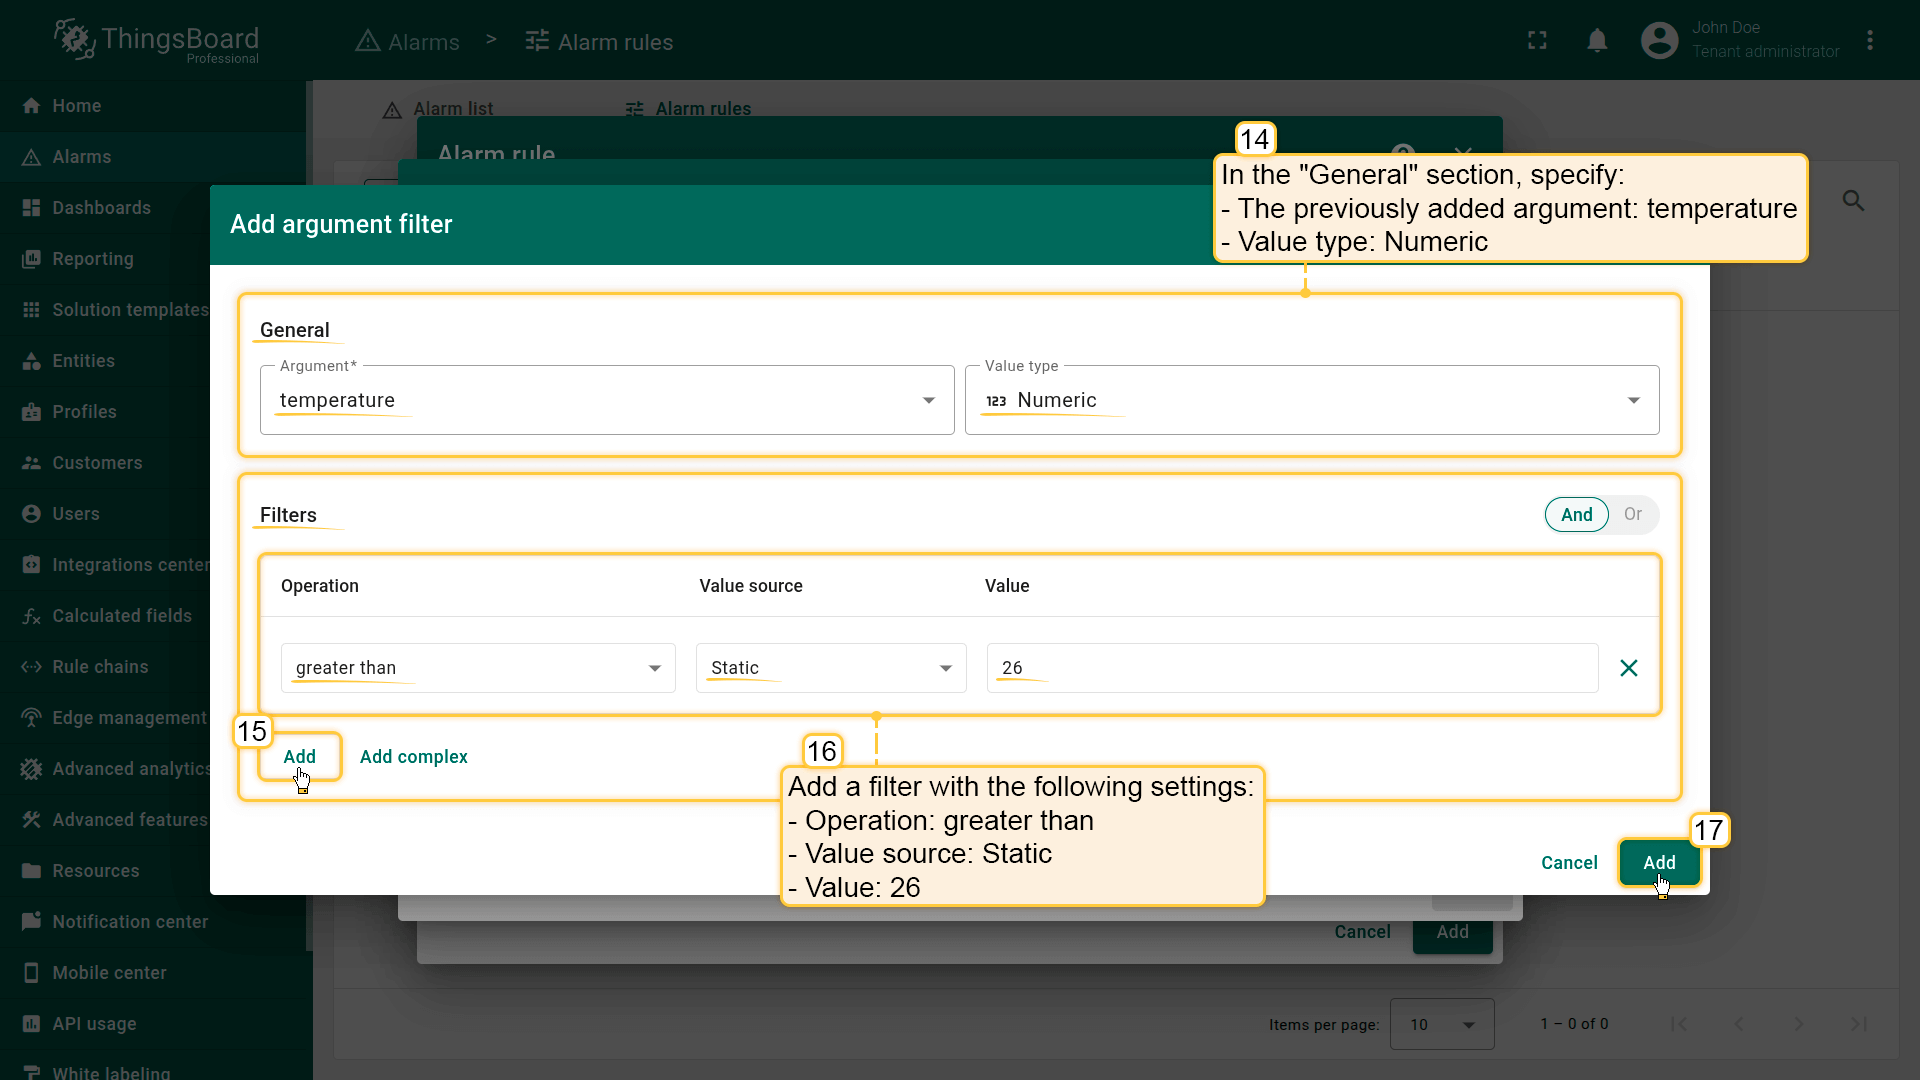
Filters: Click Add new filter (15): Operation (16): greater than; Value source: Static; Value: 26.
Click Add (17).
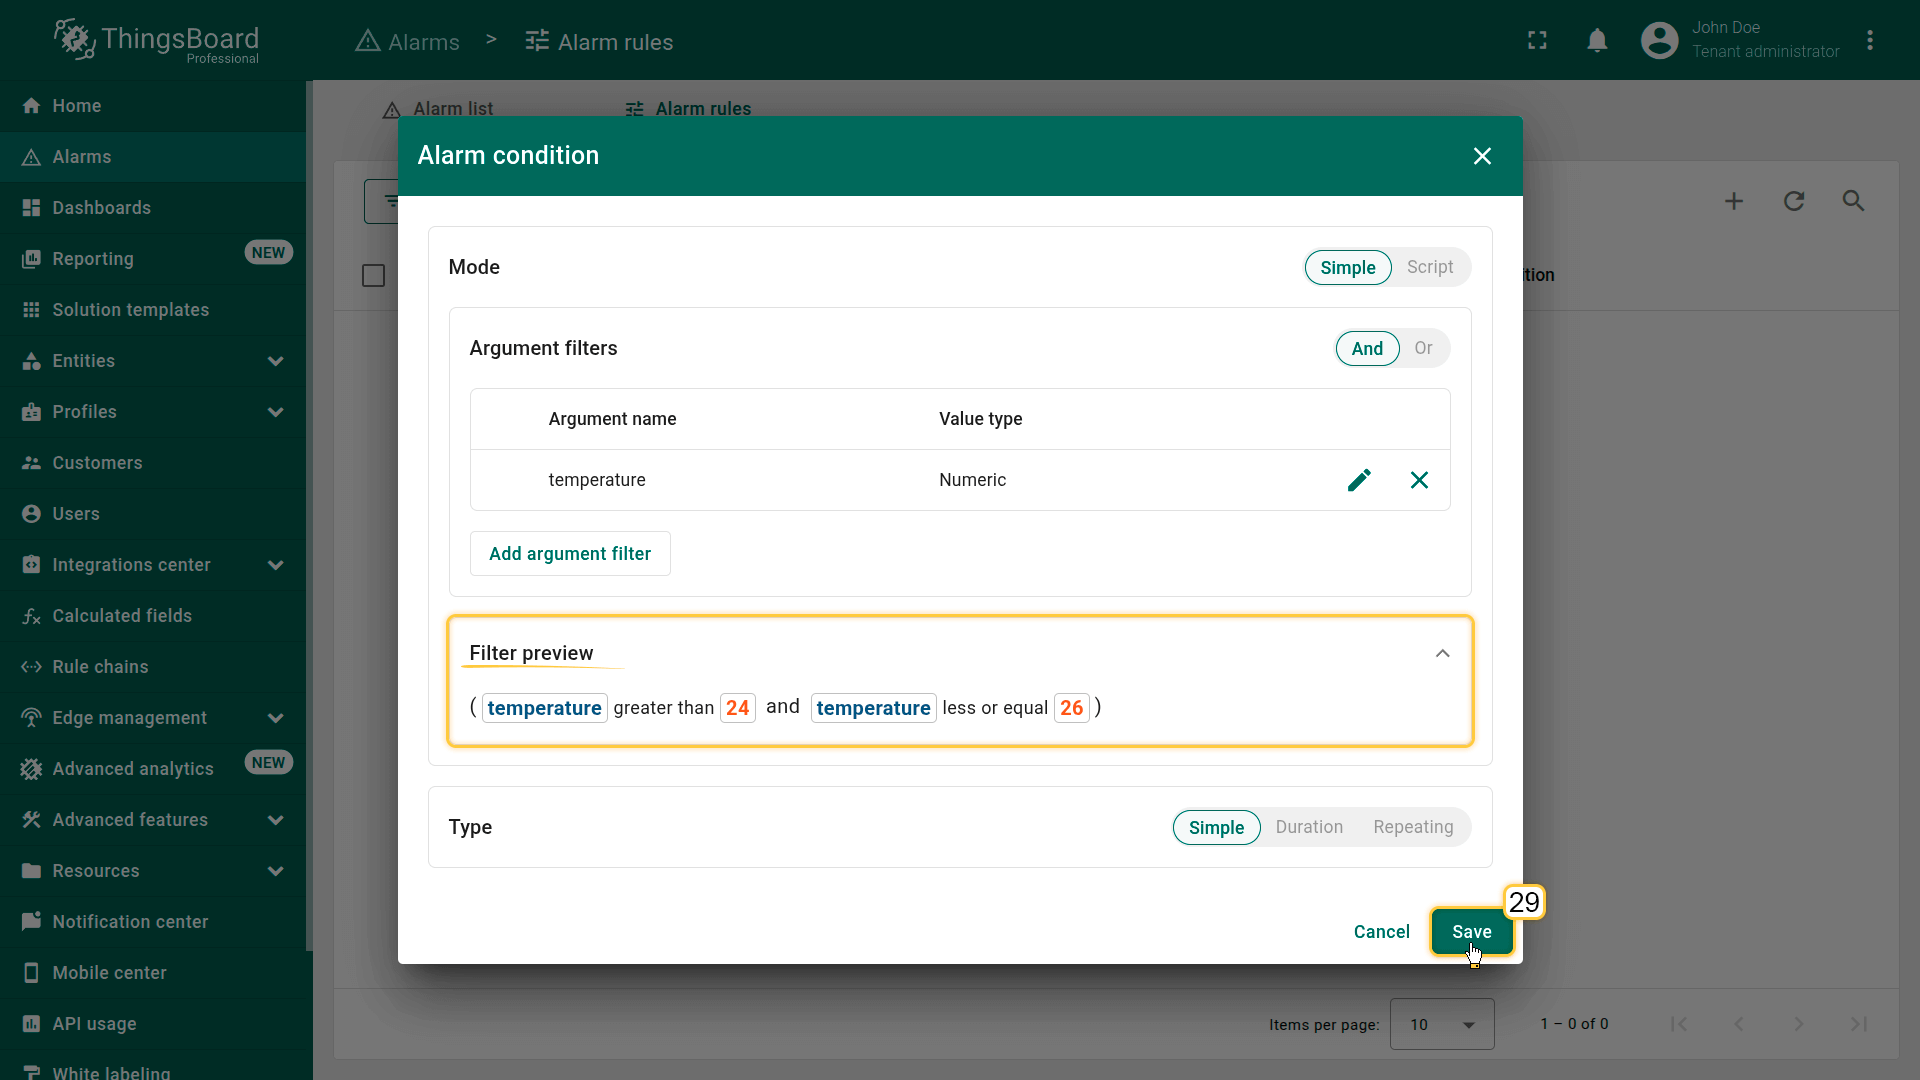
5. Add "Major" trigger condition
Add an alarm trigger condition with “Major” severity that is activated when the temperature is between 24 °C and 26 °C, inclusive.
Click Add create condition.
- Severity: Major
- Condition
- Click Add condition.
- In the configuration window, click Add argument filter and specify:
- General block:
- Argument: temperature
- Value type: Numeric
- Filters block:
- Click Add filter:
- Operation: greater than
- Value source: Static
- Value: 24
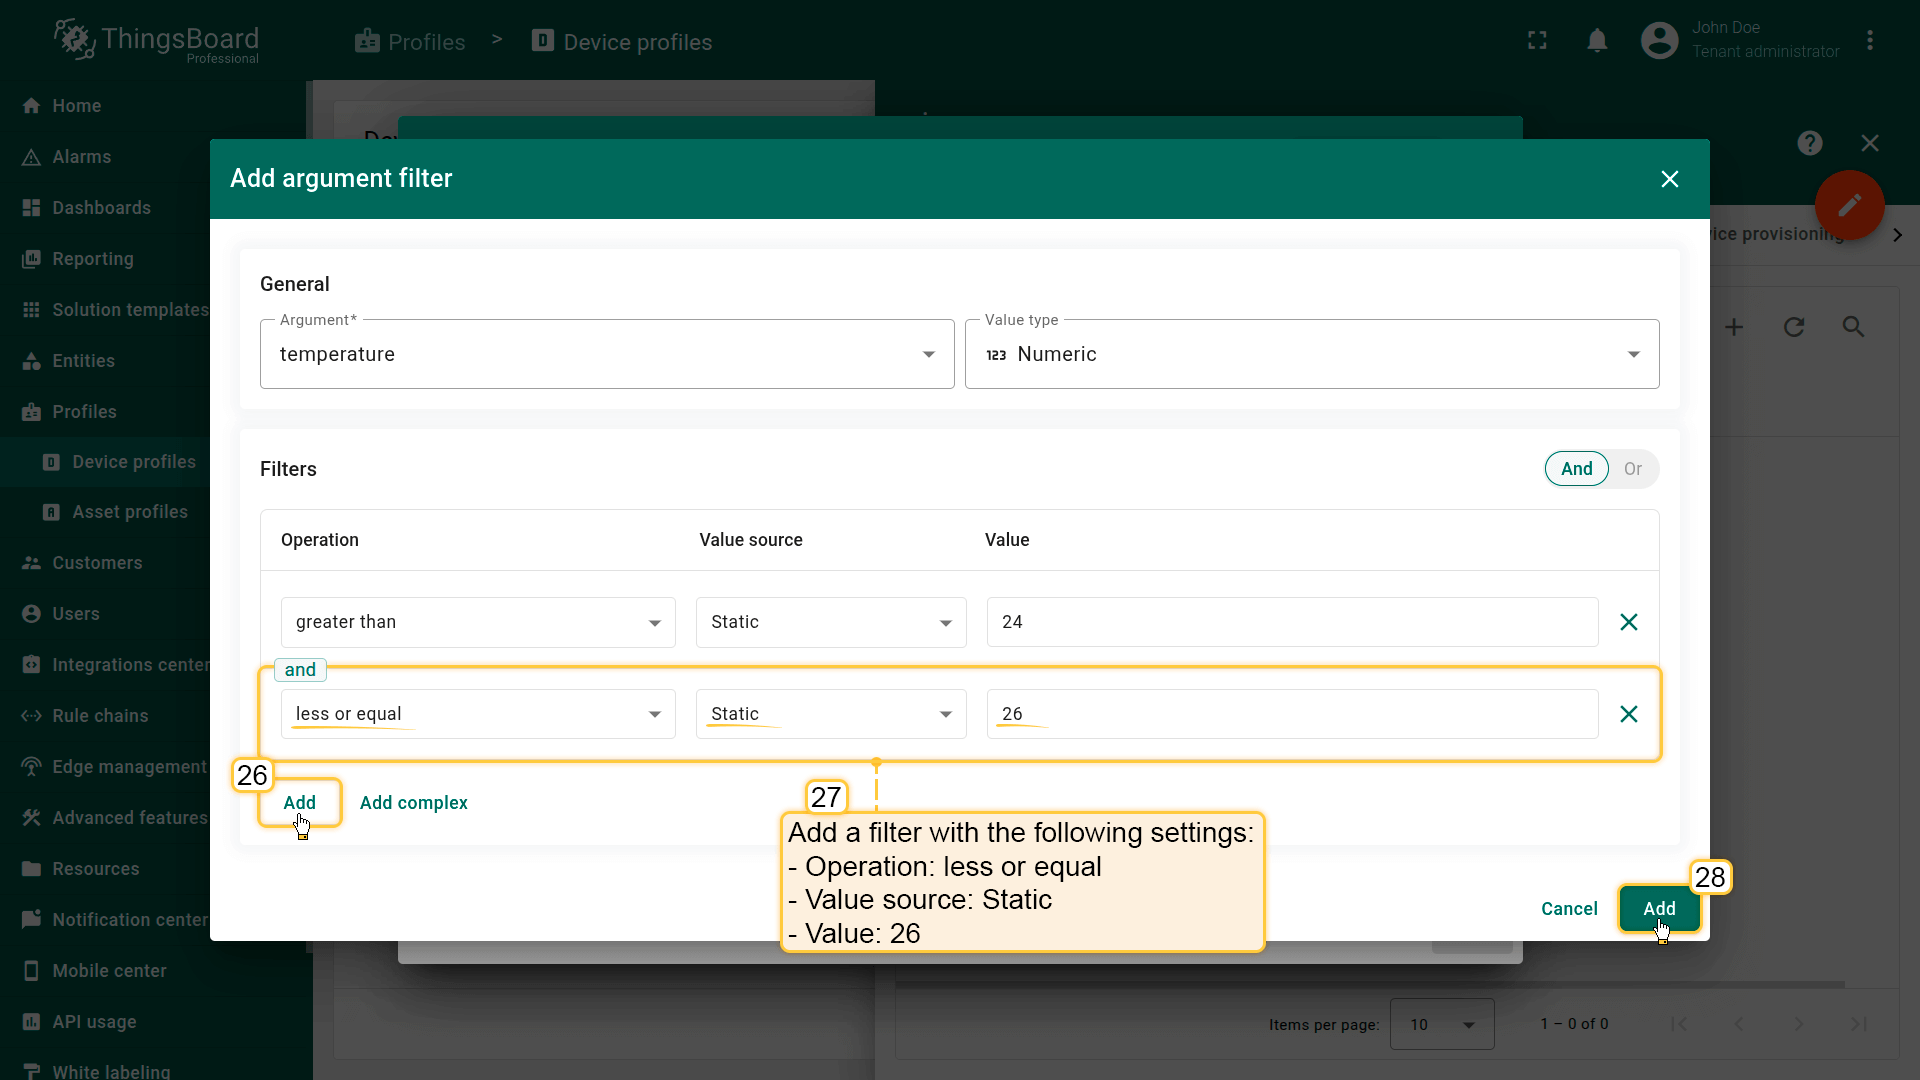
- Add another condition. Click Add
- Operation: less or equal
- Value source: Static
- Value: 26
- Click Add filter:
- Click Add.
- General block:
- Click Save.

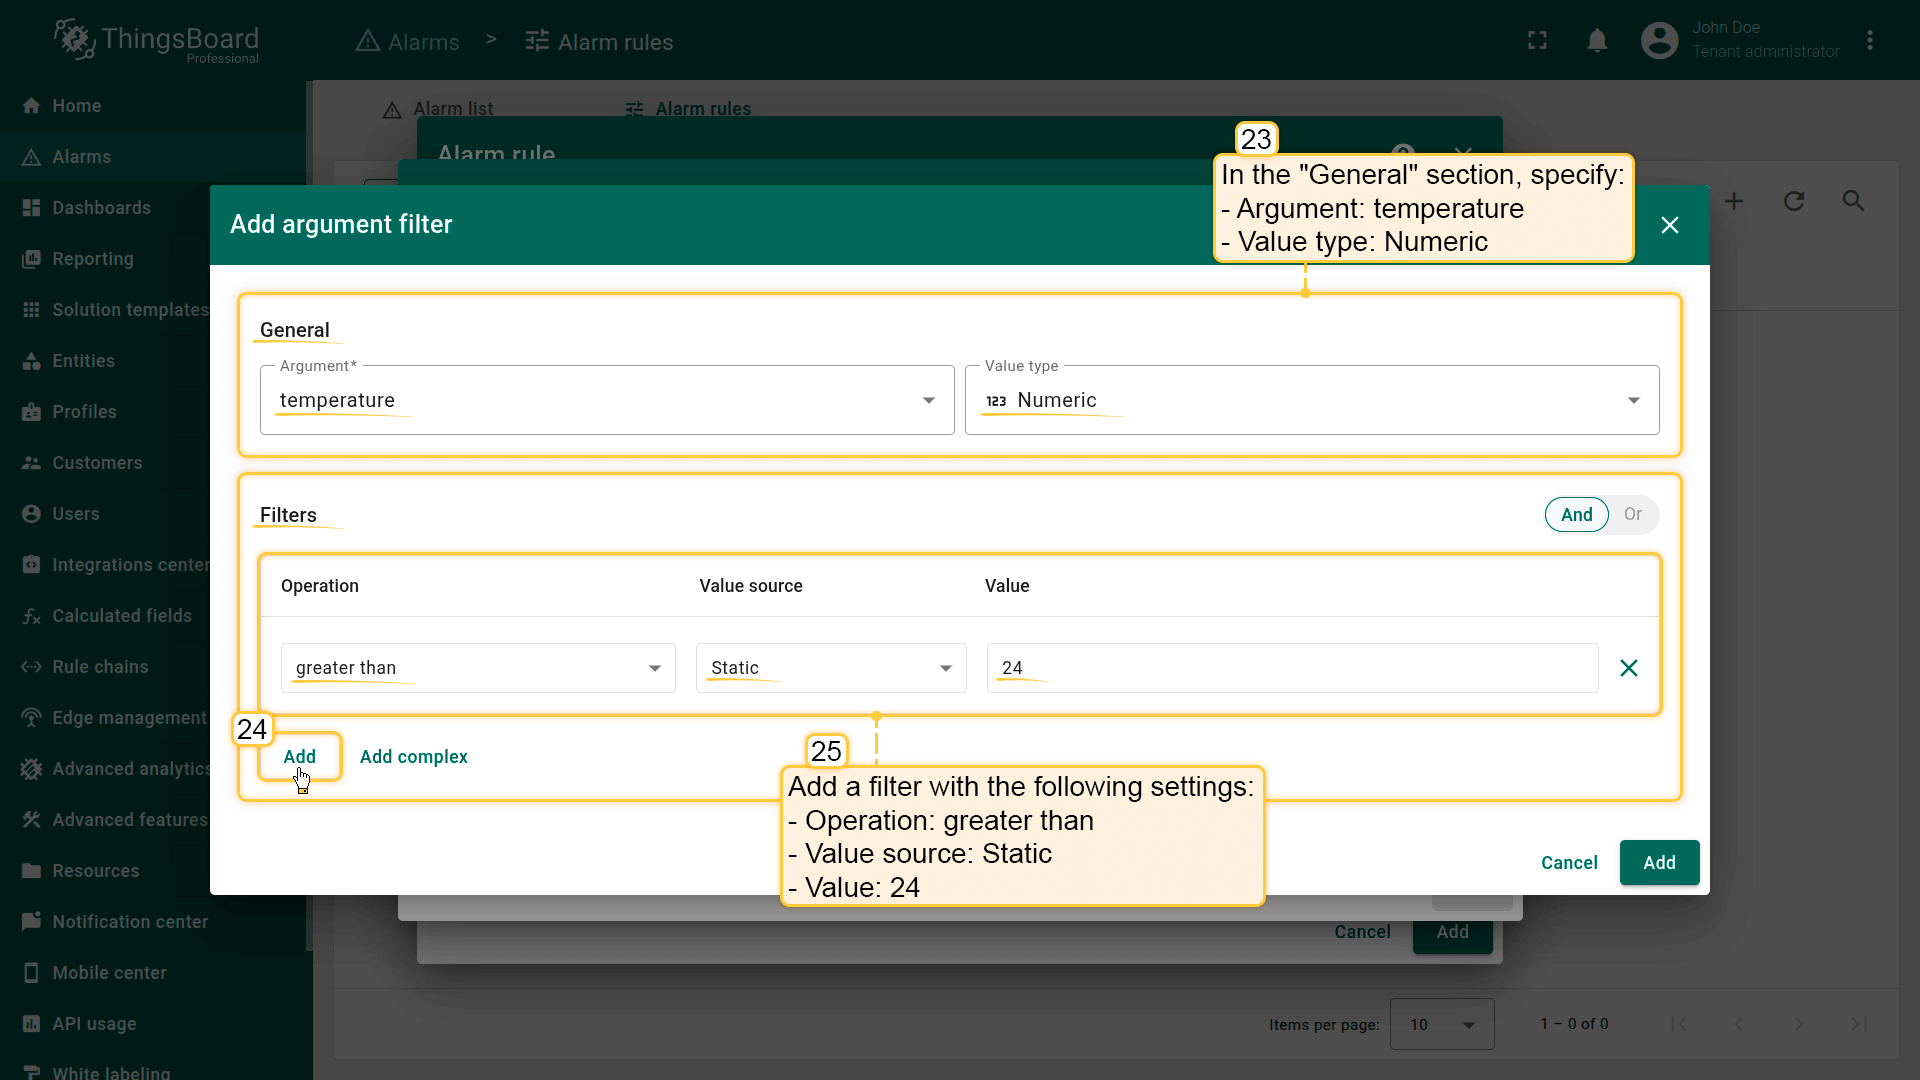
Filters: Click Add filter (24): Operation (25): greater than; Value source: Static; Value: 24.
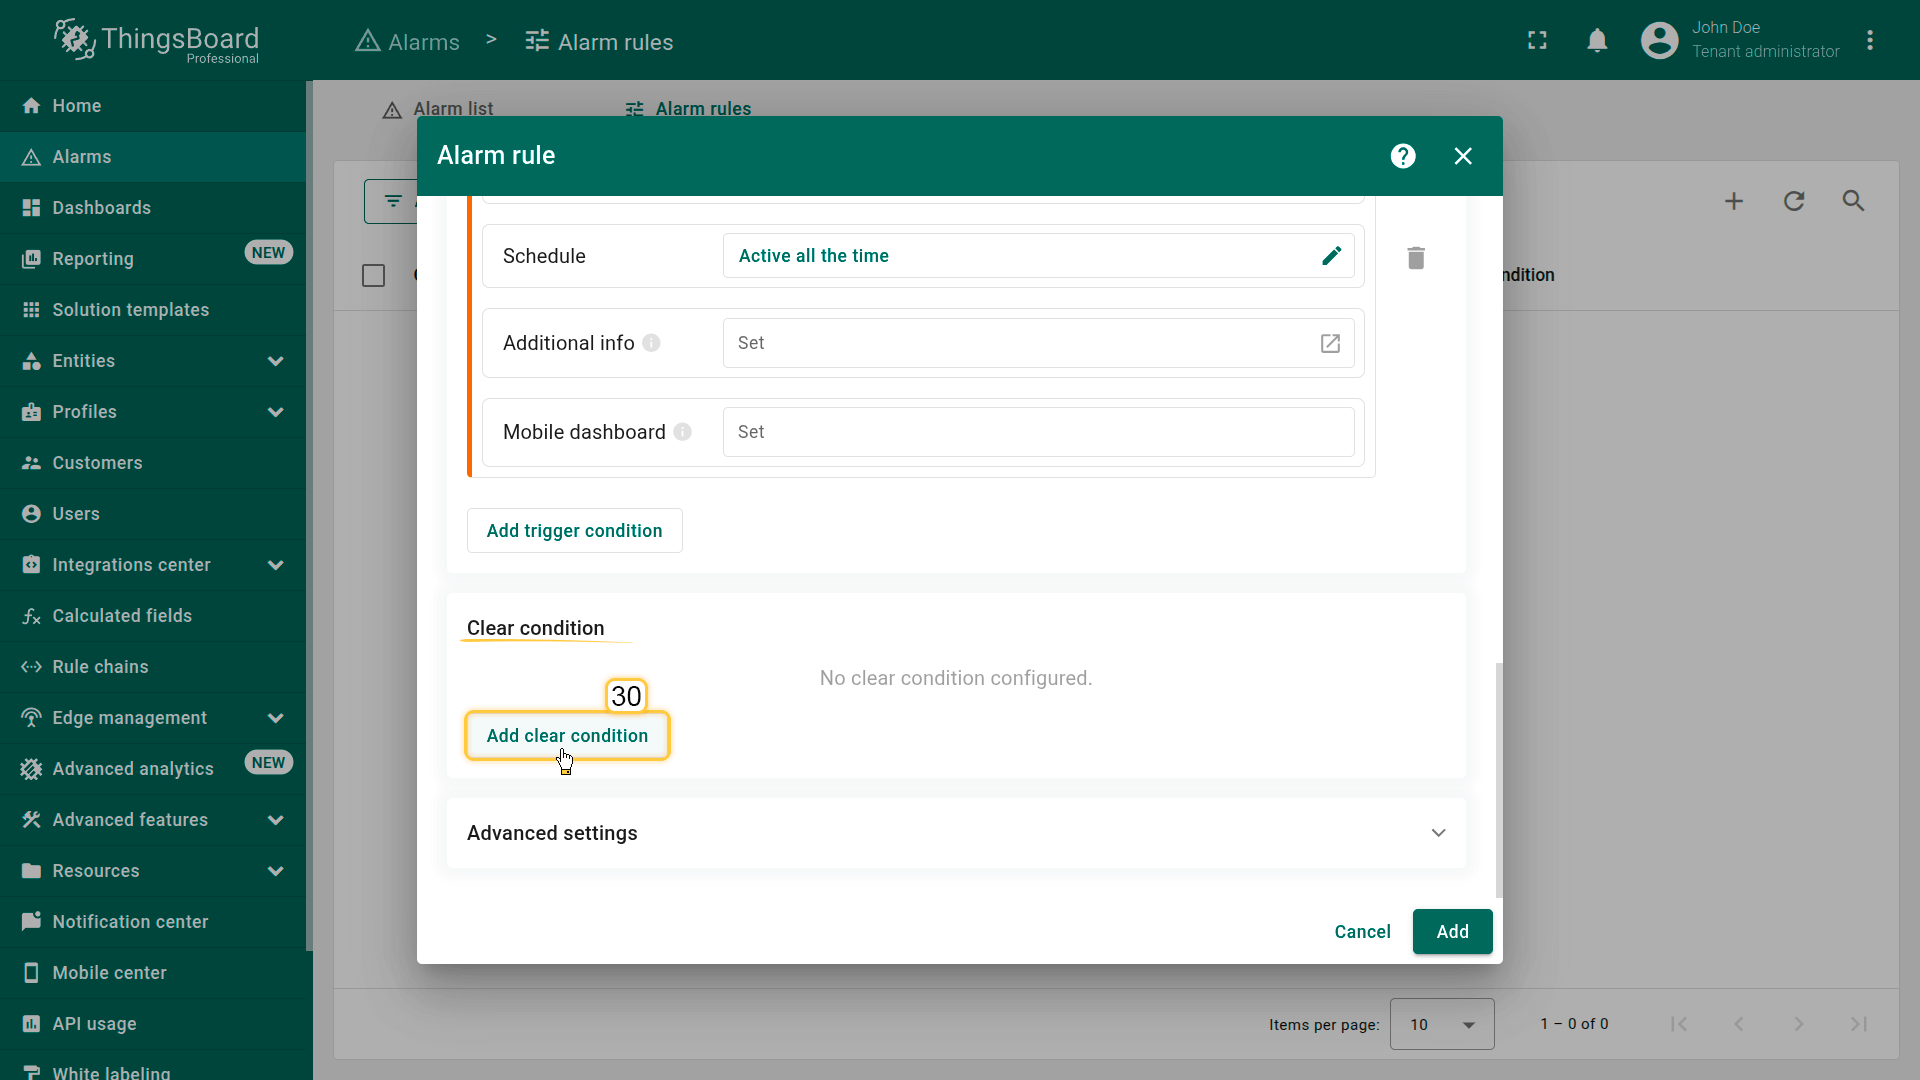
6. Add alarm clearing condition
Add an automatic alarm clear condition that is triggered when the temperature drops below 24 °C.
Click Add clearing condition.
- Severity: Major
- Condition
- Click Add clearing condition.
- In the configuration window, click Add argument filter and specify:
- General block:
- Argument: temperature
- Value type: Numeric
- Filters block:
- Click Add:
- Operation: less or equal
- Value source: Static
- Value: 24
- Click Add:
- Click Add.
- General block:
- Click Save.


Filters: Click Add new filter (34): Operation (35): less or equal; Value source: Static; Value: 24.
Click Add (36).

7. Propagate alarm to related entities and save the rule
- Enable Propagate alarm to related entities in the advanced settings to automatically propagate the alarm to the asset and then to the building linked to this device.
Set Relation type to “Contains”. - Click Add to save the rule configuration.
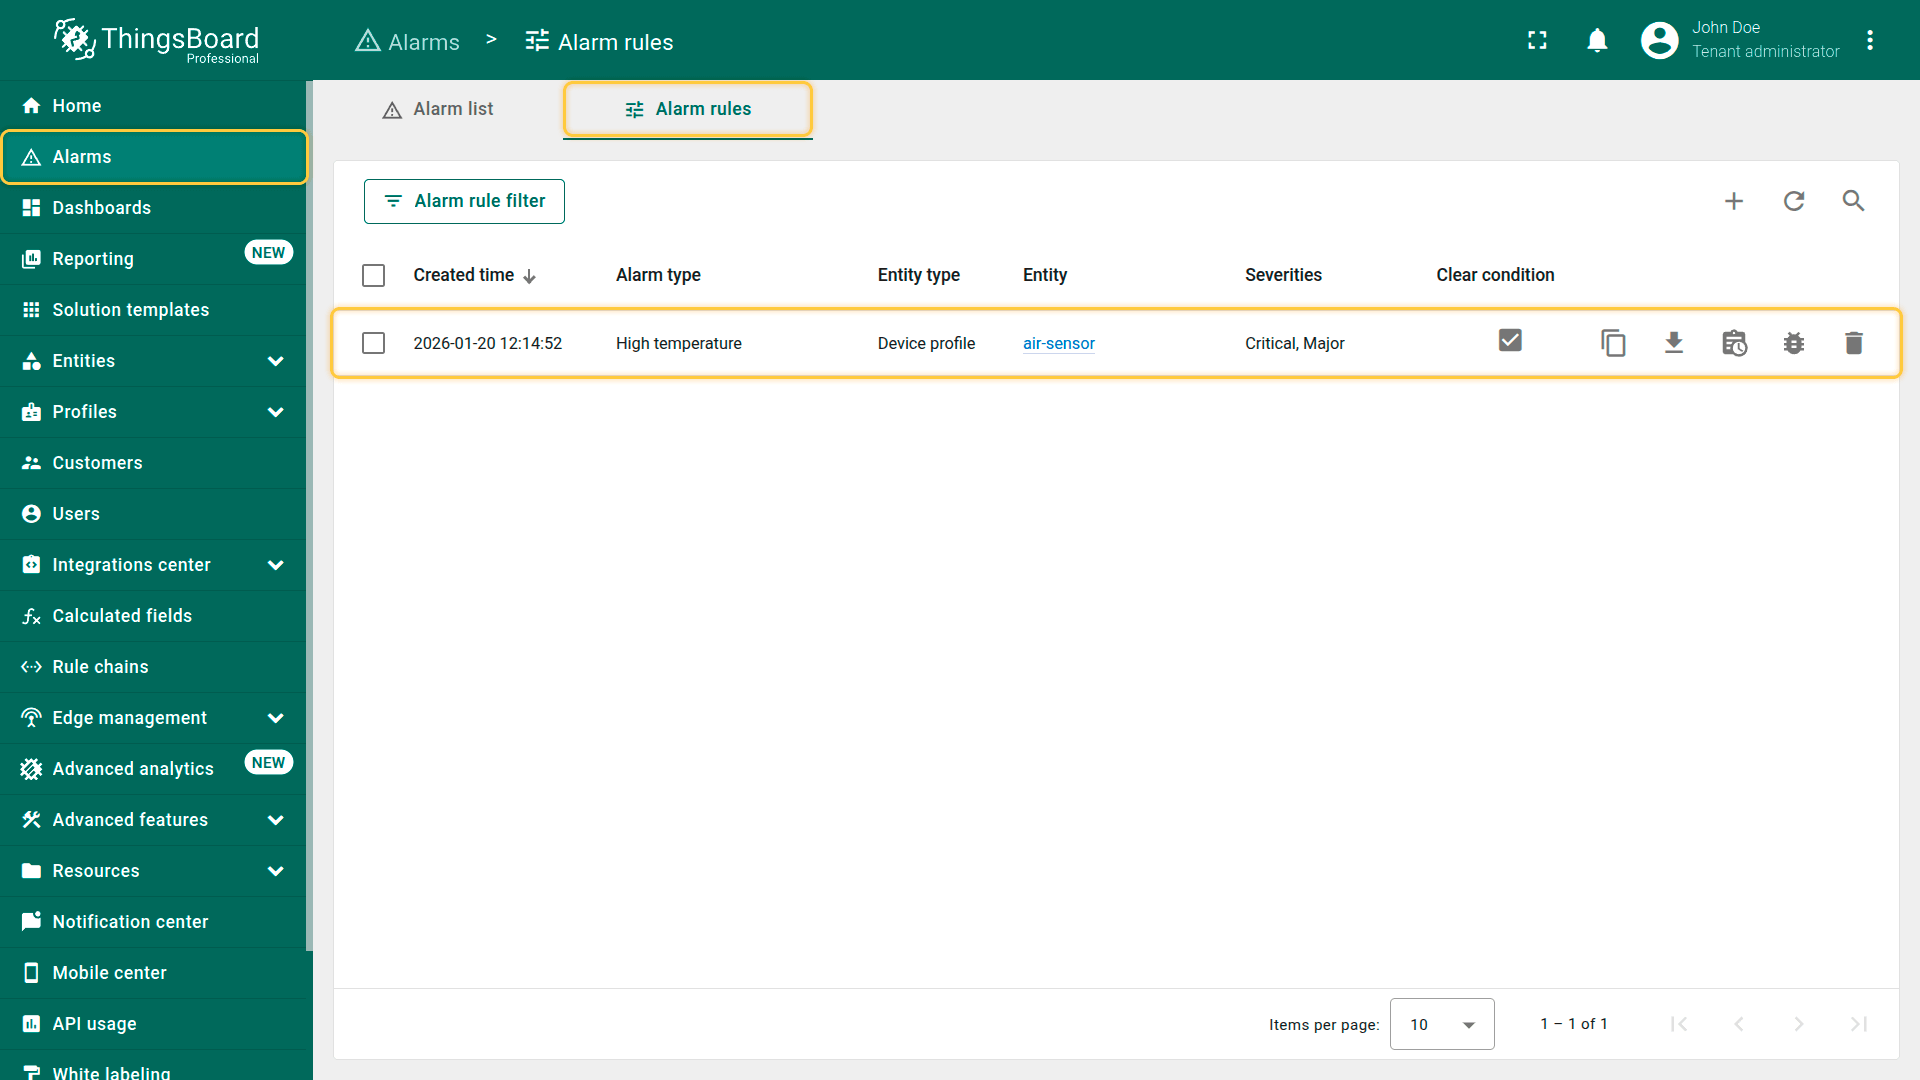
The High temperature alarm rule will be created and activated.
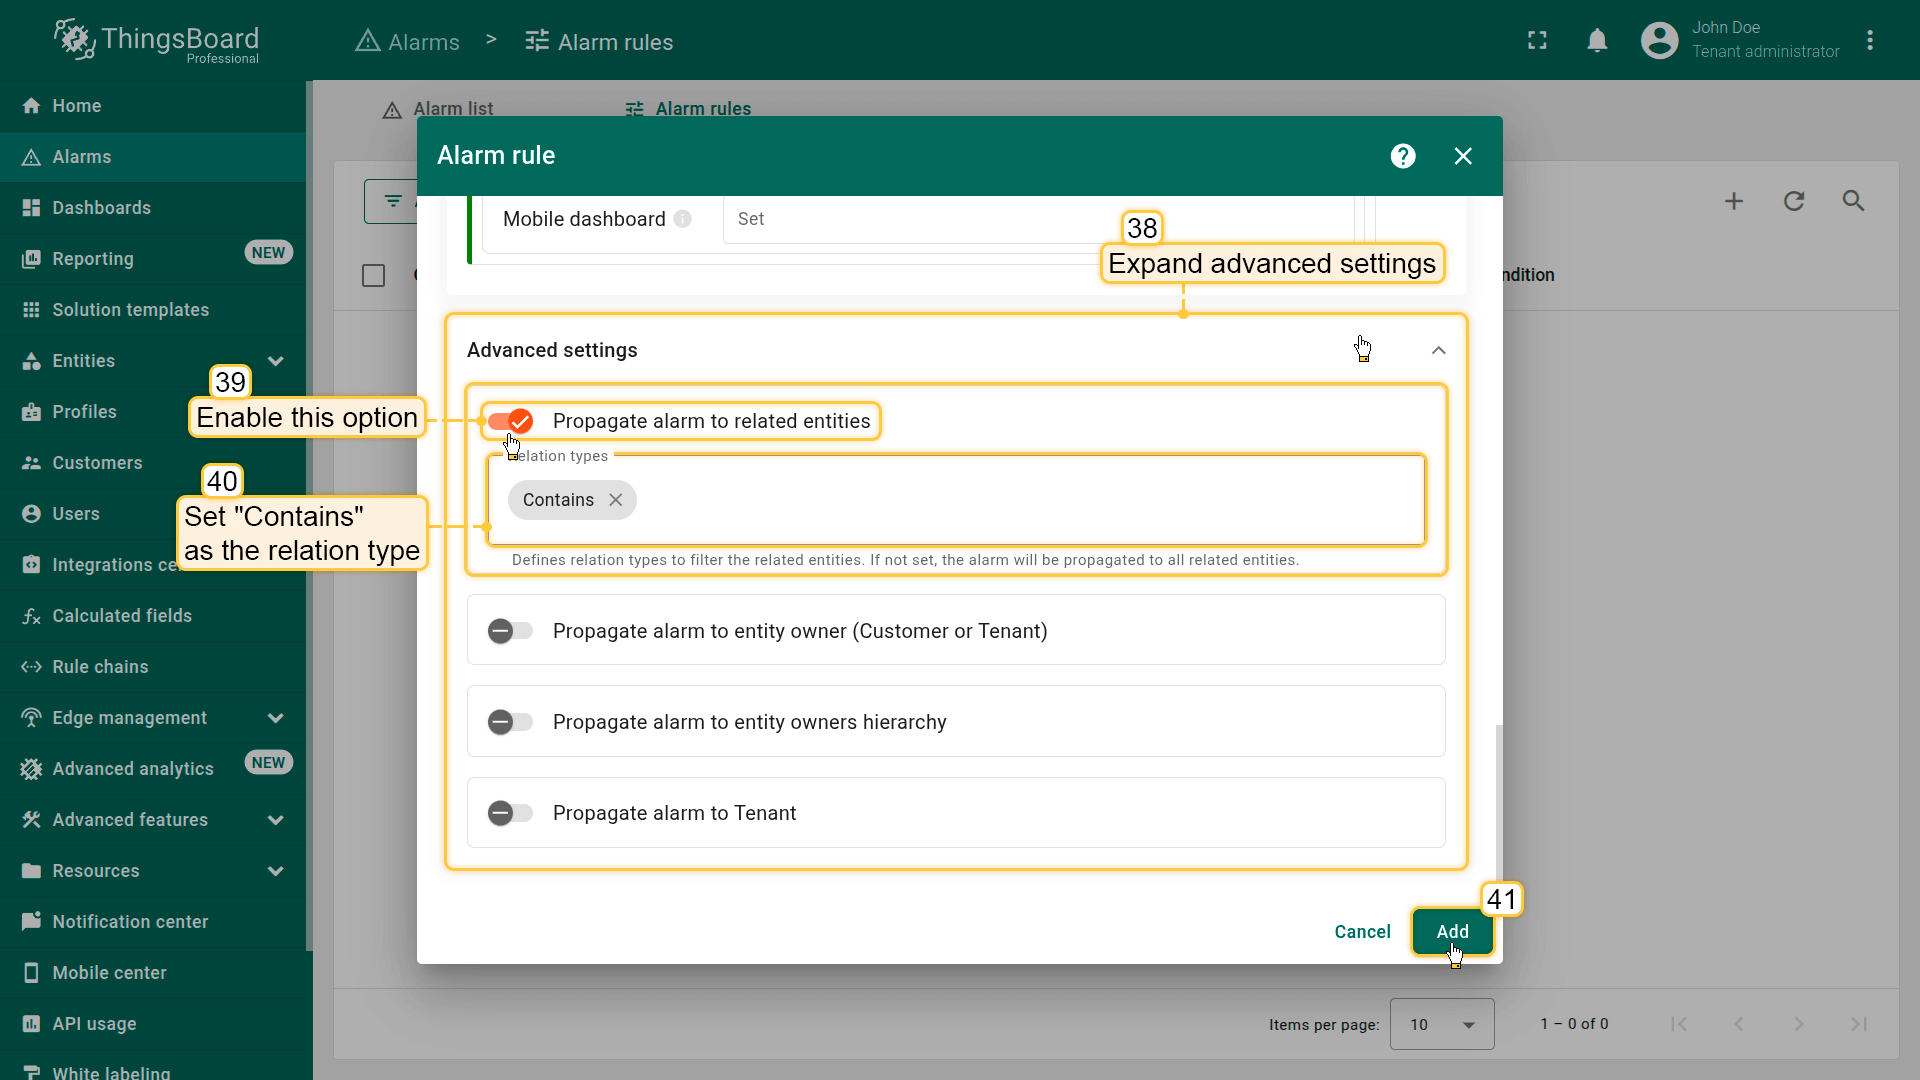
- Enable the Propagate alarm to related entities option (39), and specify the Relation type used in the device–asset relation: Contains (40).
Finally, click the Add (41).
You can download a JSON configuration file containing predefined high-temperature alarm rules and import it into your ThingsBoard instance.
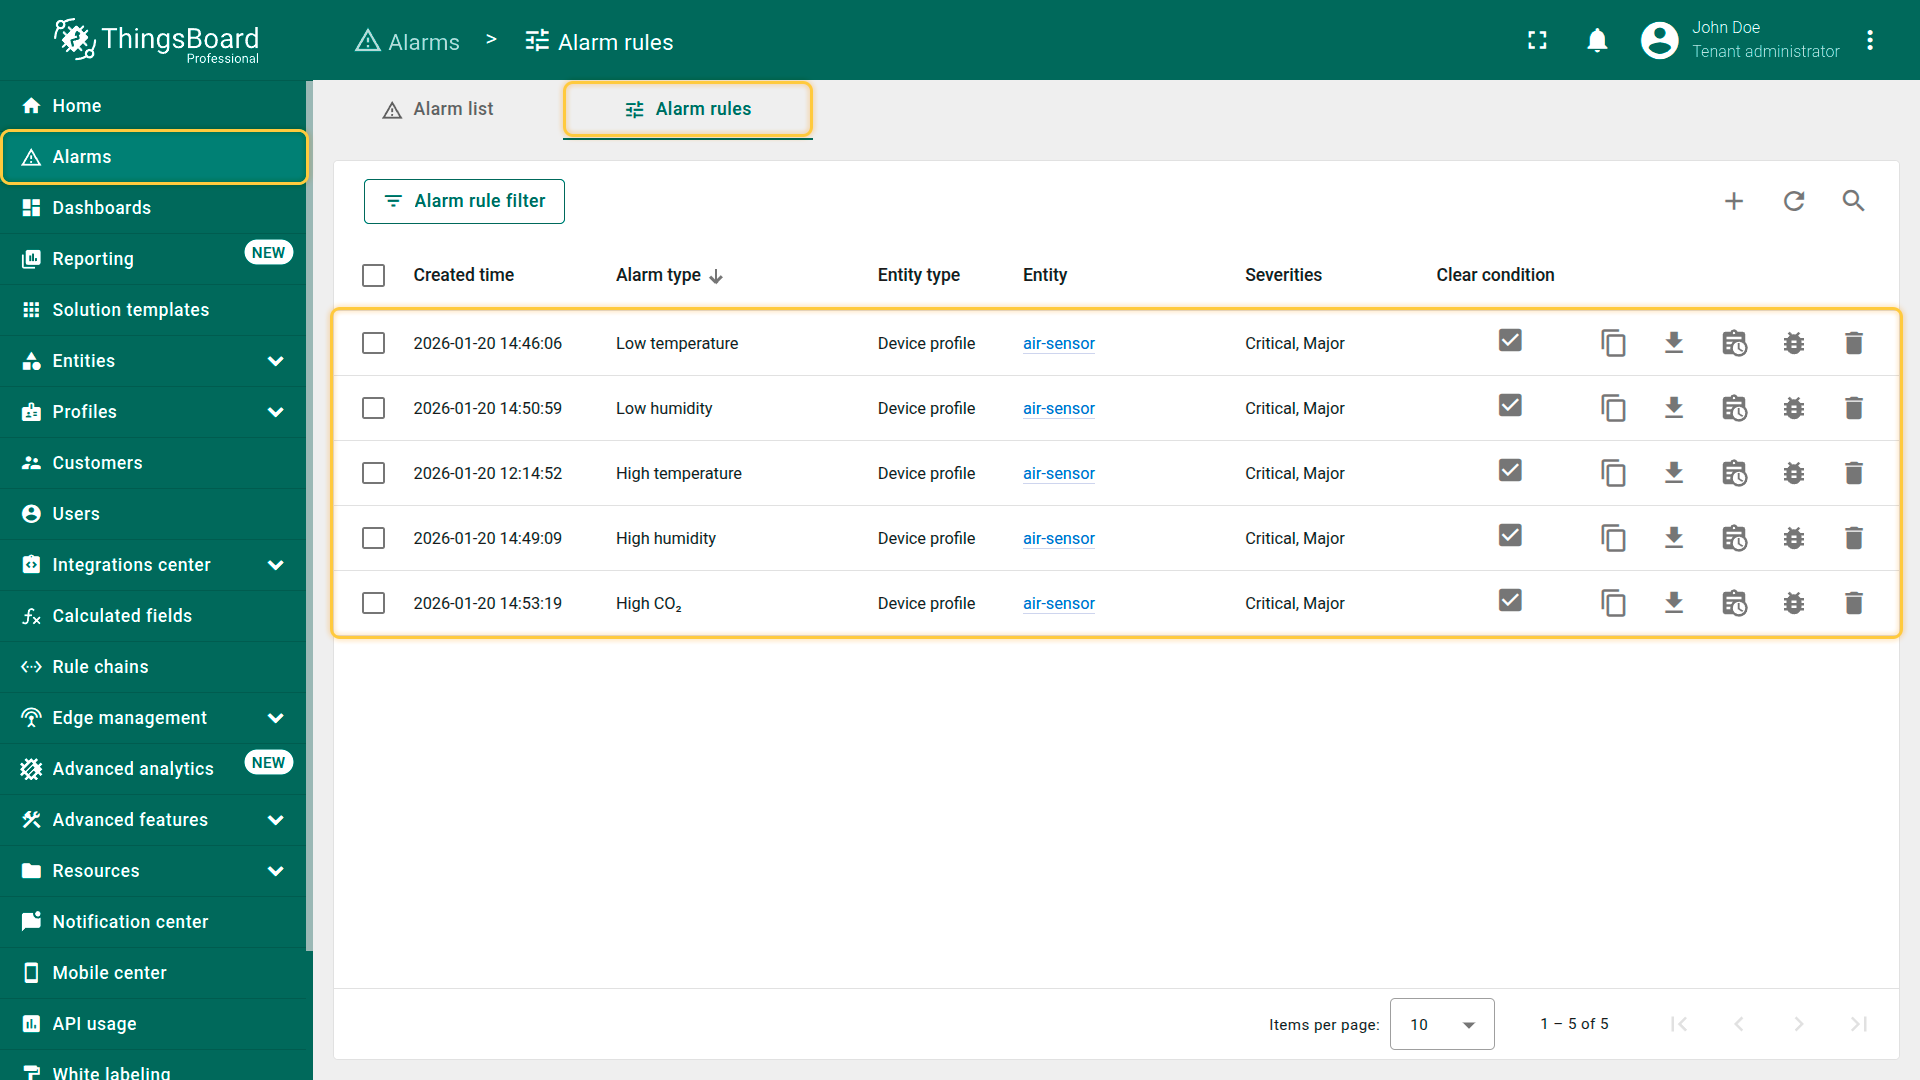
Creating additional alarm rules
Using the same approach, configure the remaining alarm rules on your own.
⚠️ Alternatively, you can download the preconfigured alarm rule configurations and import them into your ThingsBoard instance.
Make sure to set the “air-sensor” device profile as the target entity of the alarm rule.
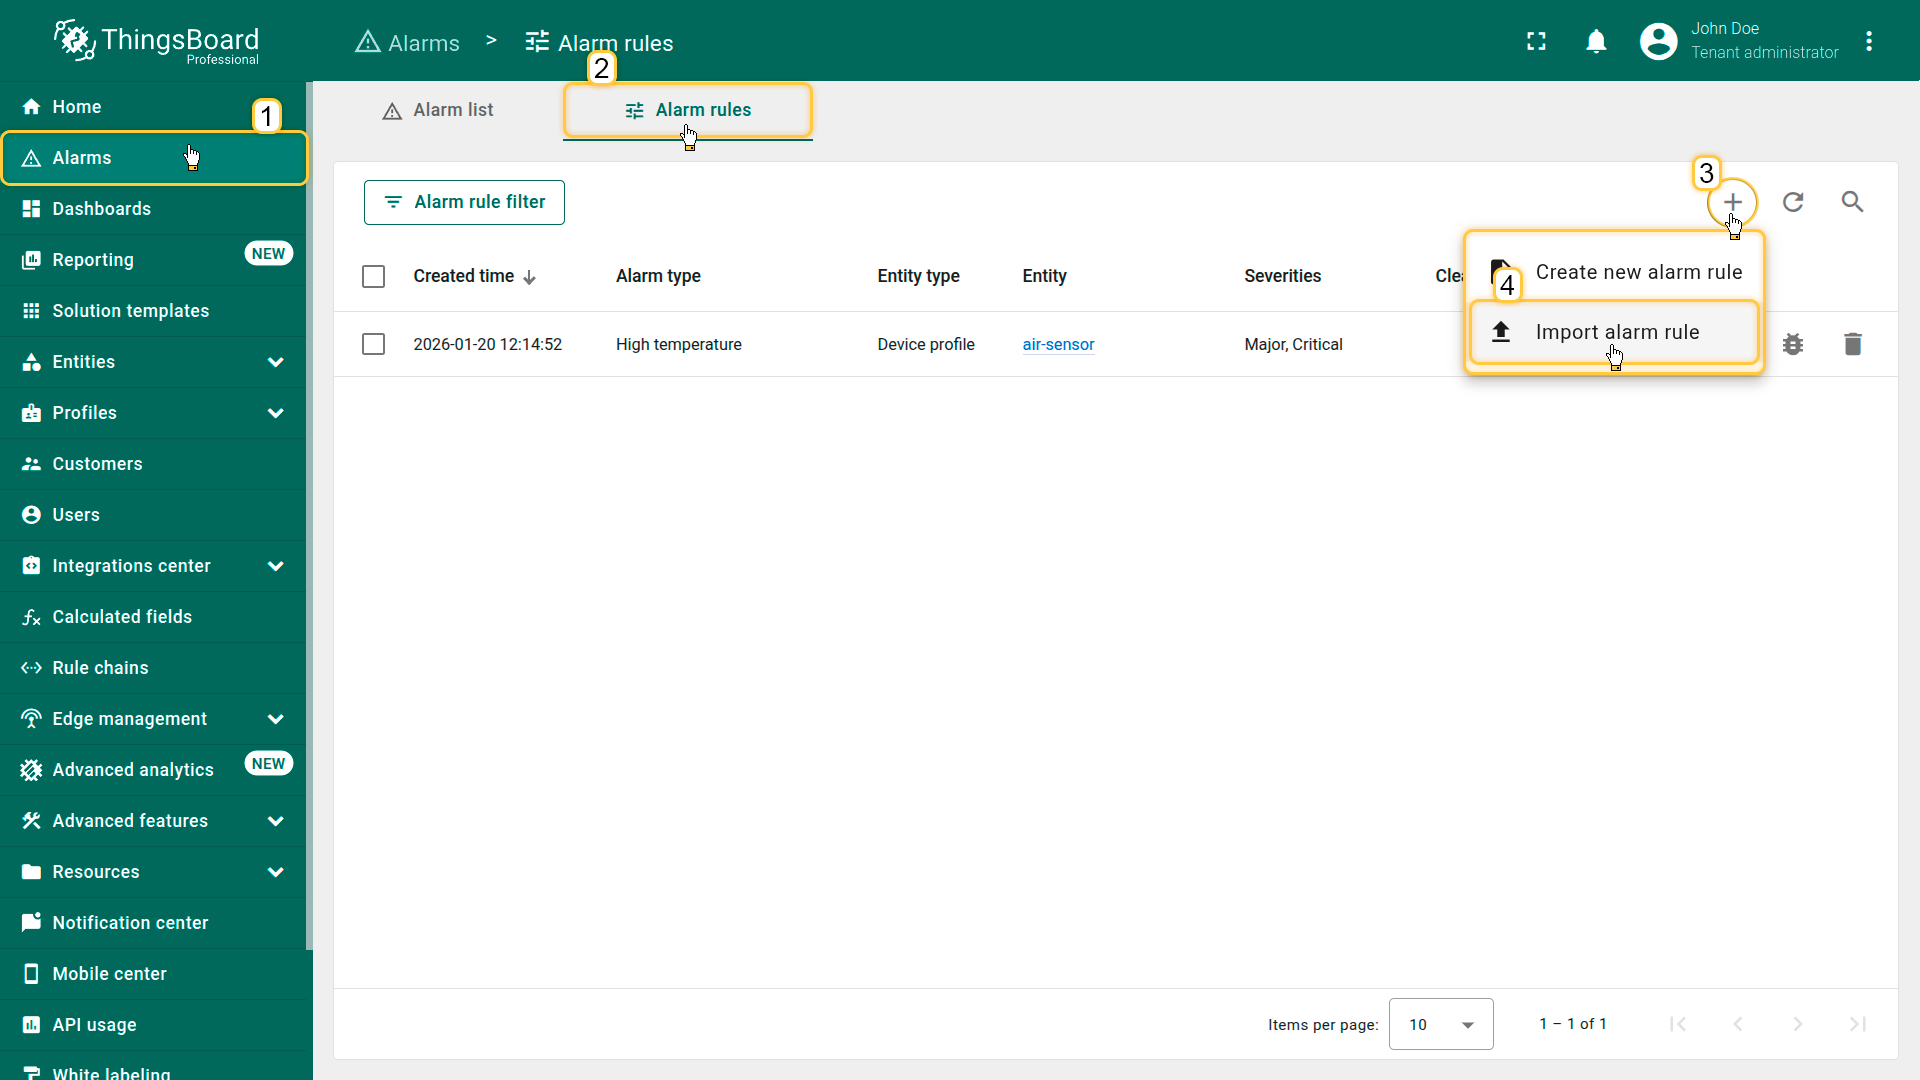
- Click the "+" button in the top-right corner, and select Import alarm rule from the dropdown menu.
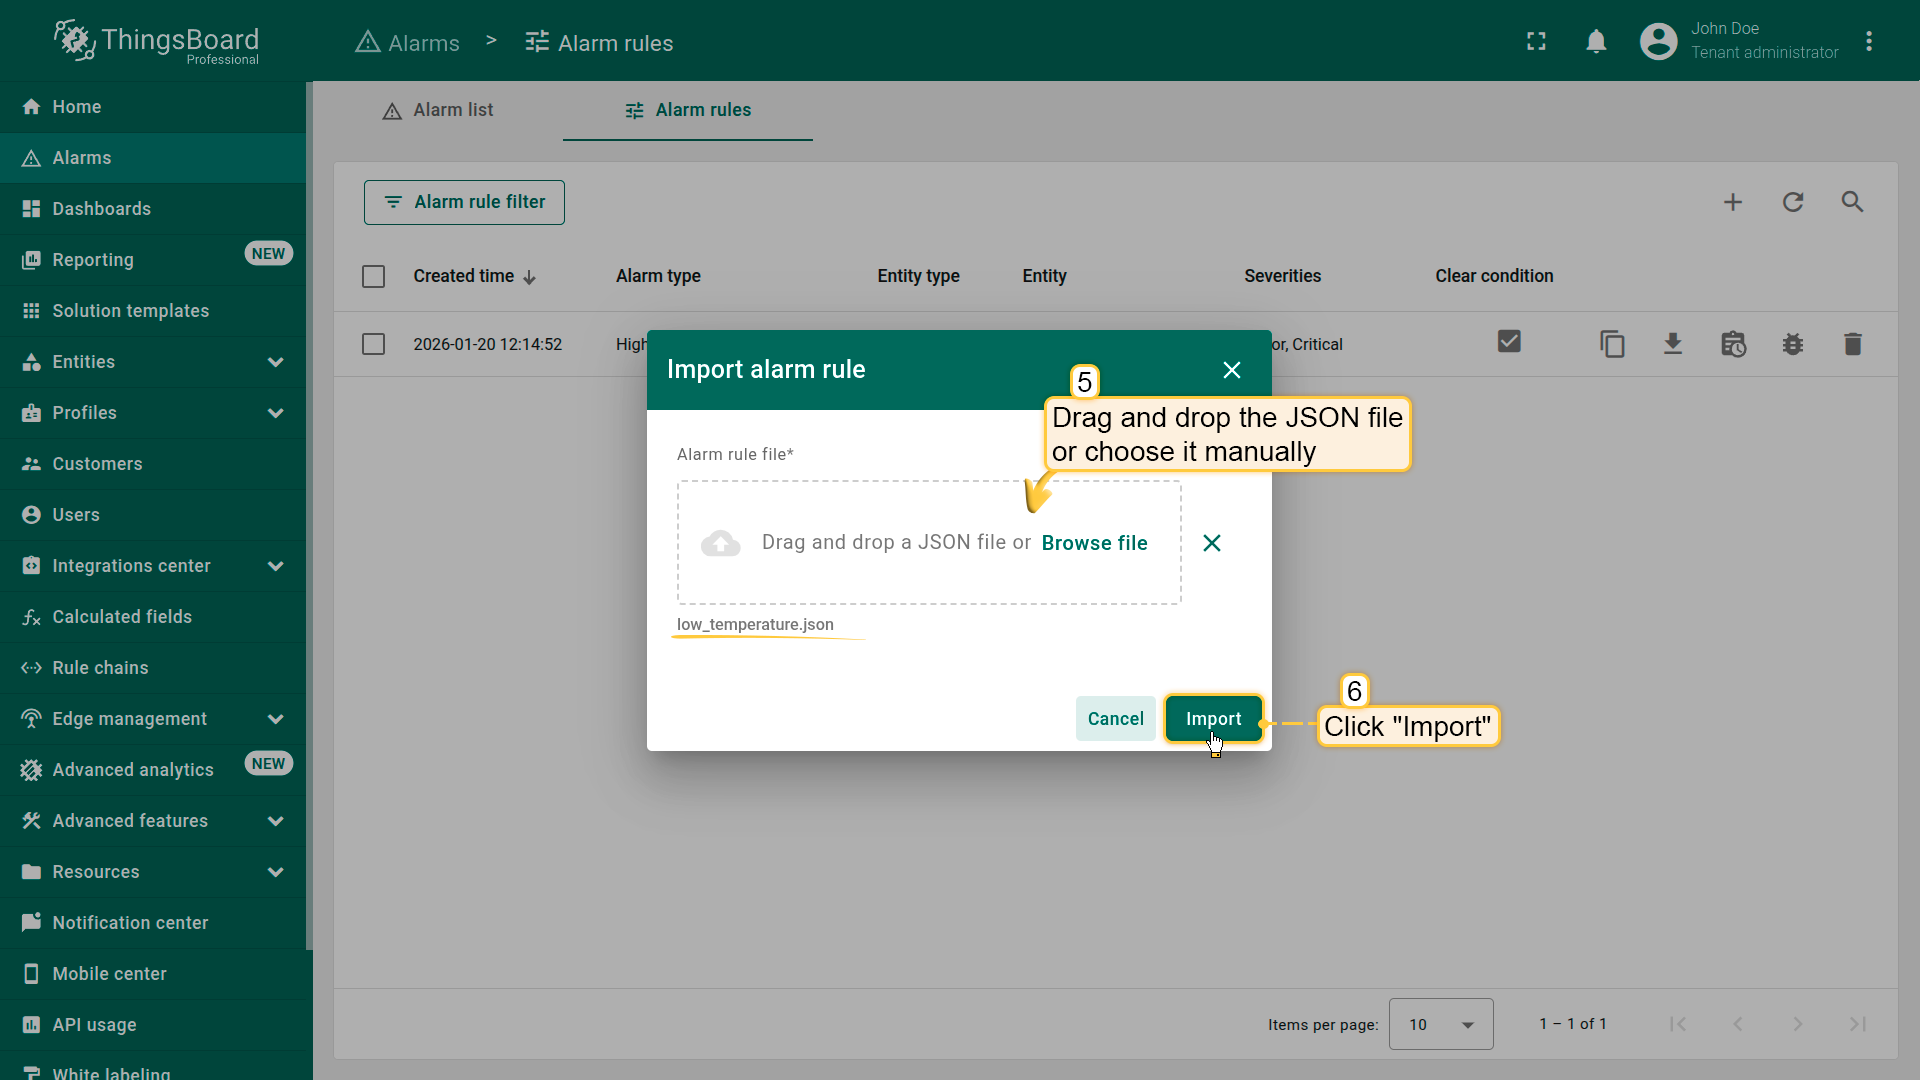
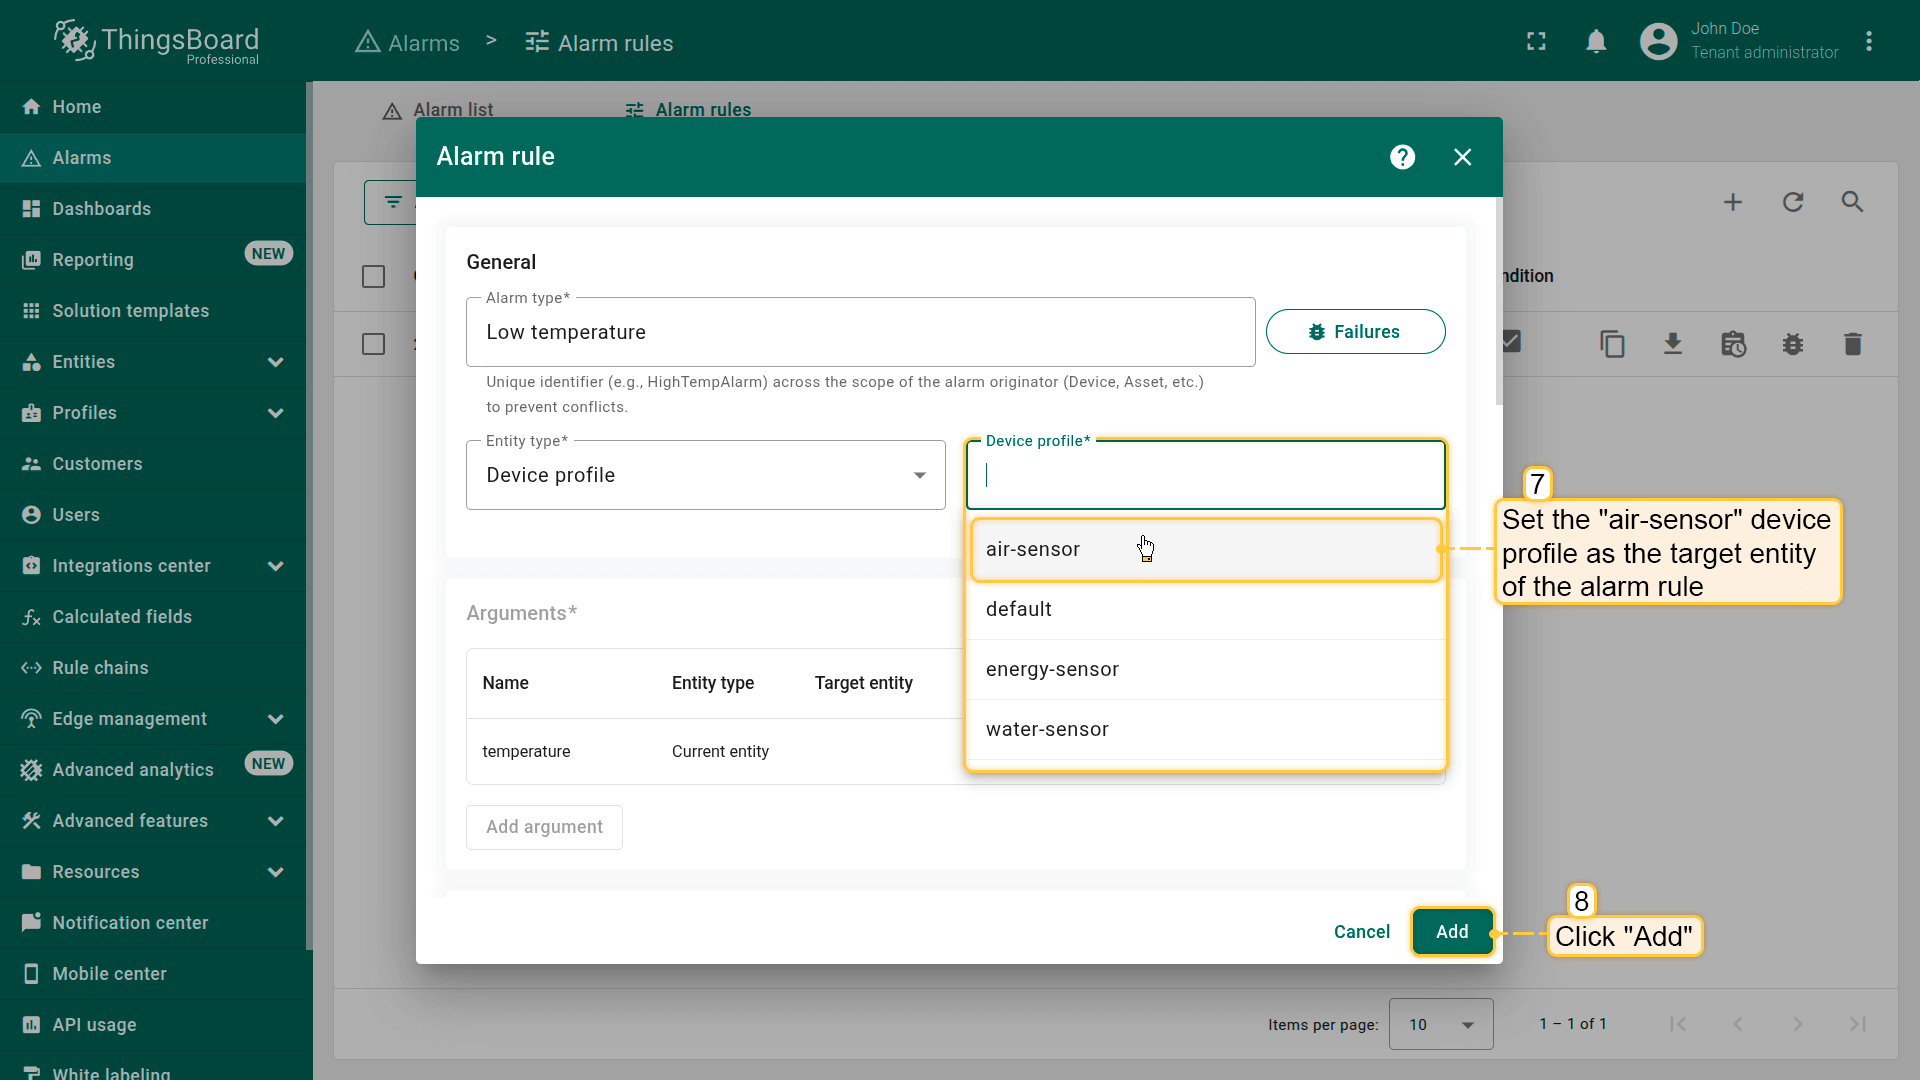
Finally, click Add to save the rule.
Low temperature
Click to download the “Low temperature” alarm rule configuration (JSON).
Configuration:
– Alarm creation:
– If the temperature drops below 20 °C but not below 18 °C (inclusive), an alarm of the severity type “Major” will be created.
– If the temperature drops below 18 °C, an alarm of the severity type “Critical” will be created.
– Alarm clearing:
– When the temperature rises above 20 °C, the alarm will be cleared.
High humidity
Click to download the “High humidity” alarm rule configuration (JSON).
Configuration:
– Alarm creation:
– An alarm with severity type “Major” will be created if humidity rises above 60 % but does not exceed 65 % (inclusive).
– An alarm with severity type “Critical” will be created if humidity exceeds 65 %.
– Alarm clearing:
– The alarm will clear when humidity drops below 60 %.
Low humidity
Click to download the “Low humidity” alarm rule configuration (JSON).
Configuration:
– Alarm creation:
– An alarm with severity type “Major” will be created if humidity drops below 40 % but does not fall below 35 % (inclusive).
– An alarm with severity type “Critical” will be created if humidity drops below 35 %.
– Alarm clearing:
– The alarm will clear when humidity rises above 40 %.
High CO₂ levels
Click to download the “High CO₂” alarm rule configuration (JSON).
Configuration:
– Alarm creation:
– If the CO₂ level is equal to or exceeds 490 ppm but does not exceed 500 ppm, the alarm with severity type “Major” will be created.
– If the CO₂ level exceeds 500 ppm, the alarm with severity type “Critical” will be triggered.
– Alarm clearing:
– The alarm will be cleared when the CO₂ level drops below 490 ppm.
Configuring alarm rules for the Energy Meter and Water Flow Meter devices is slightly more complex. This is because the alarm must be triggered not by a single value, but by the hourly sum of telemetry values. To achieve this, we will use Calculated fields feature for additional calculations. Alarm rule configuration for these devices is covered in the next lessons.
Now that we have defined all the alarm rules for the air-sensor device profile, the next step is to add a widget to manage the alarms.
Adding alarms table widget
Displaying alarms in a user-friendly format is essential for monitoring and managing them effectively. The “Alarms table” widget in ThingsBoard provides a customizable interface for easy monitoring and interaction with alarms.
Steps to add the “Alarm table” widget:
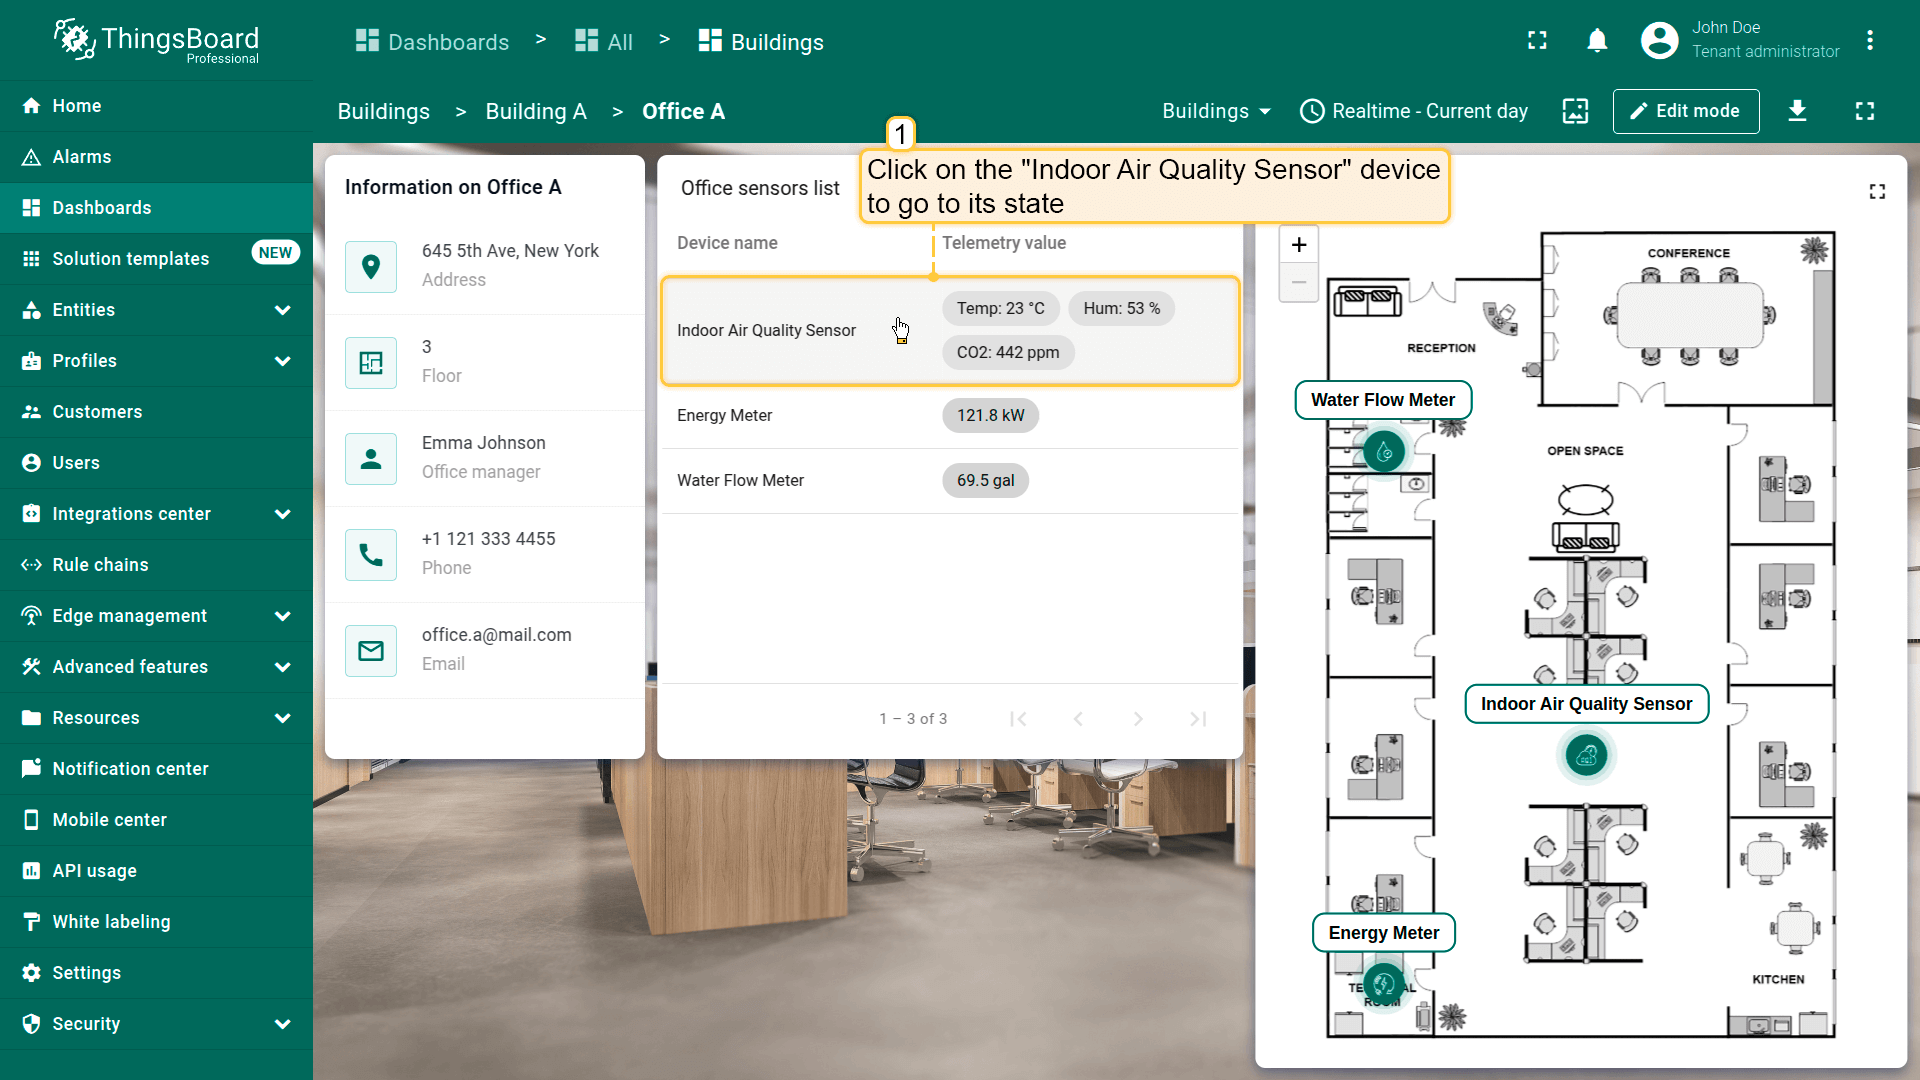
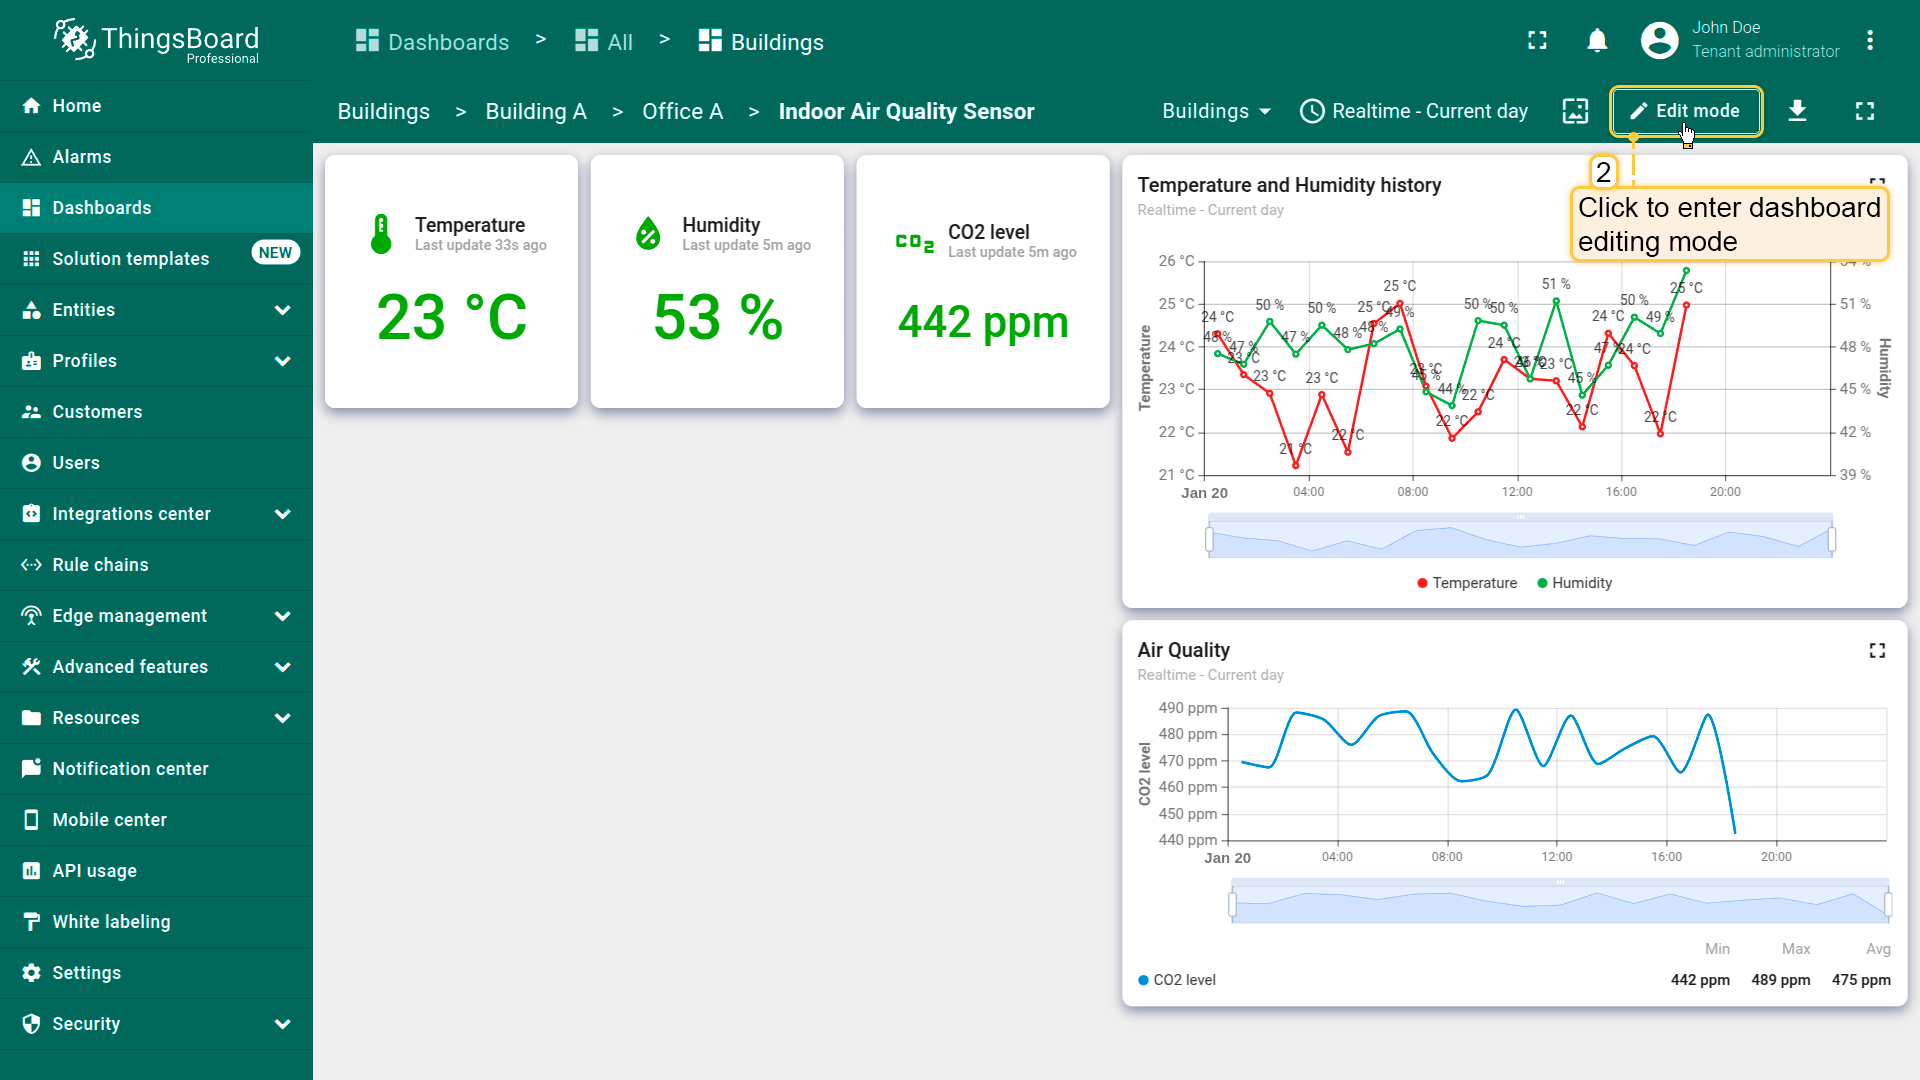
- Click on the "Indoor Air Quality Sensor" device row in the "Office sensors list" widget to transition to its state;
- Enter dashboard editing mode;
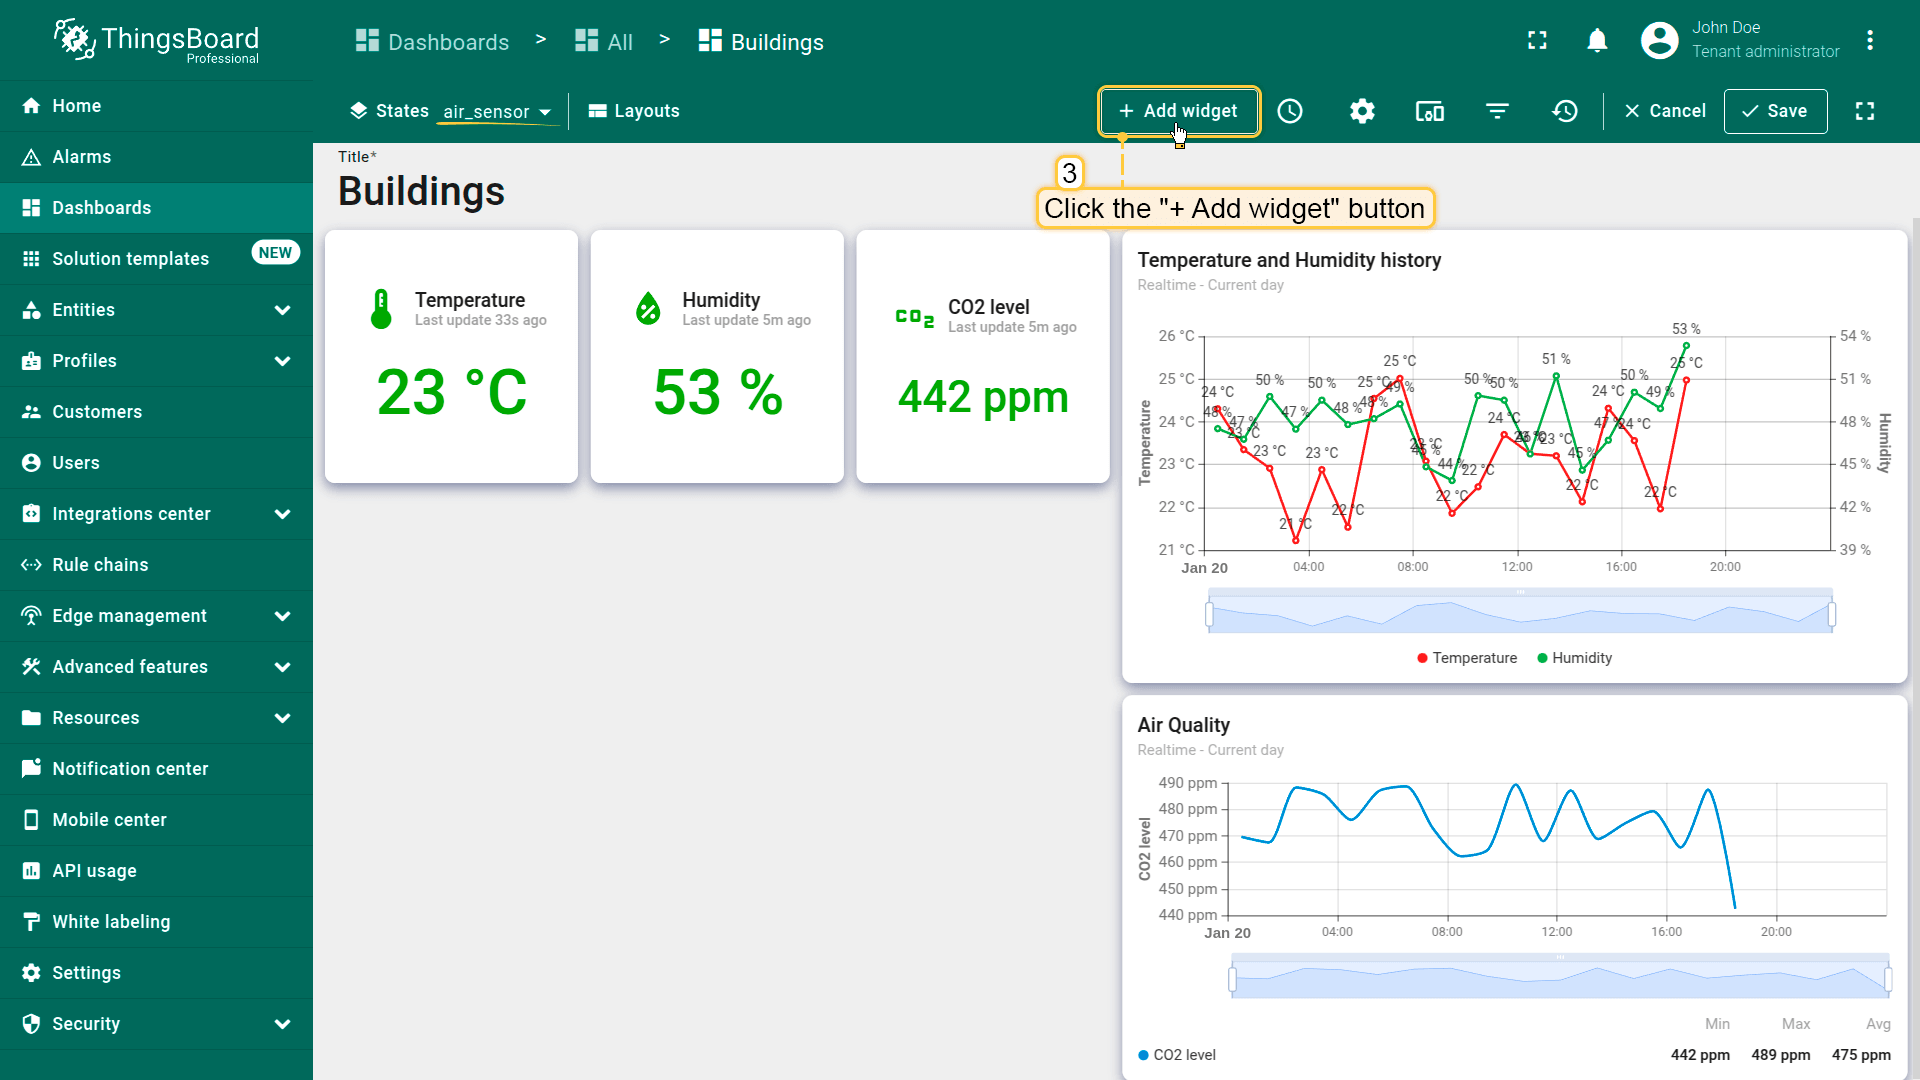
- Click the "+ Add widget" button at the top of the screen;
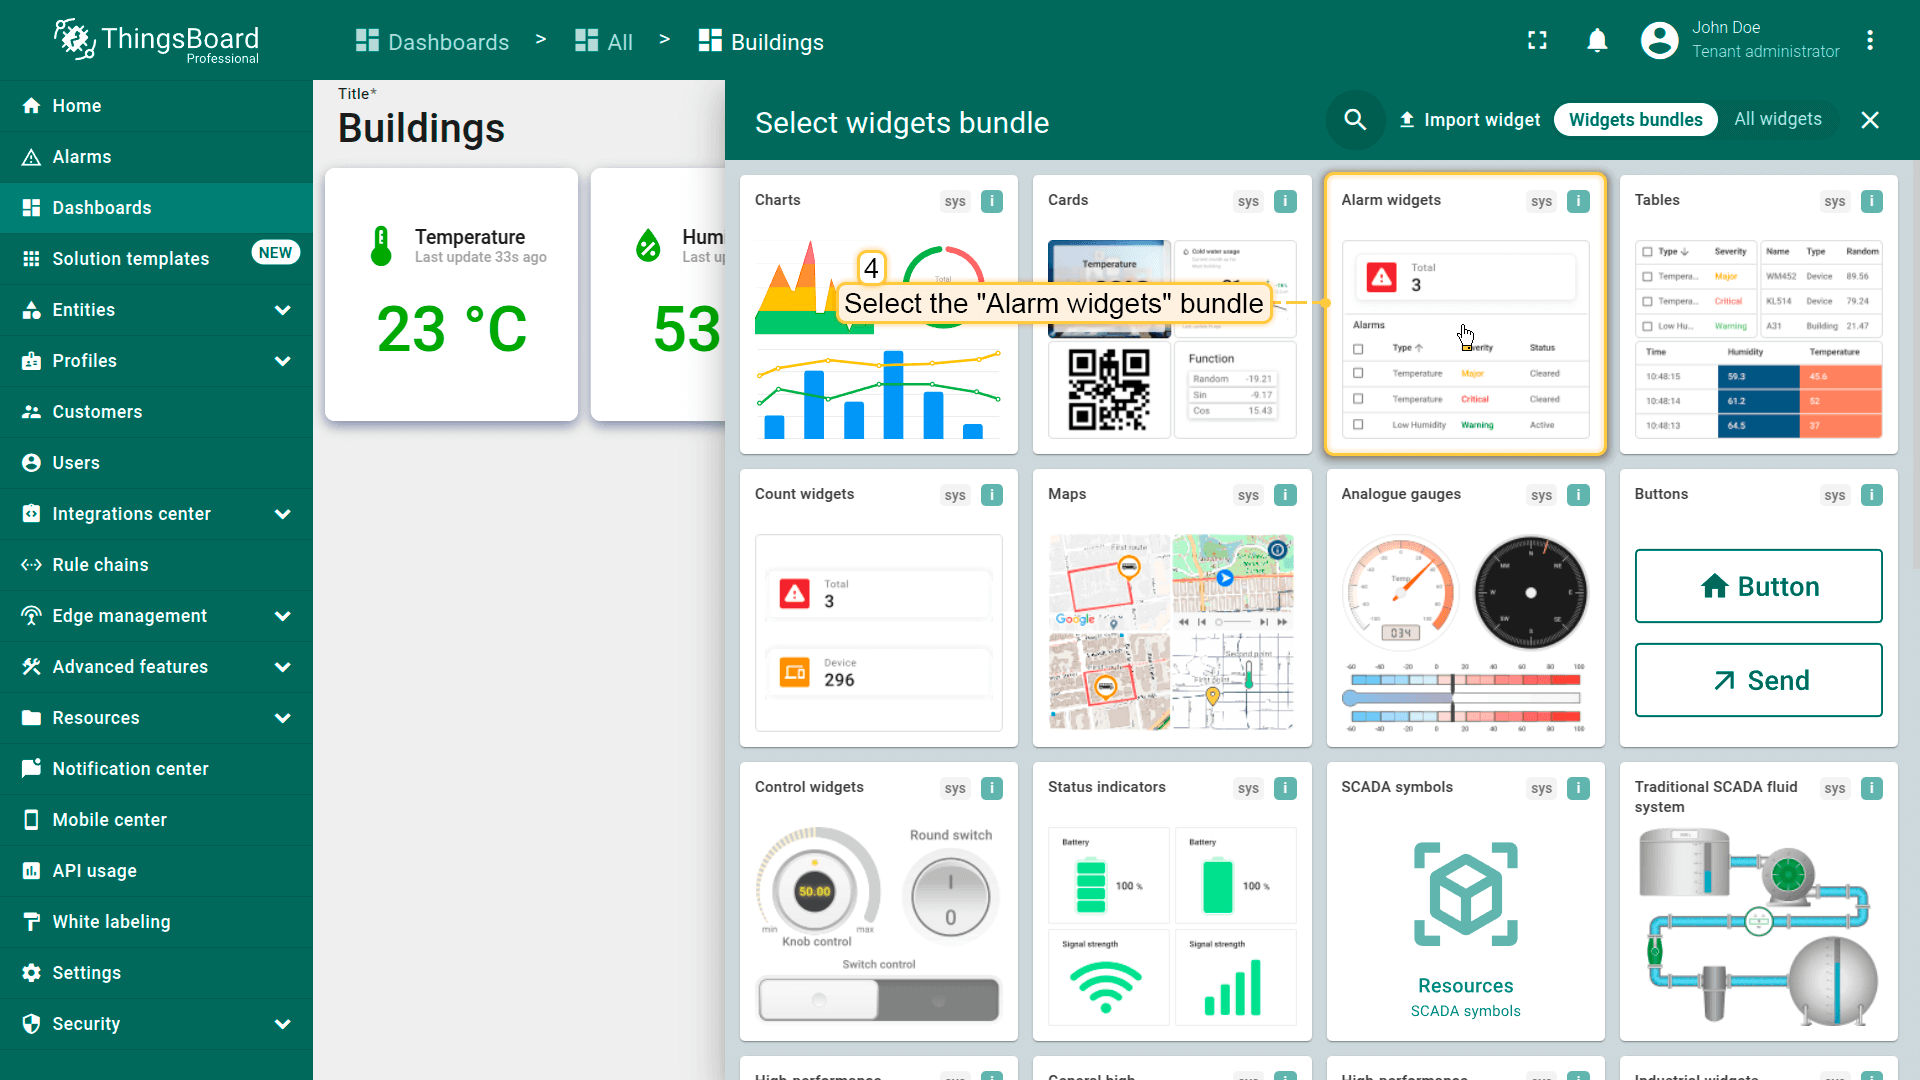
- Find the "Alarm widgets" widgets bundle and click on it;
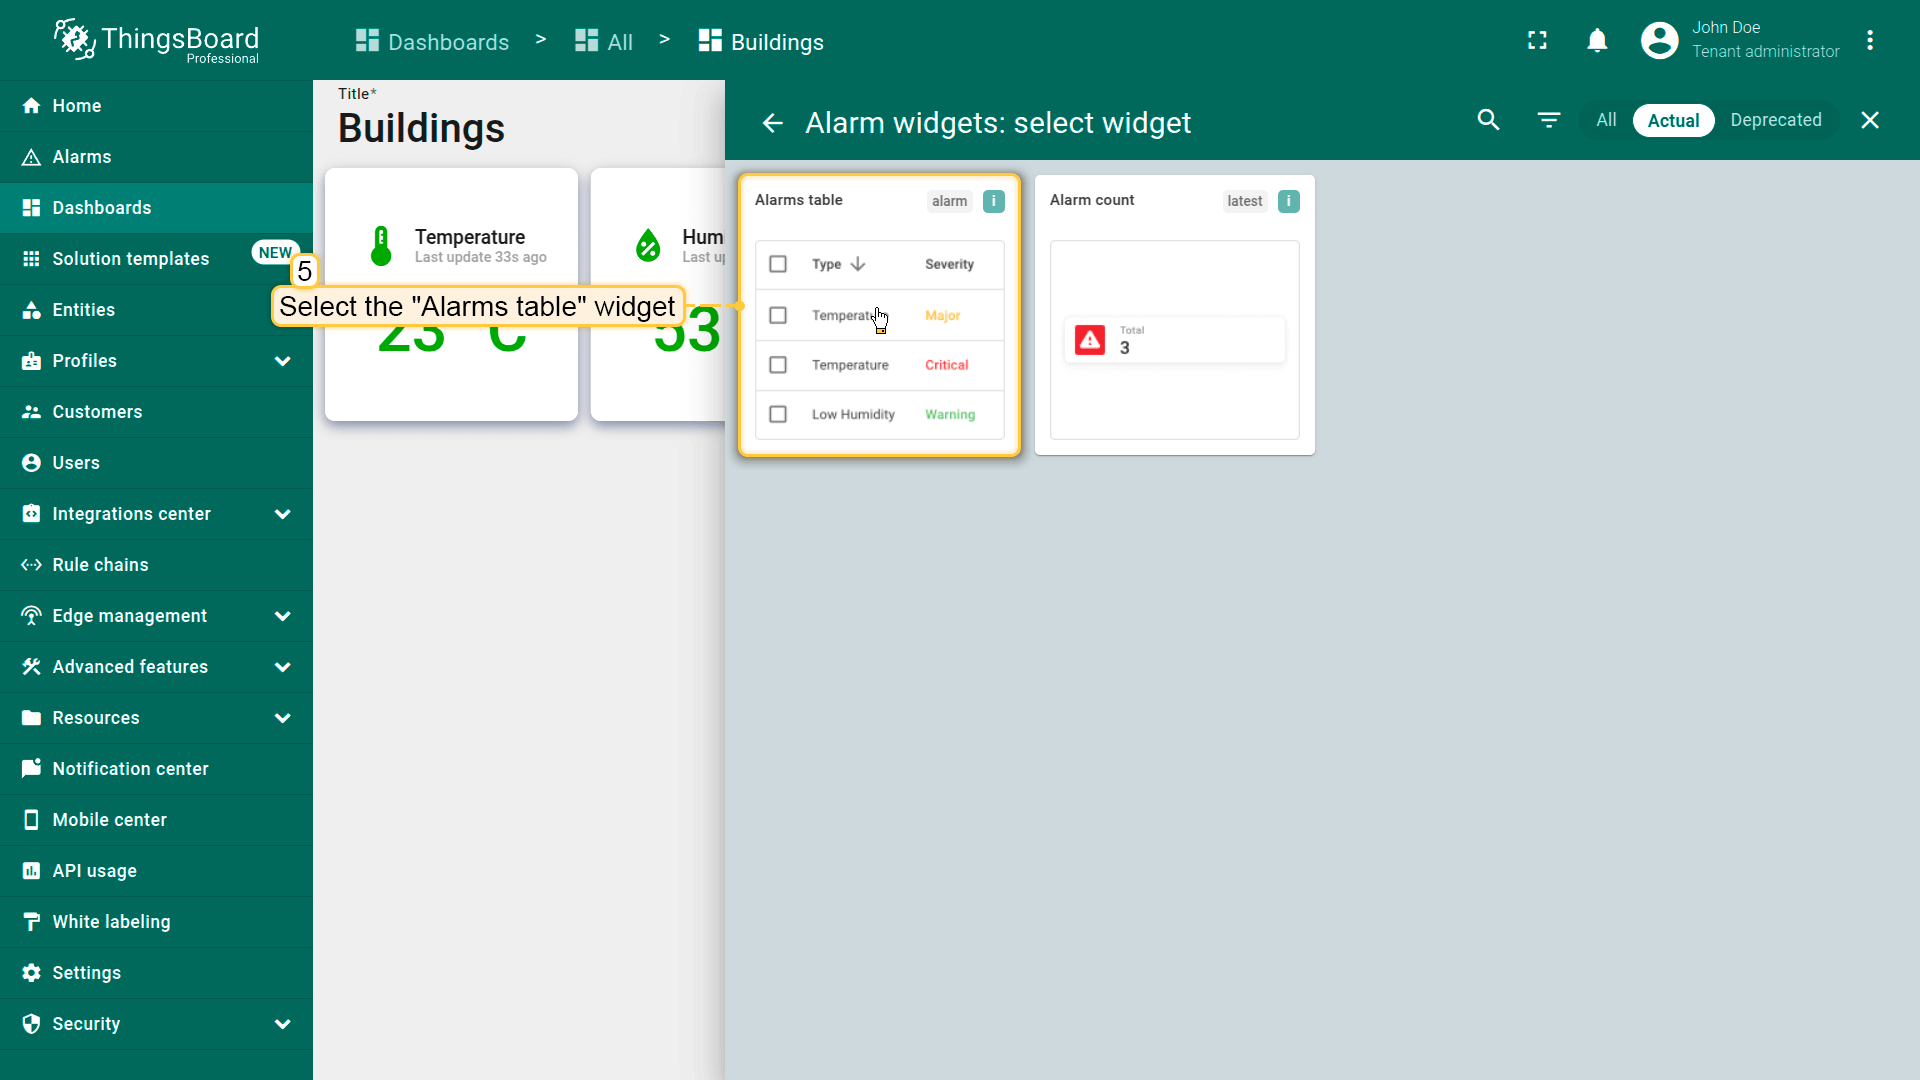
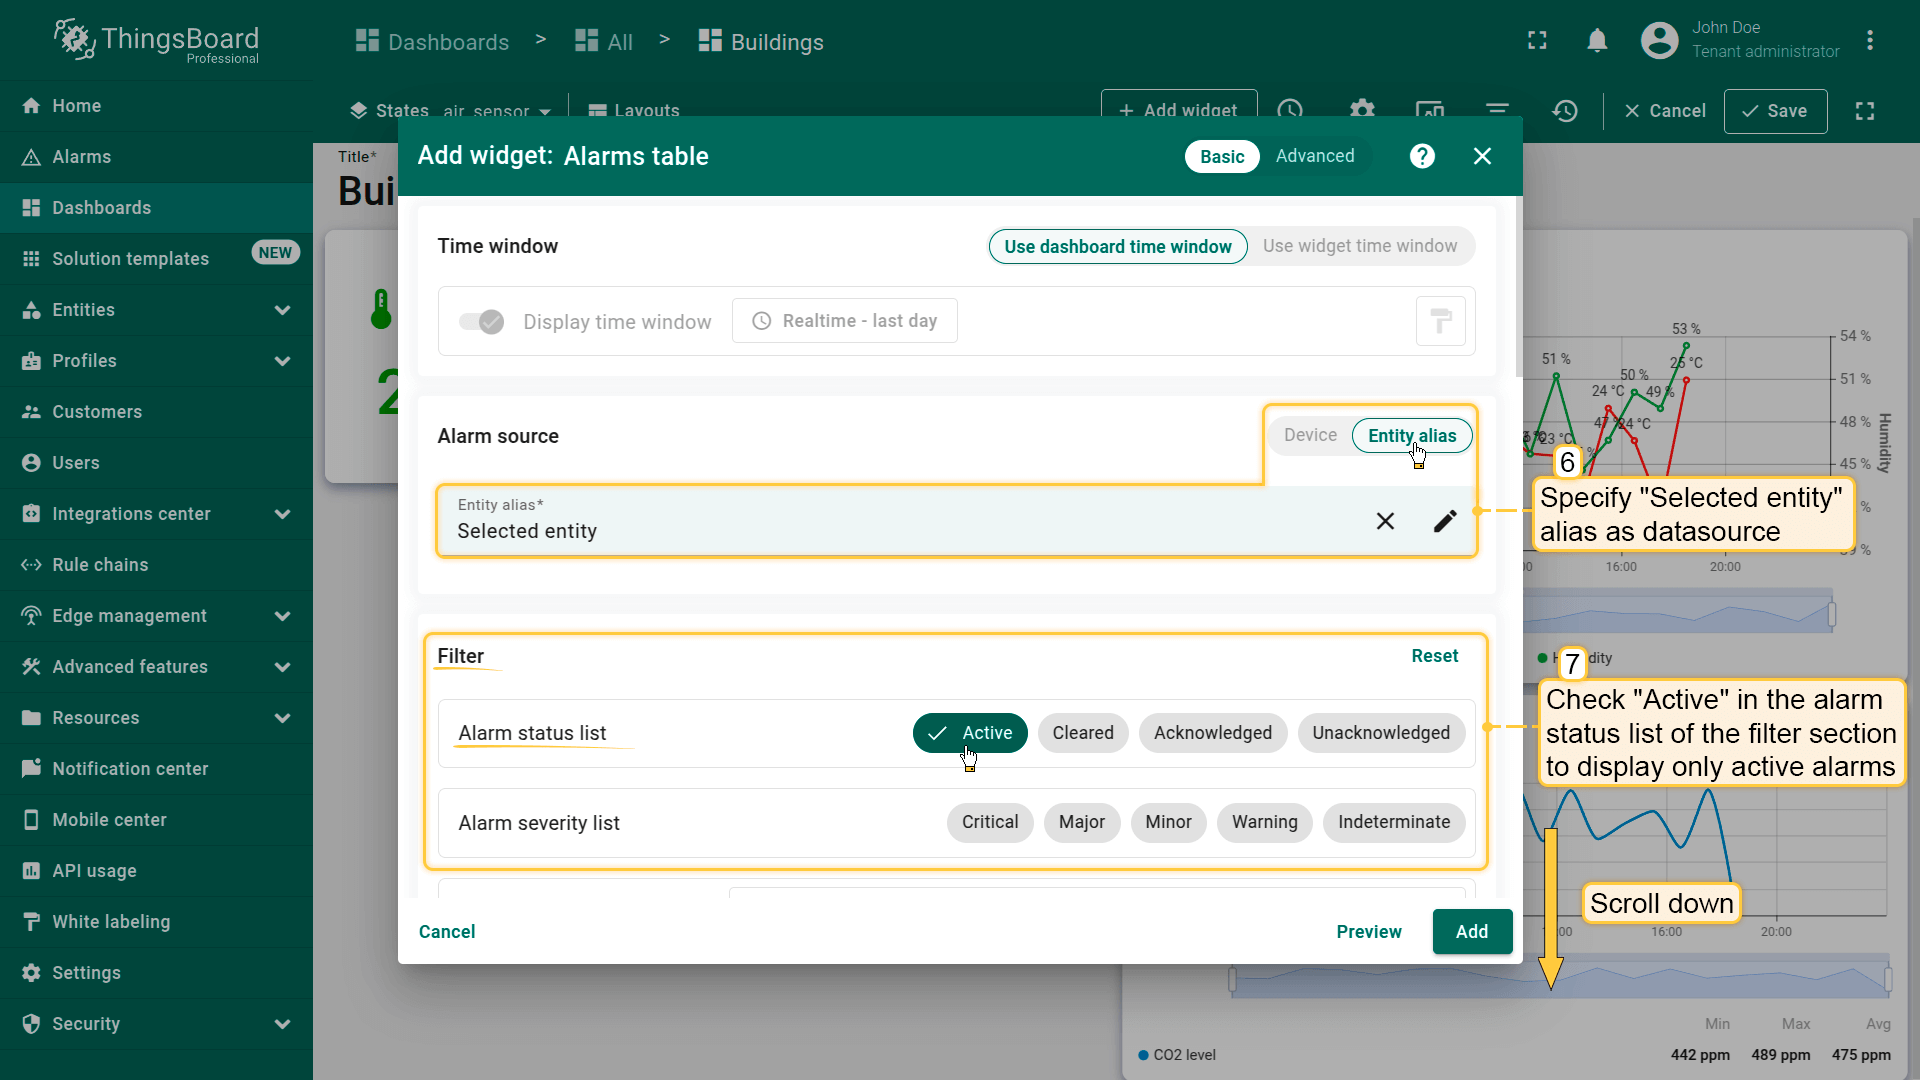
- Choose the "Alarms table" widget;
- Specify "Selected entity" alias as the data source. Check "Active" in the alarm status list of the filter section to show only active alarms;
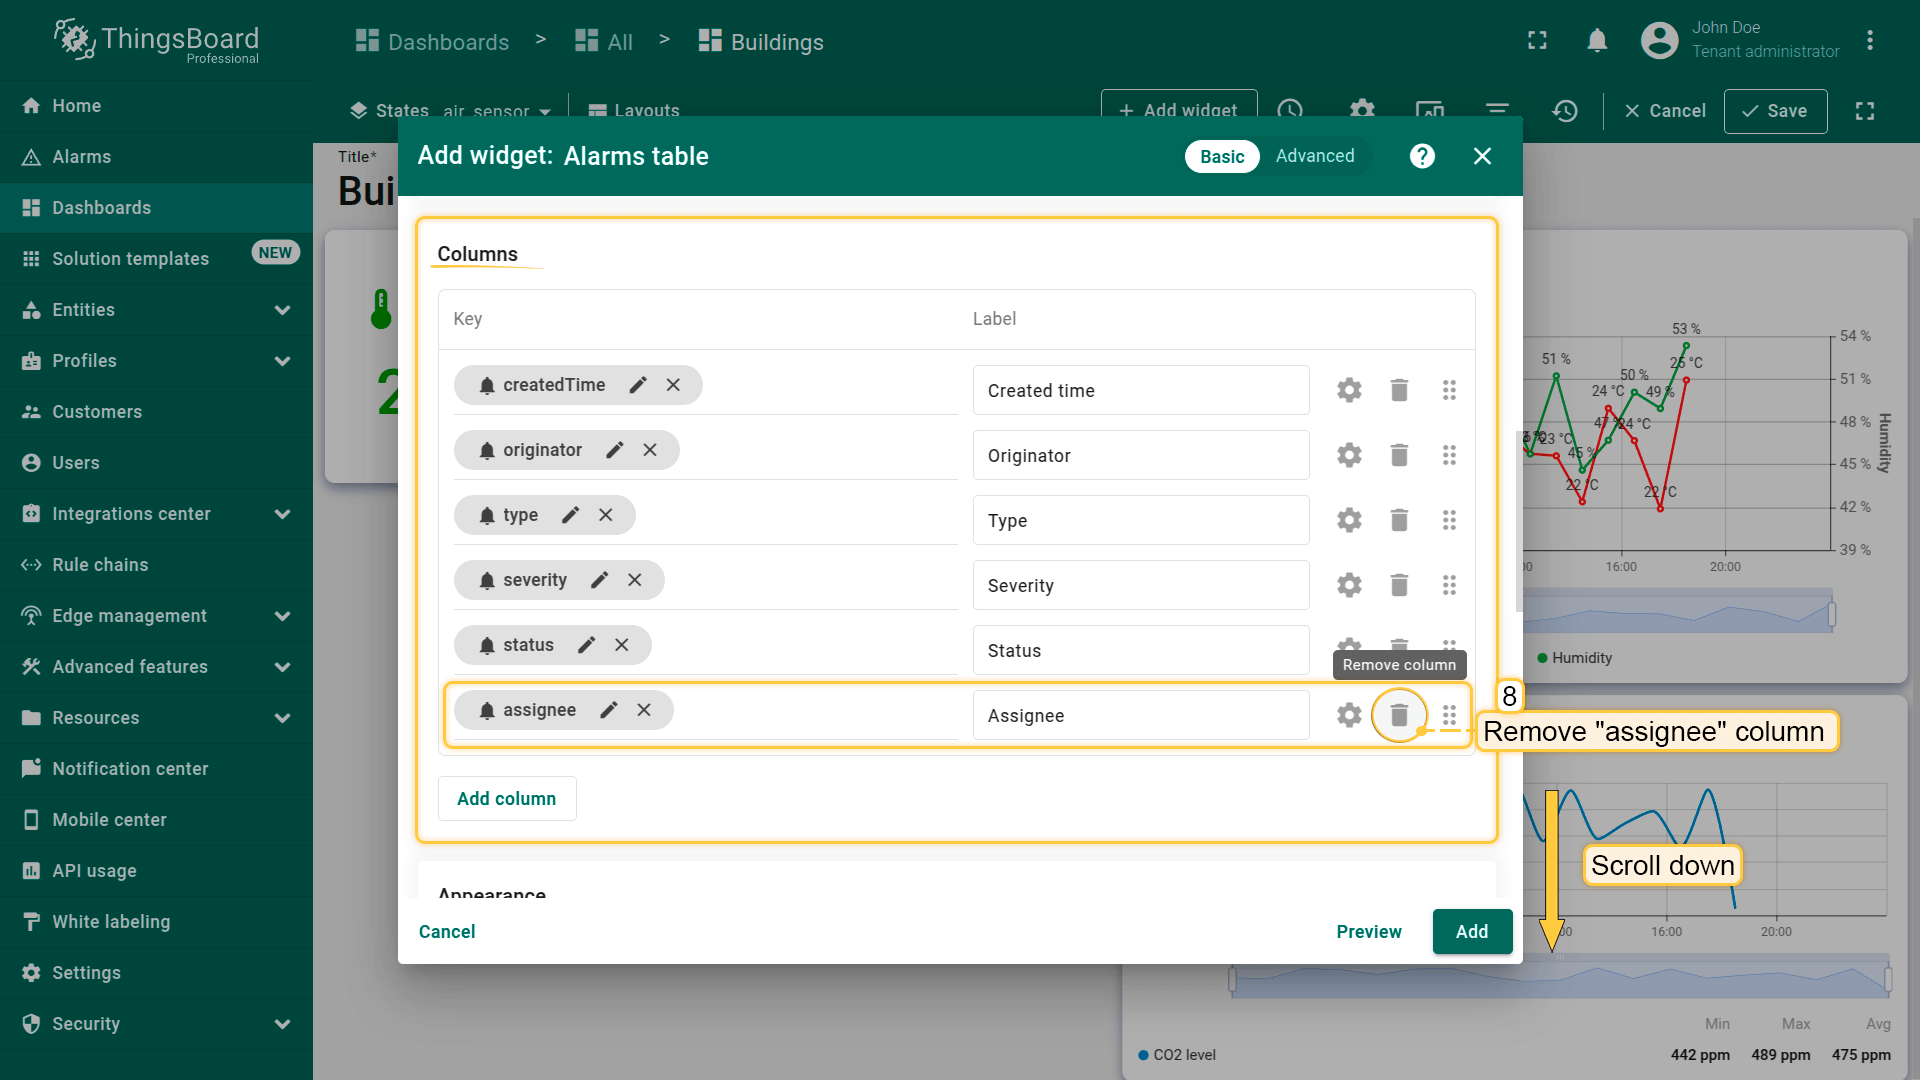
- Remove "assignee" column;
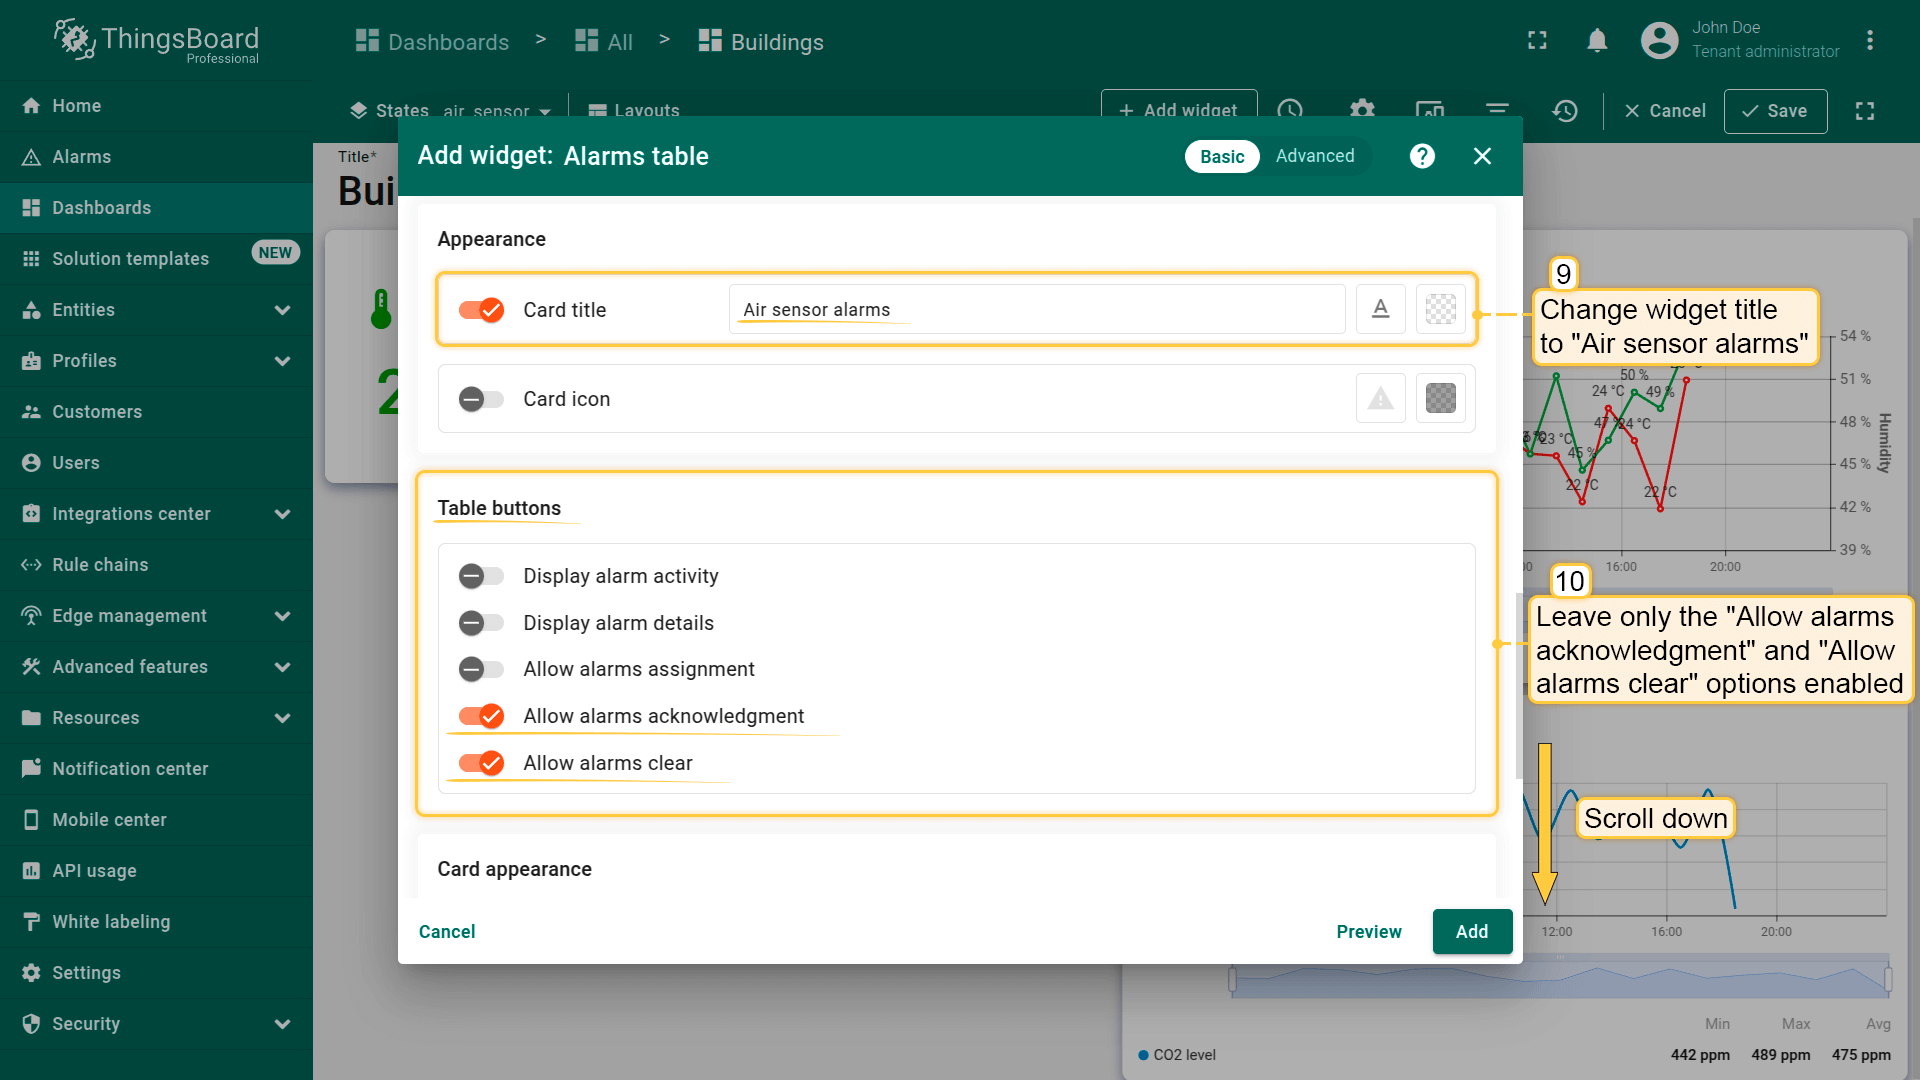
- Change widget title to "Air sensor alarms". In the "Table buttons" section, leave only the "Allow alarms acknowledgment" and "Allow alarms clear" options turned on;
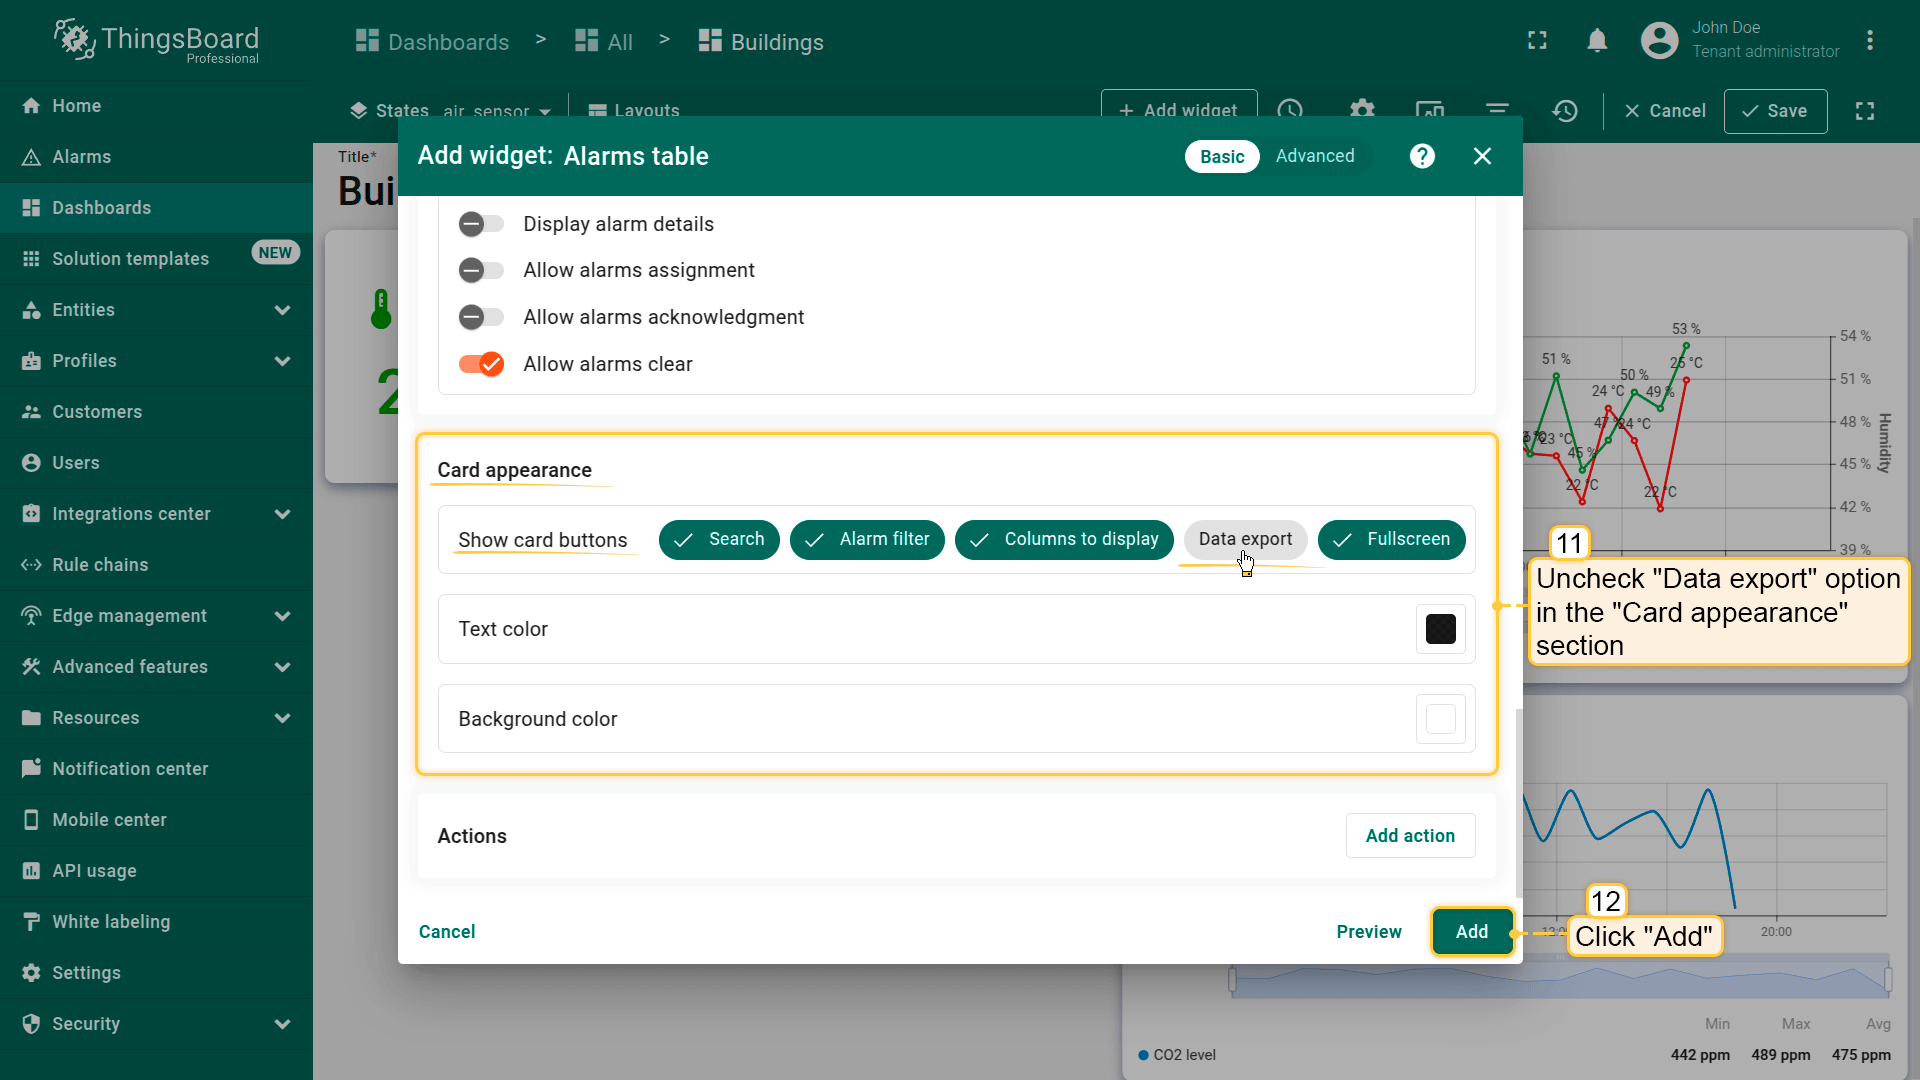
- Uncheck "Data export" option in the "Card appearance" section. Then, click "Add" to confirm adding widget;
- We have added a widget that will display the active alarms for your device. Place the "Air sensor alarms" widget on the free space of the dashboard and adjust its size by dragging the lower right corner. Then, save the dashboard.
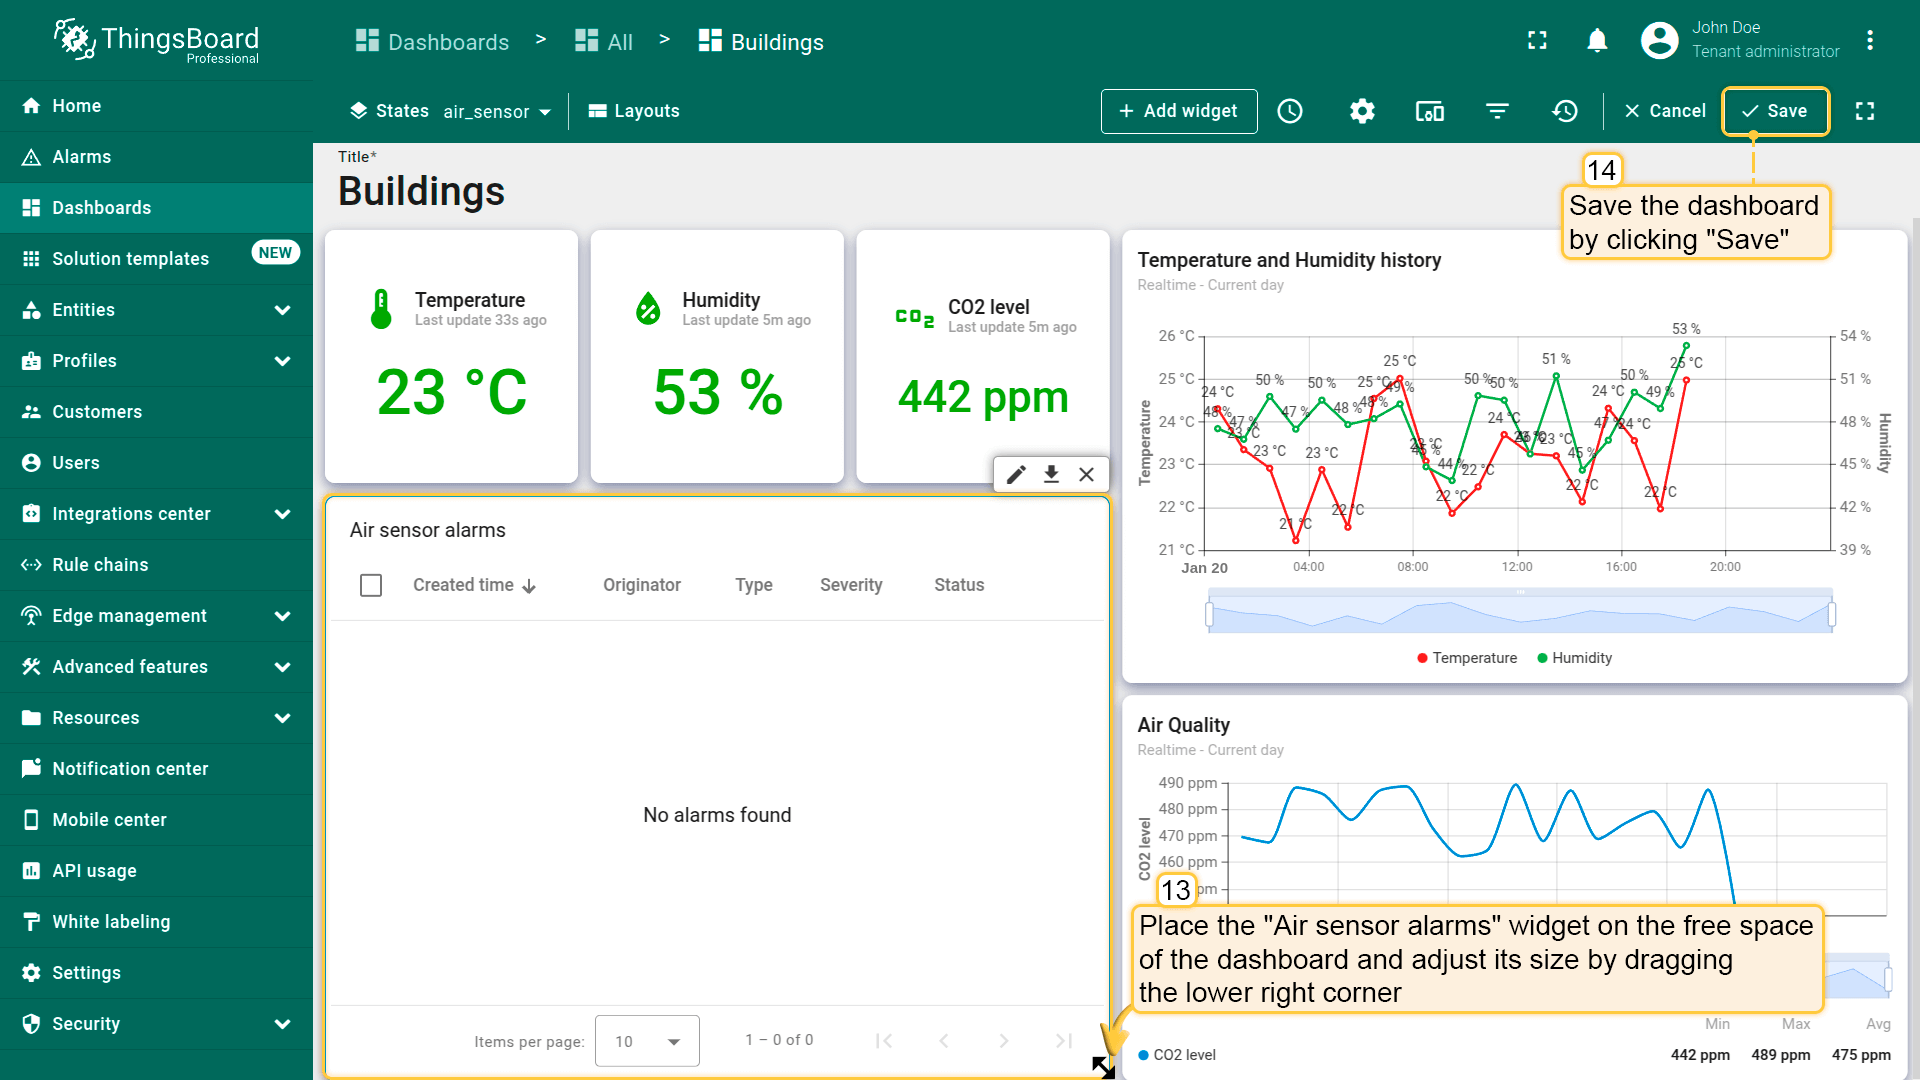
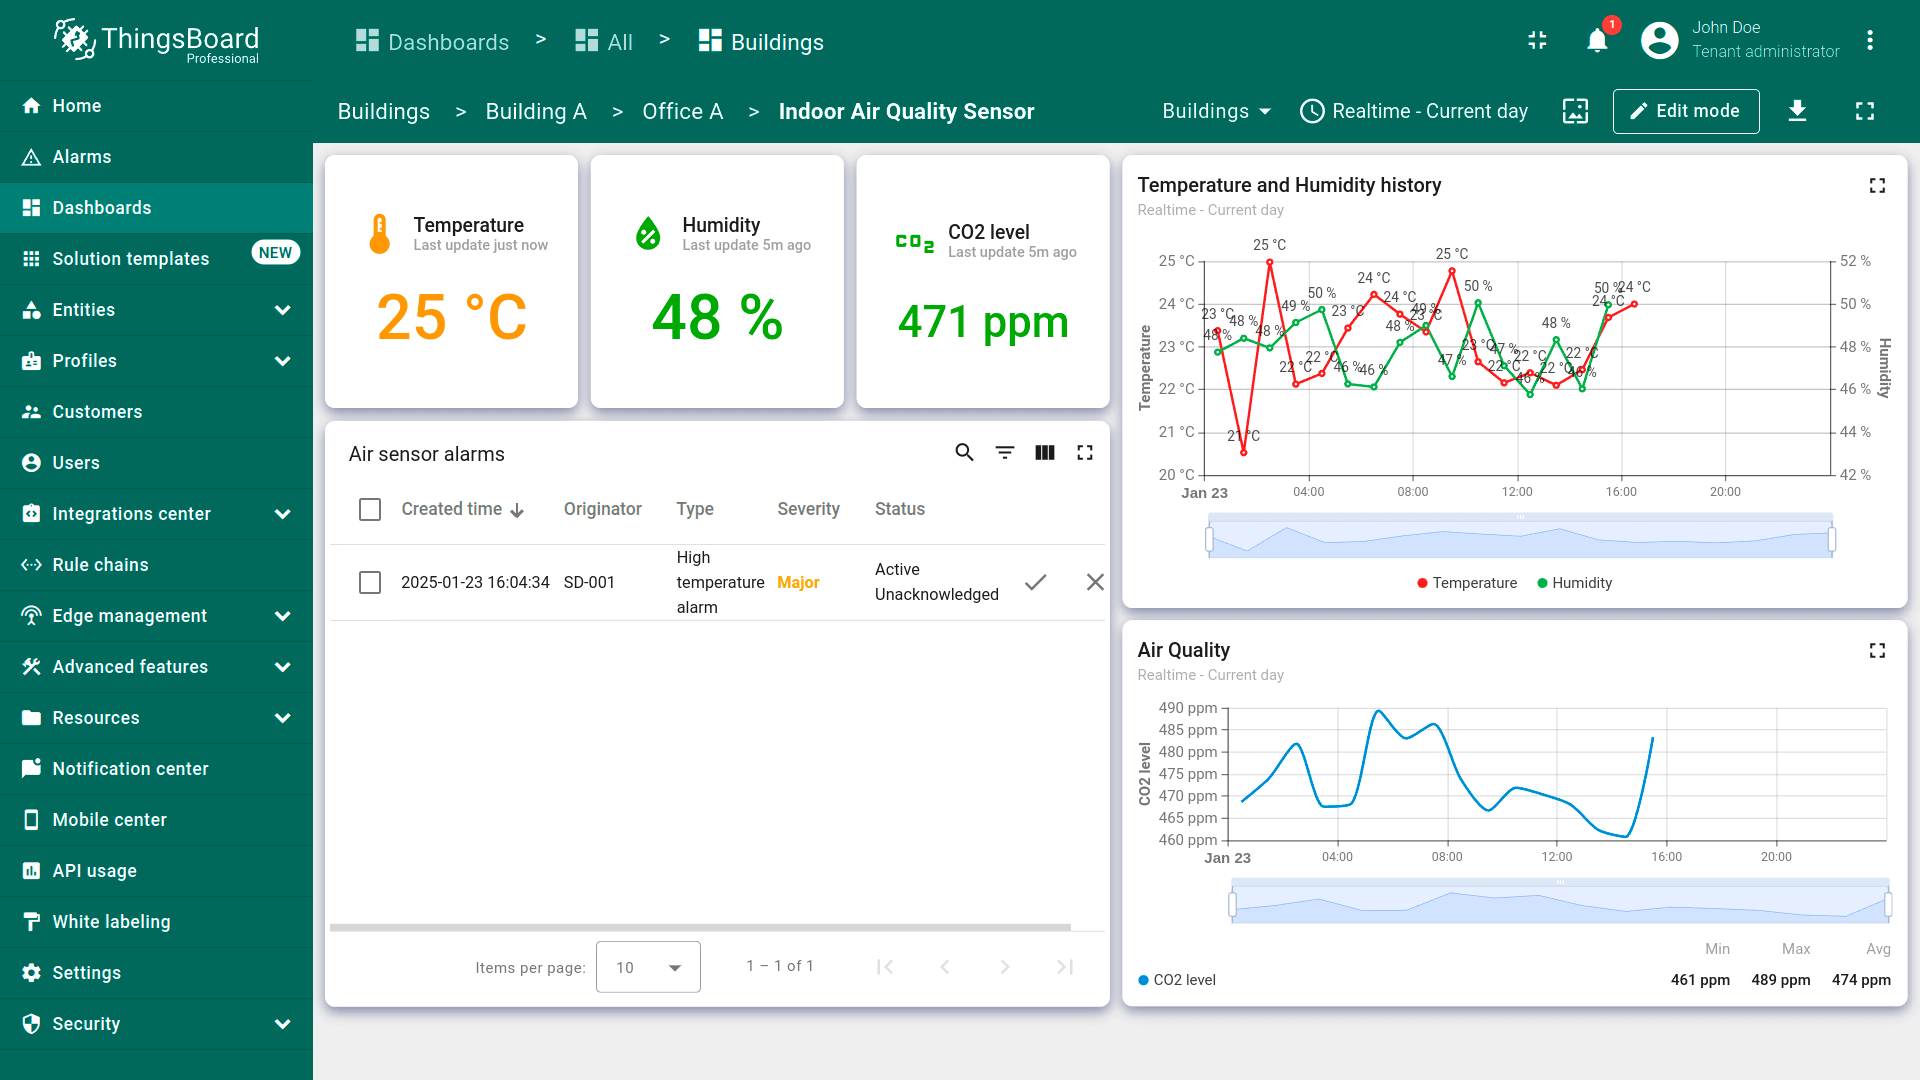
A fully configured air_sensor state should look like this:

Now that the alarm rules have been defined and the widget for displaying active alarms has been added, let's test its functionality by sending telemetry values that exceed the threshold specified in the alarm rule.
Alarm trigger testing
To test the alarm triggering, it is not necessary to wait for the generator node to produce telemetry values exceeding the threshold. We can manually send telemetry with a value that exceeds the threshold specified in the alarm rule. As you may recall, if the temperature value exceeds 24 °C, an alarm with a severity type of “Major” is triggered.
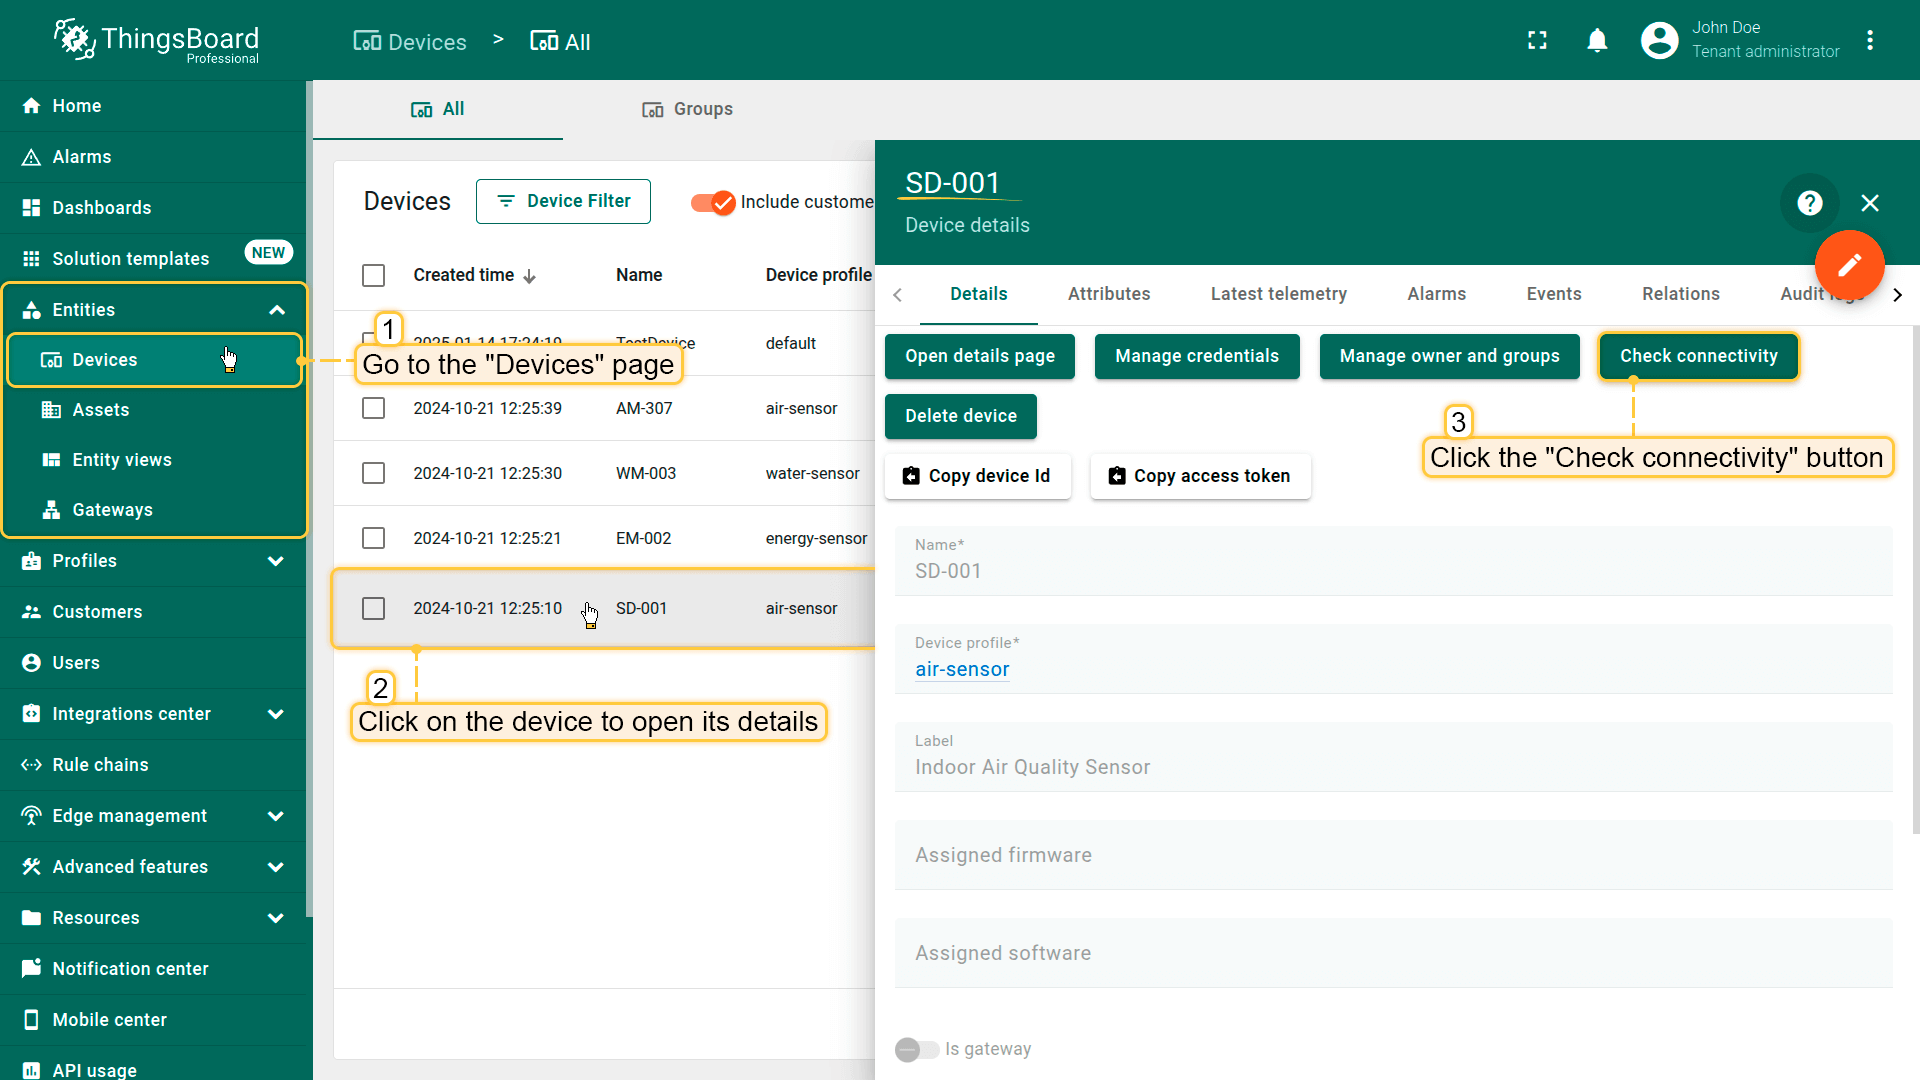
- Go to the "Devices" page. Choose the "Indoor Air Quality Sensor" device and click the "Check connectivity” button in the "Device details" window;
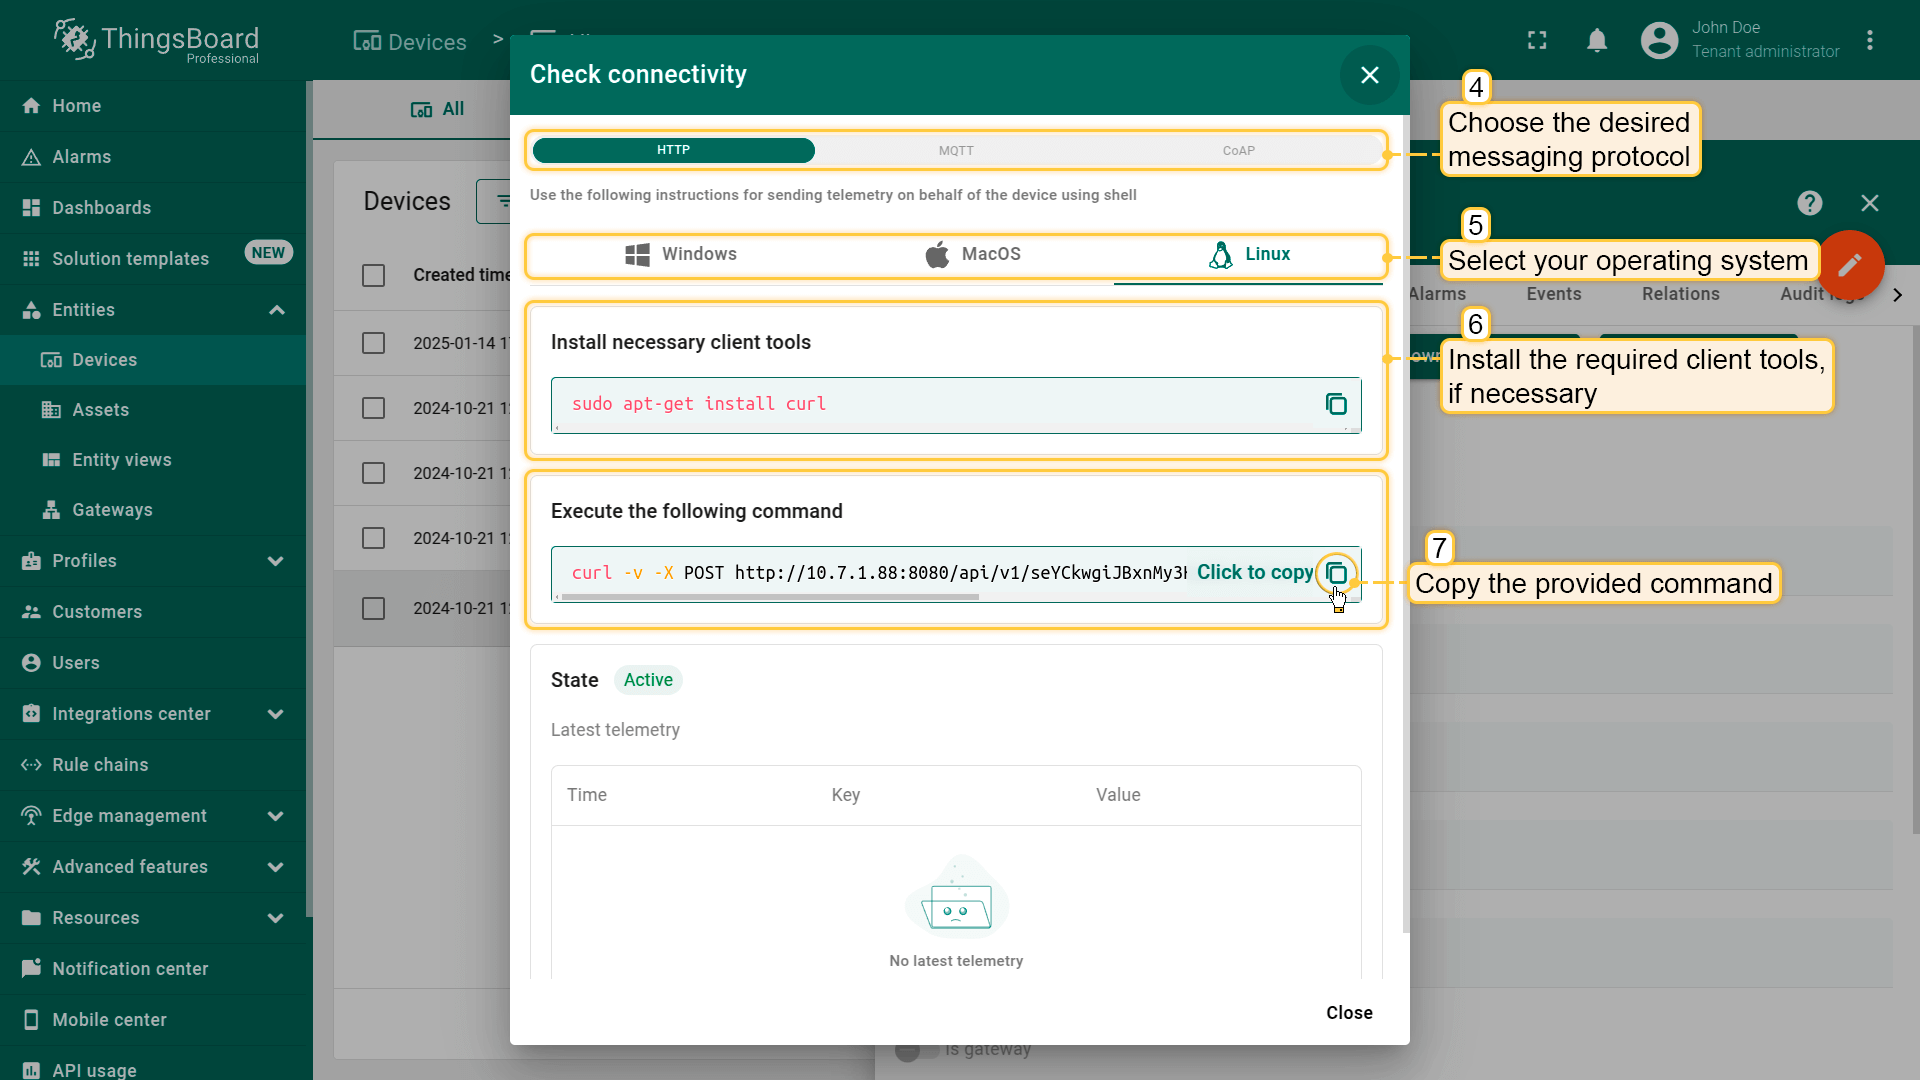
- In the opened window choose the desired messaging protocol and select your operating system. Install the required client tools, if necessary. Next, copy the provided command, which includes telemetry data;
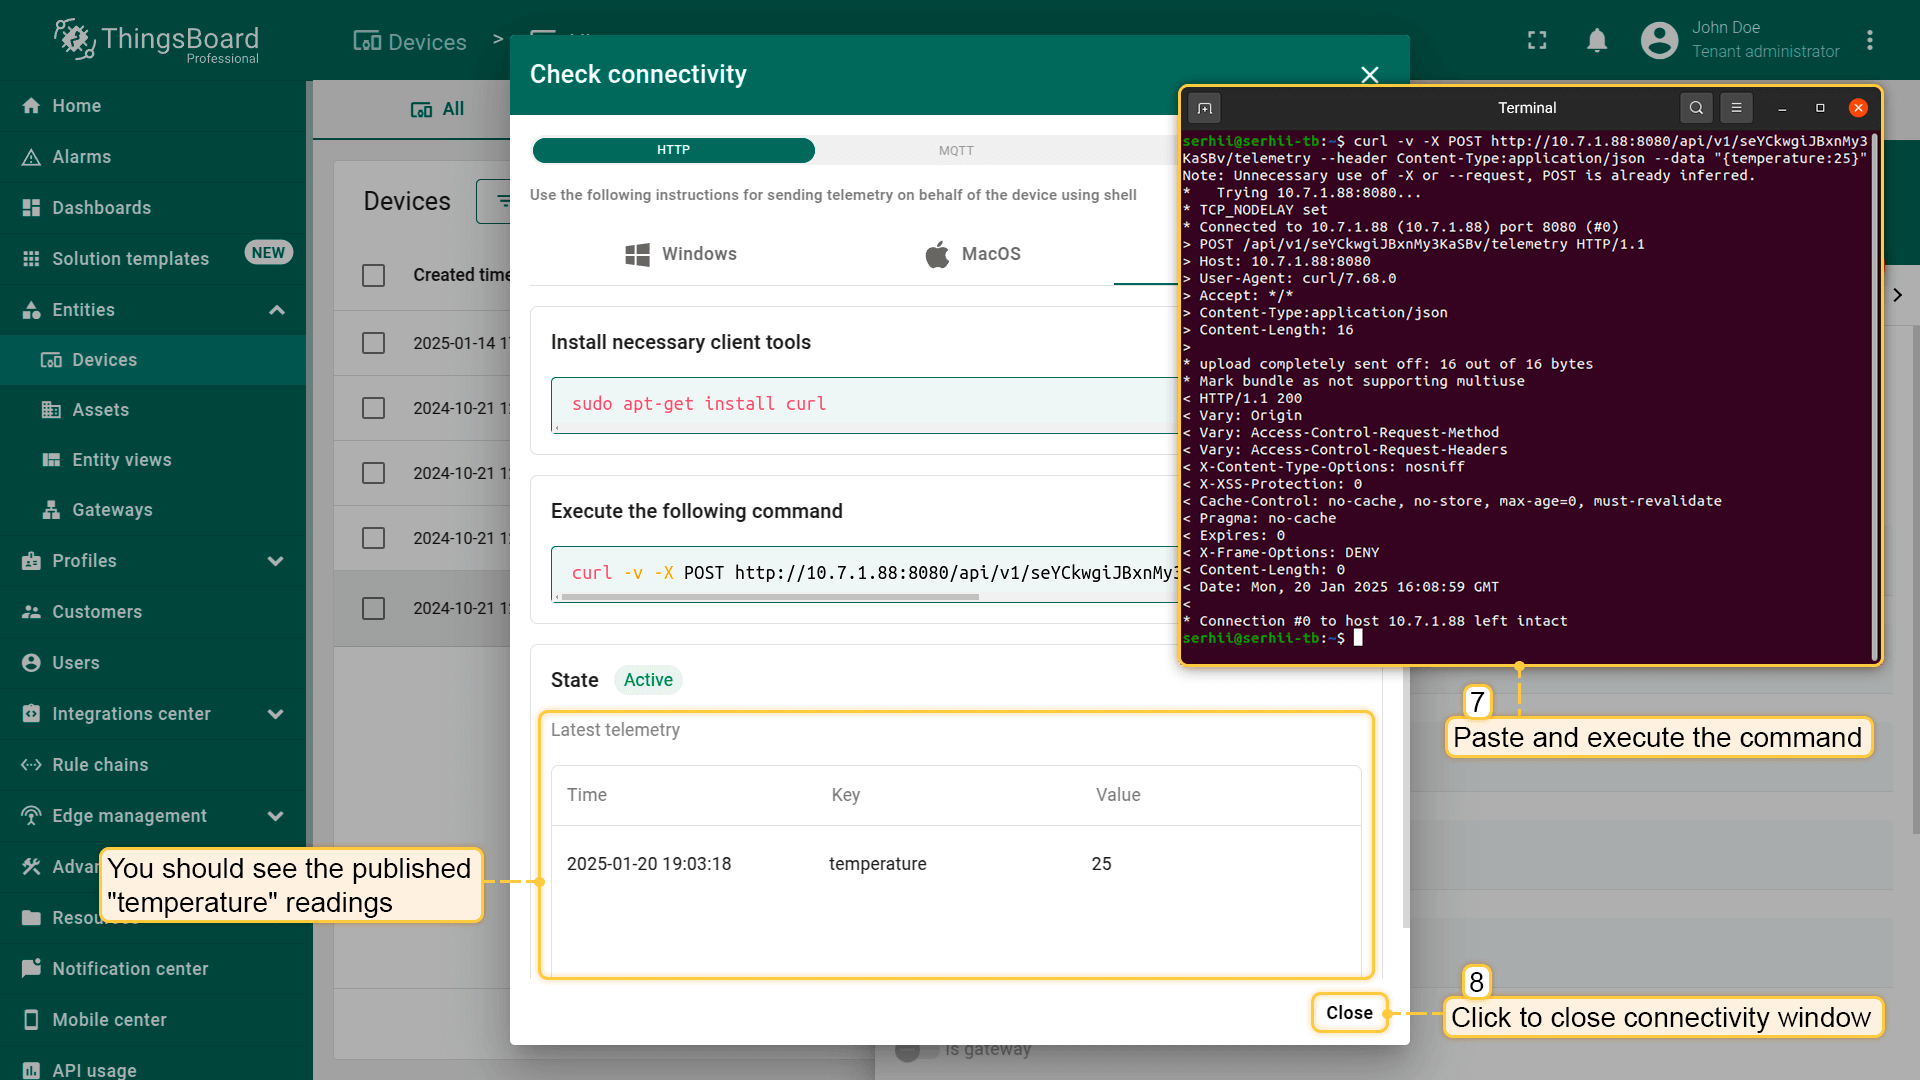
- Open the Terminal and paste the copied command. This command will send a POST request to the ThingsBoard server with the {"temperature":25} data. Execute this command. After successful execution, the "temperature" reading will be published. Then, close the connectivity window.
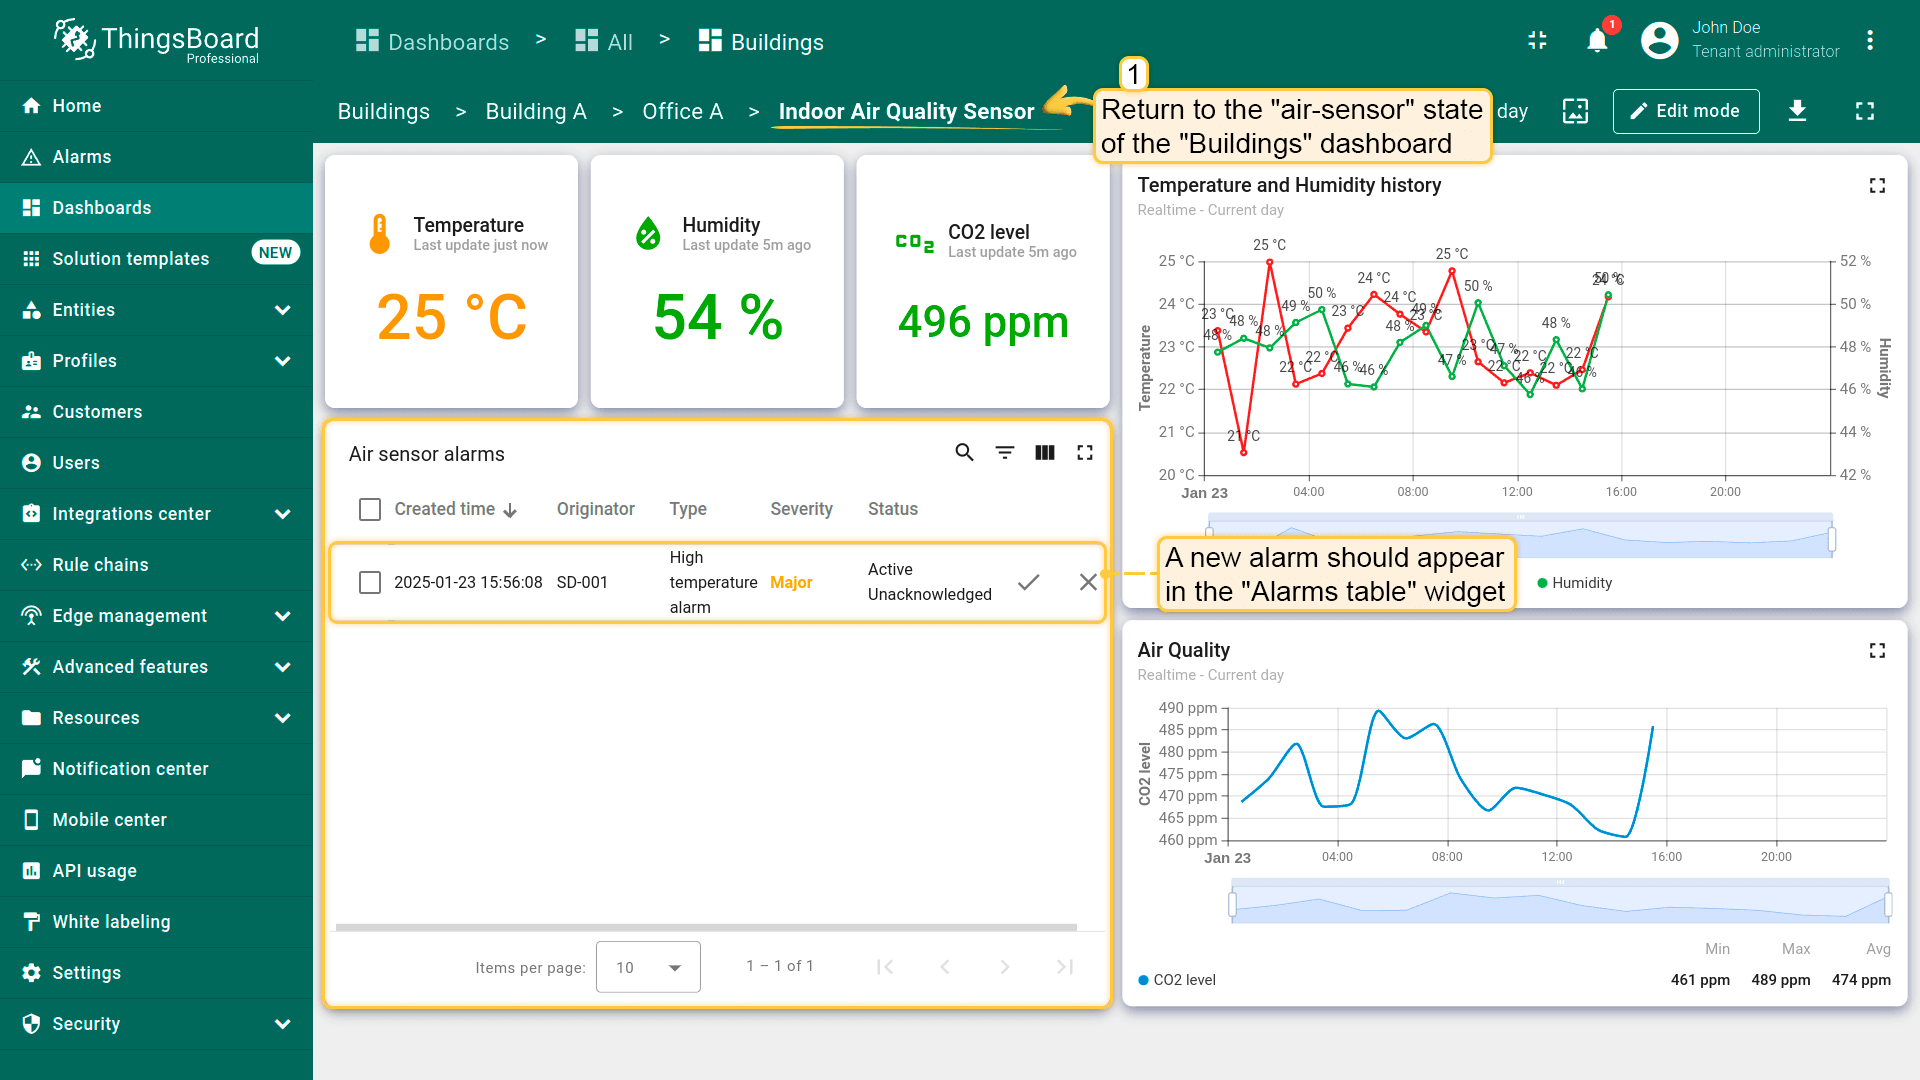
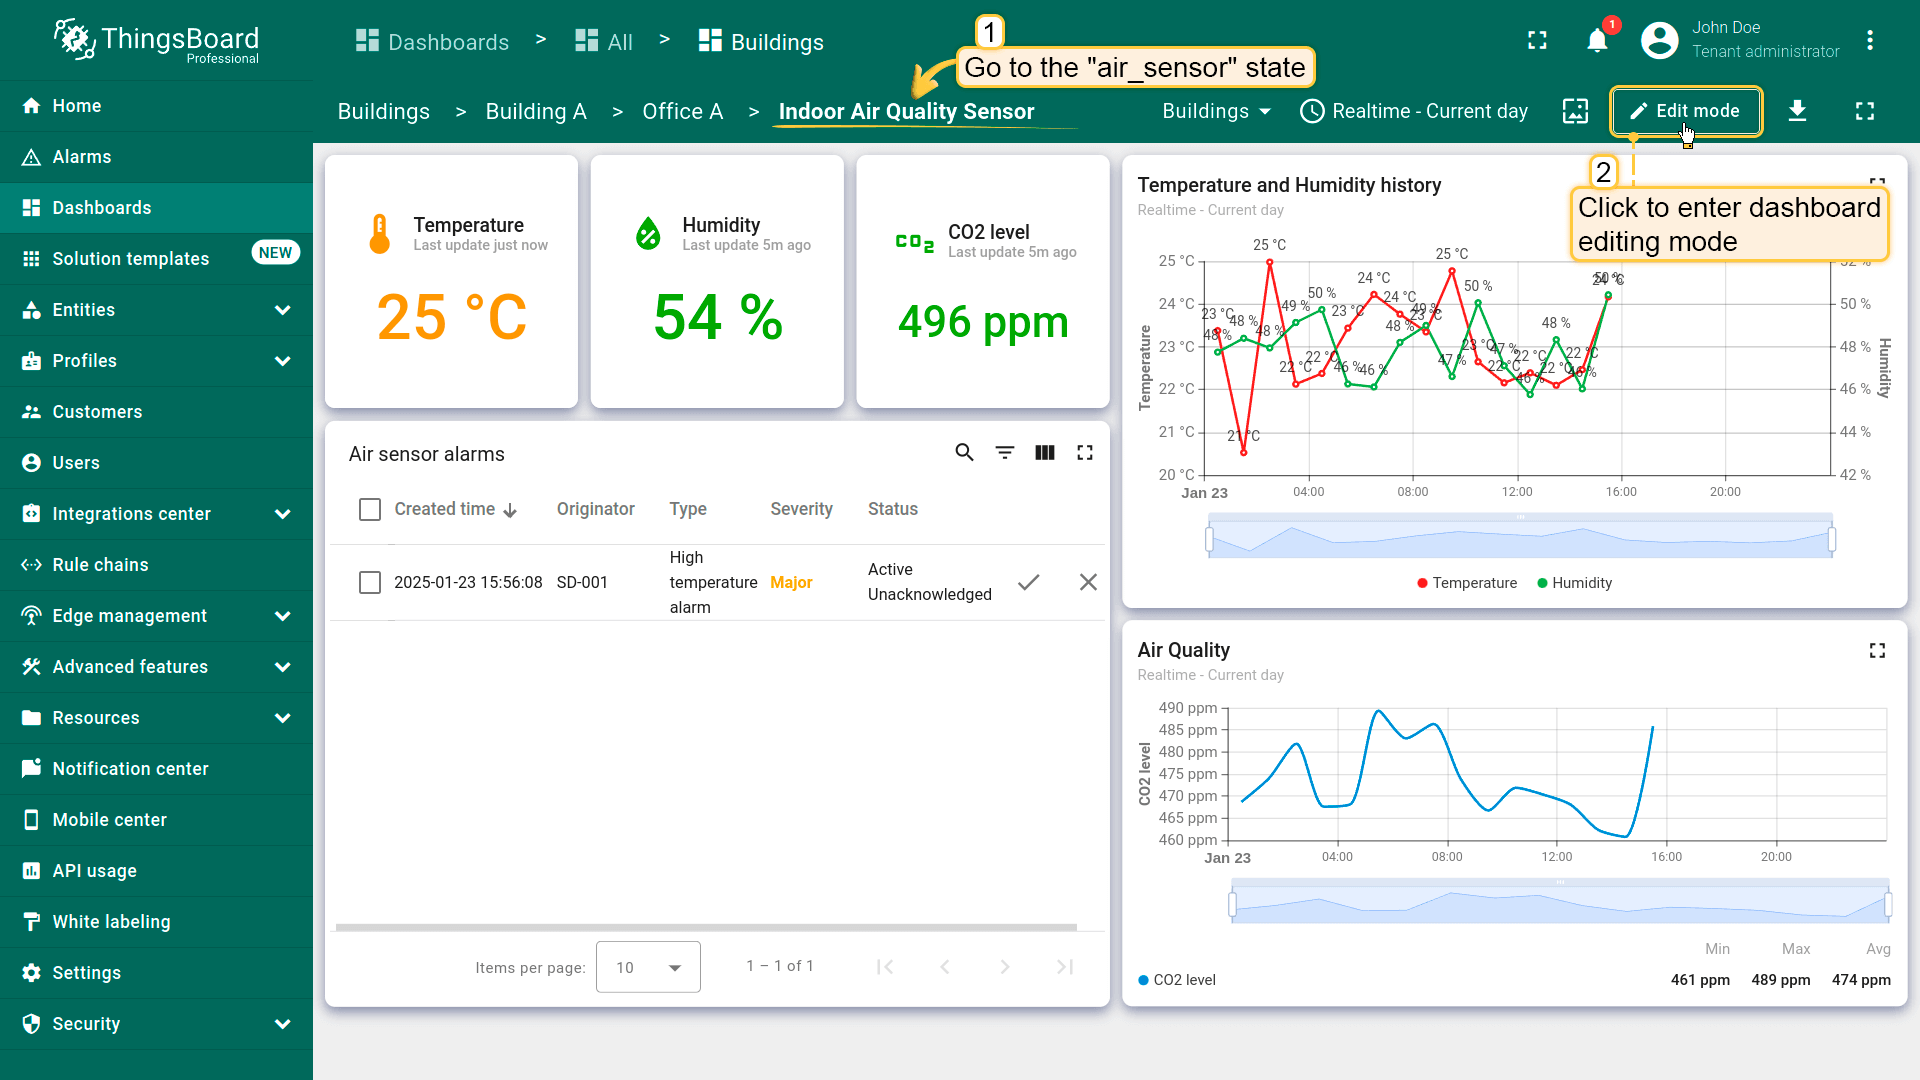
Return to the air_sensor dashboard state. In the “Alarms table” widget, an alarm should appear displaying the created time, originator of the alarm, its severity and its status. When an alarm is triggered, it initially has the status “Active” and “Unacknowledged”. A user can acknowledge the alarm, changing its status to “Acknowledged”. However, it will remain active until it is resolved (cleared).
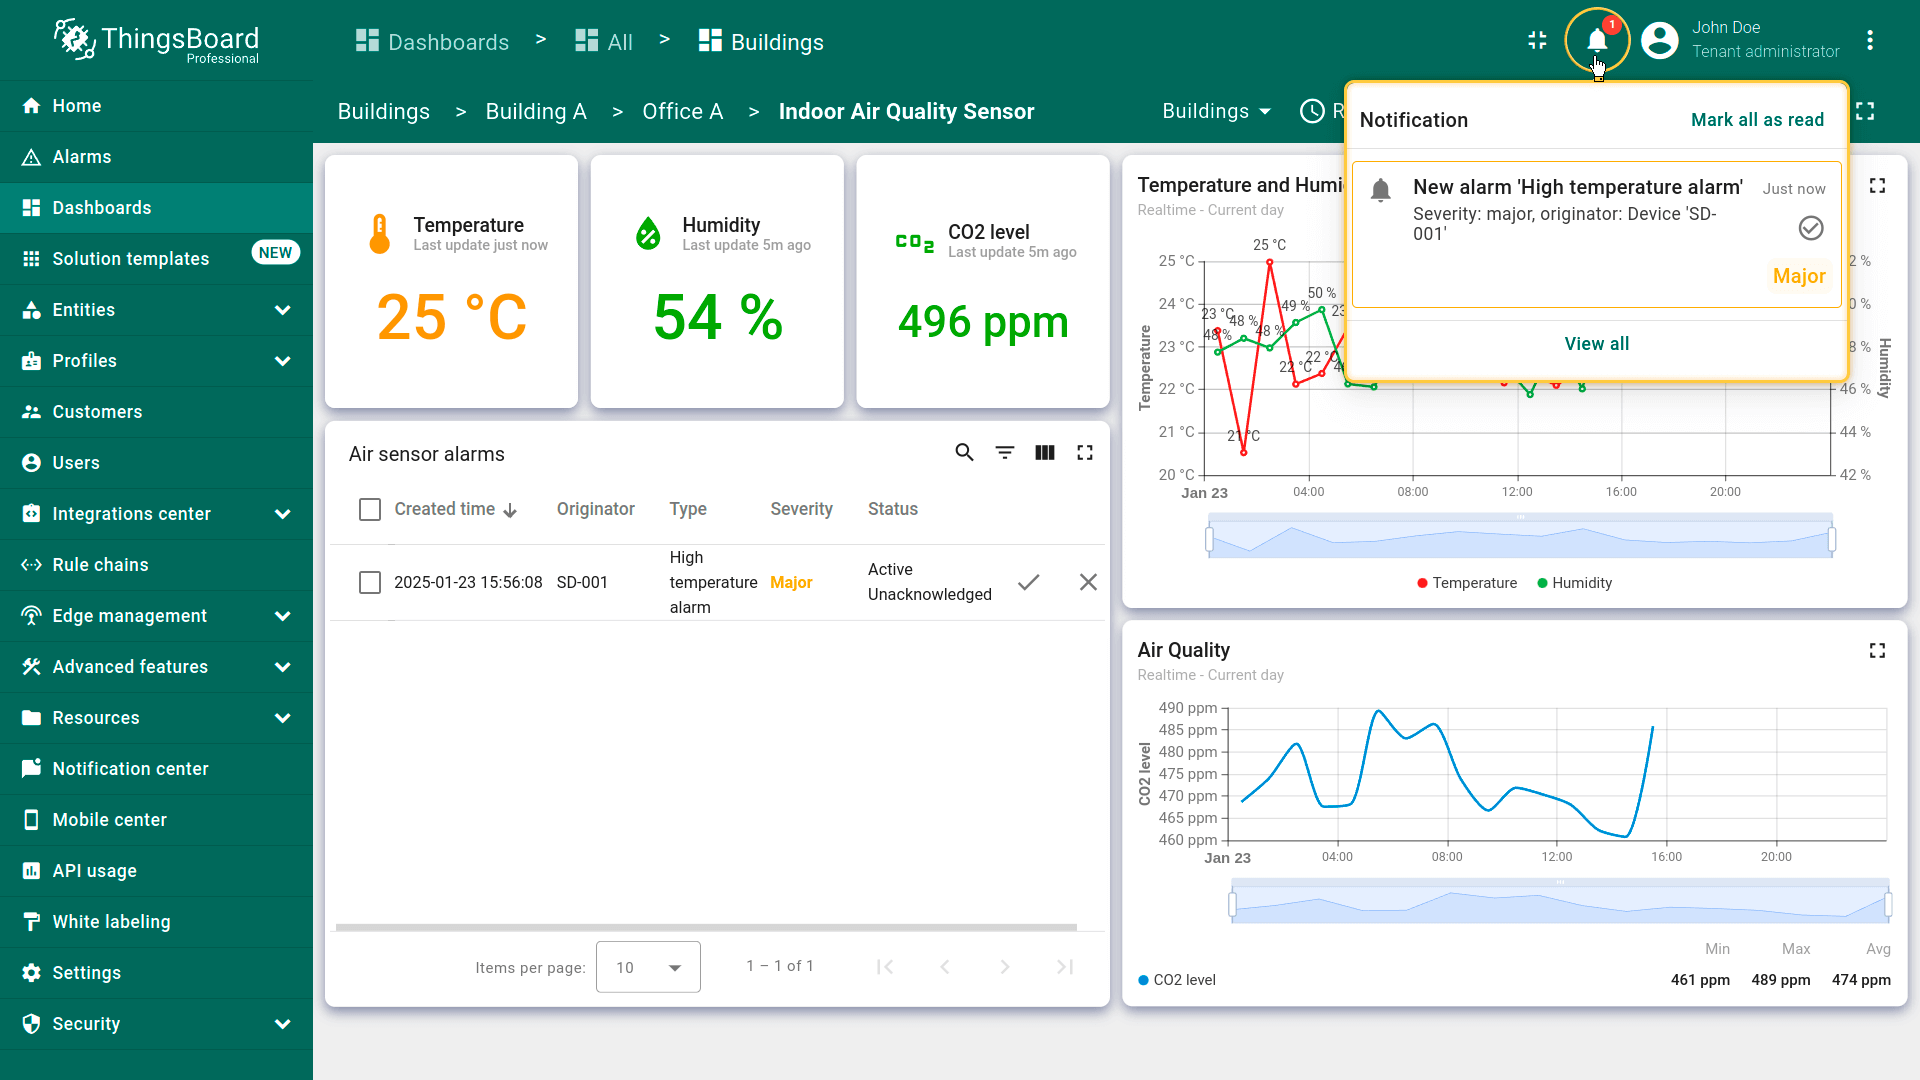
You will also receive a notification about the triggered alarm in the Notification center. Learn more about notifications and how to configure them here.
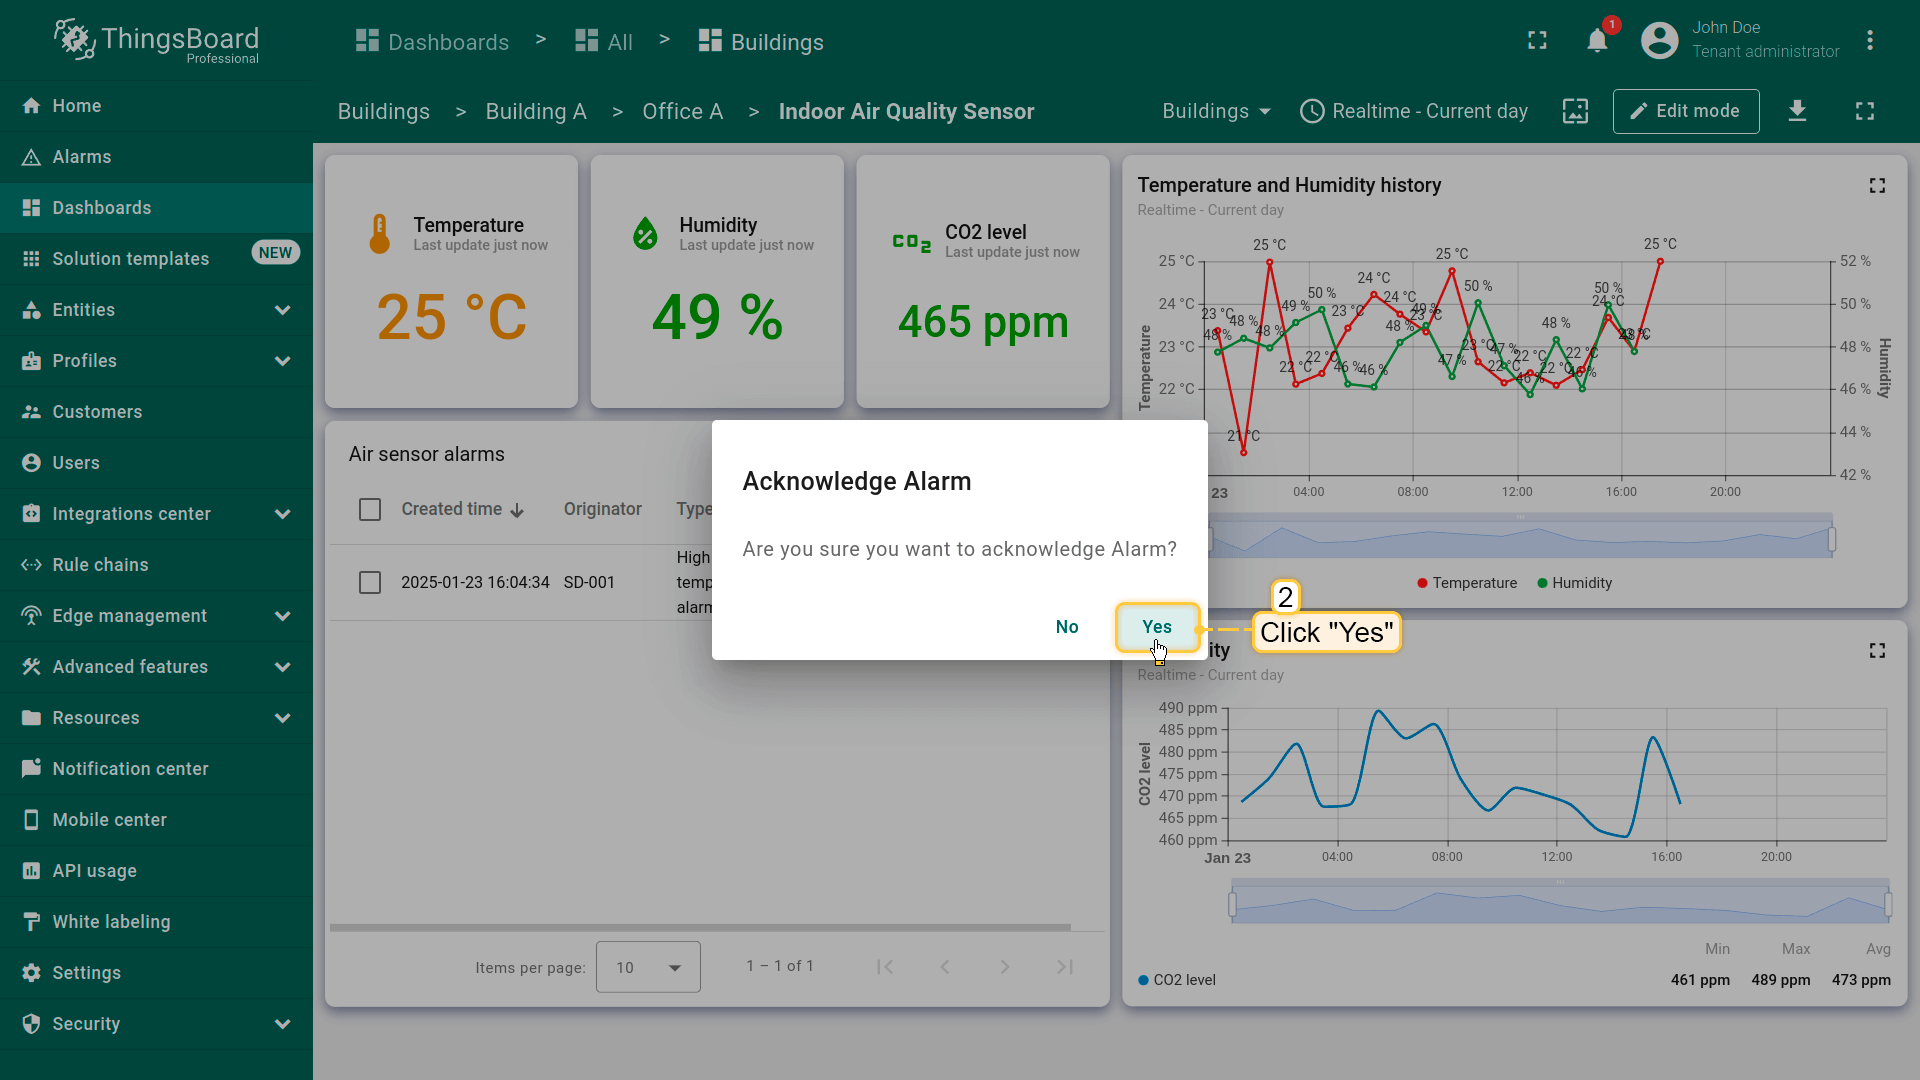
Acknowledge alarm
To acknowledge an alarm, click the “Acknowledge” icon next to the alarm event and confirm the action.
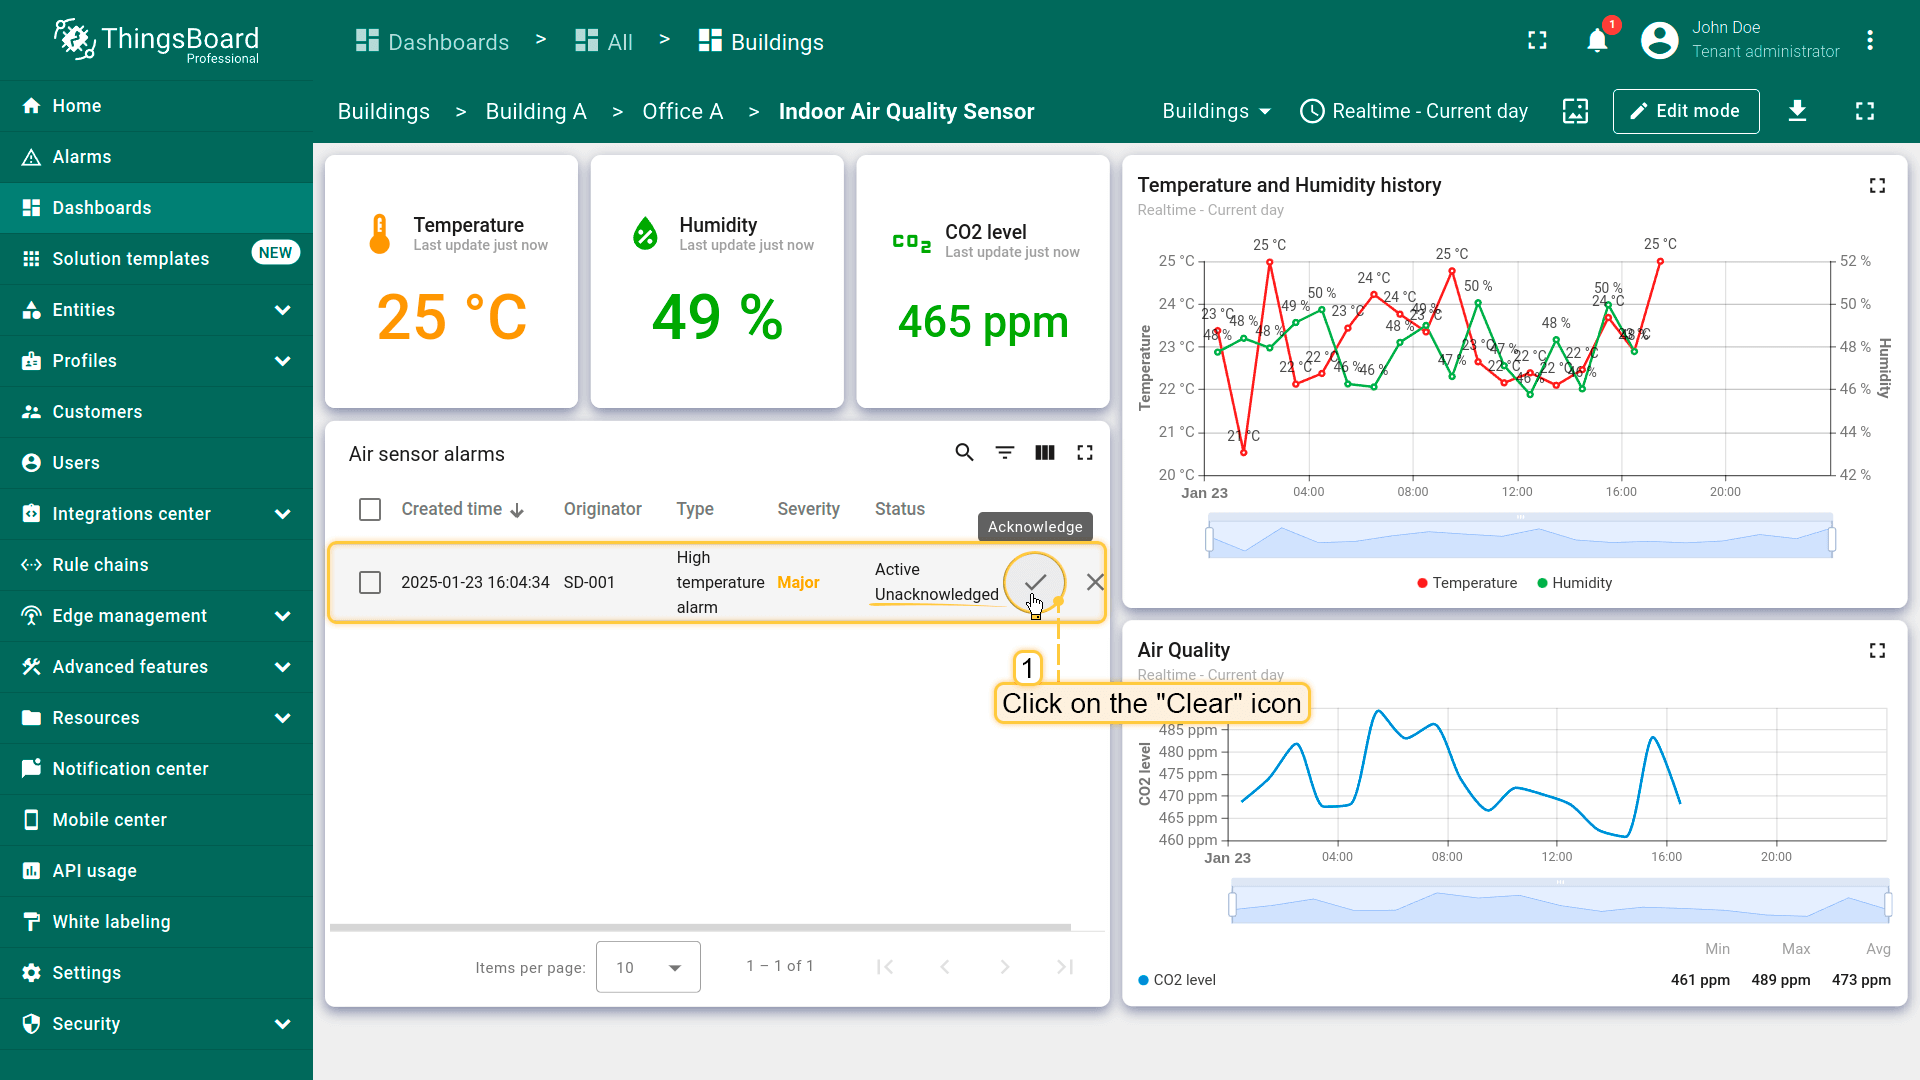

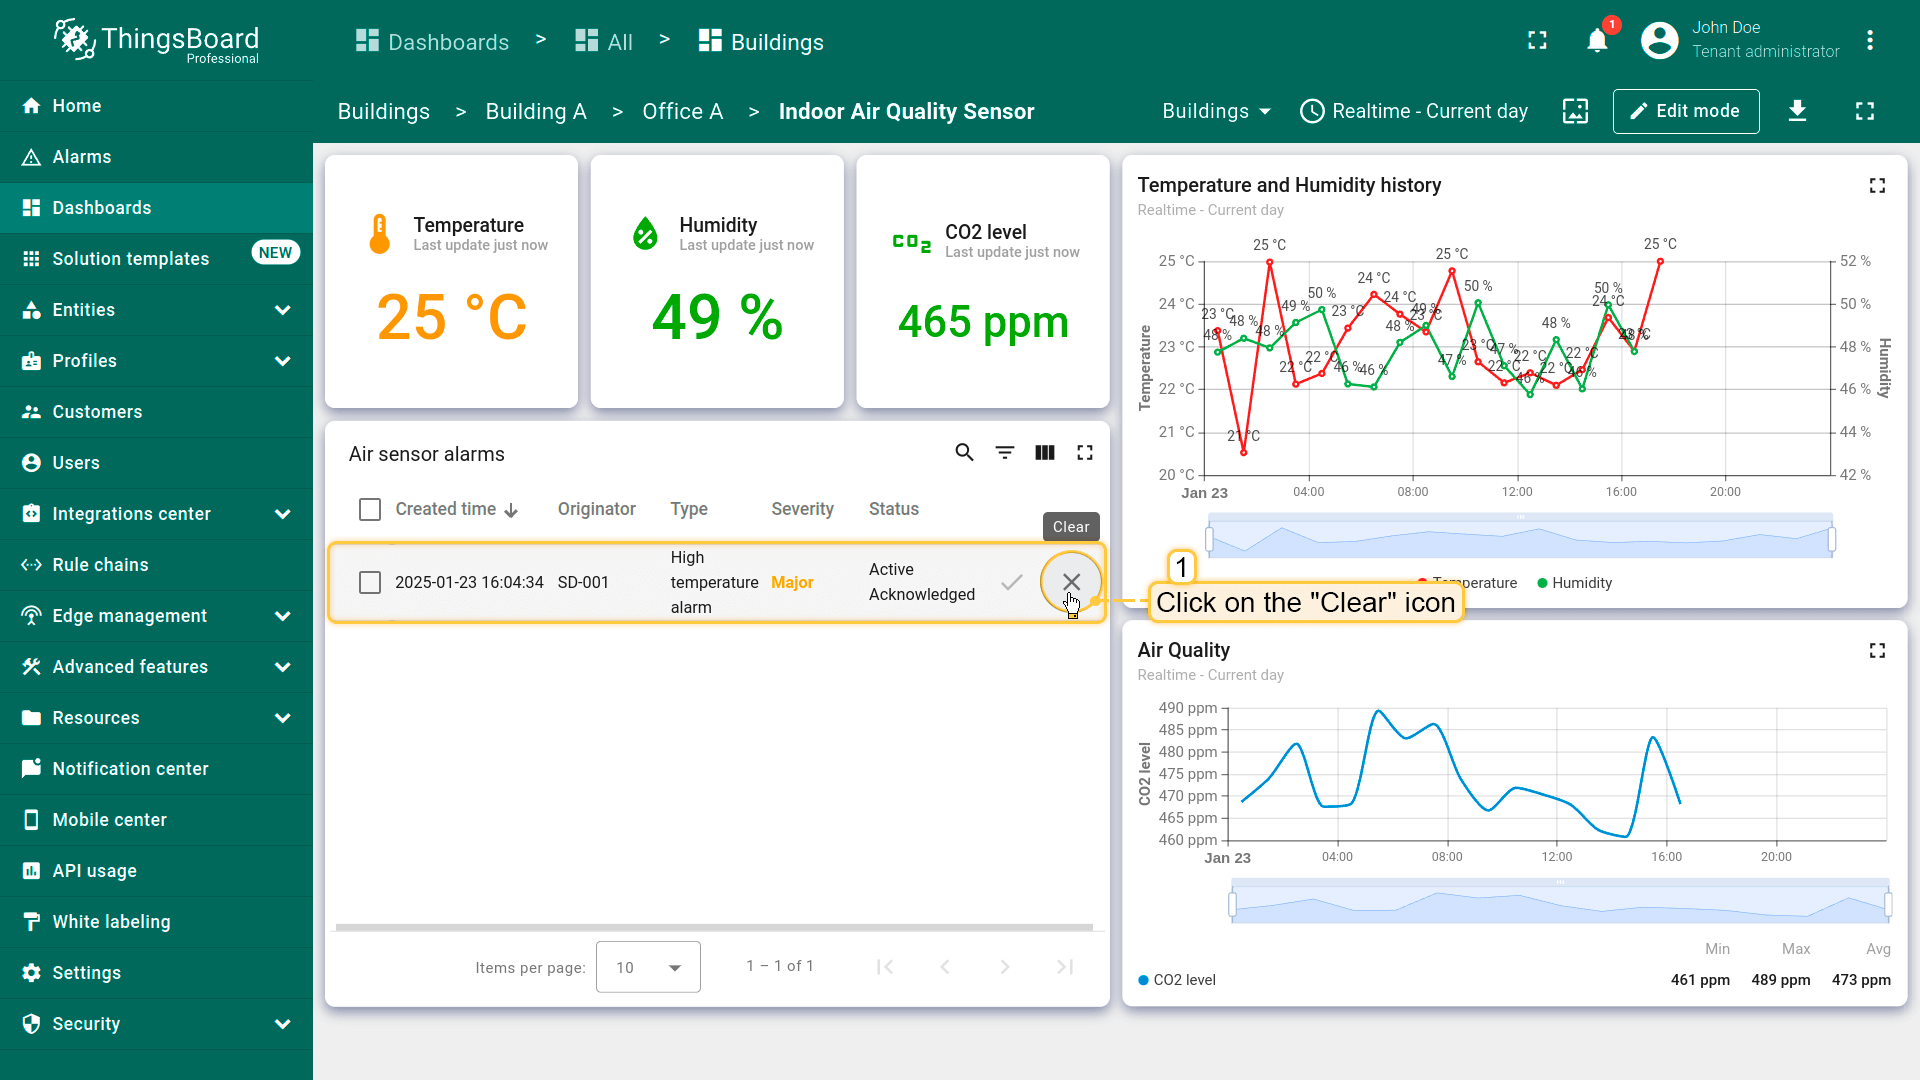
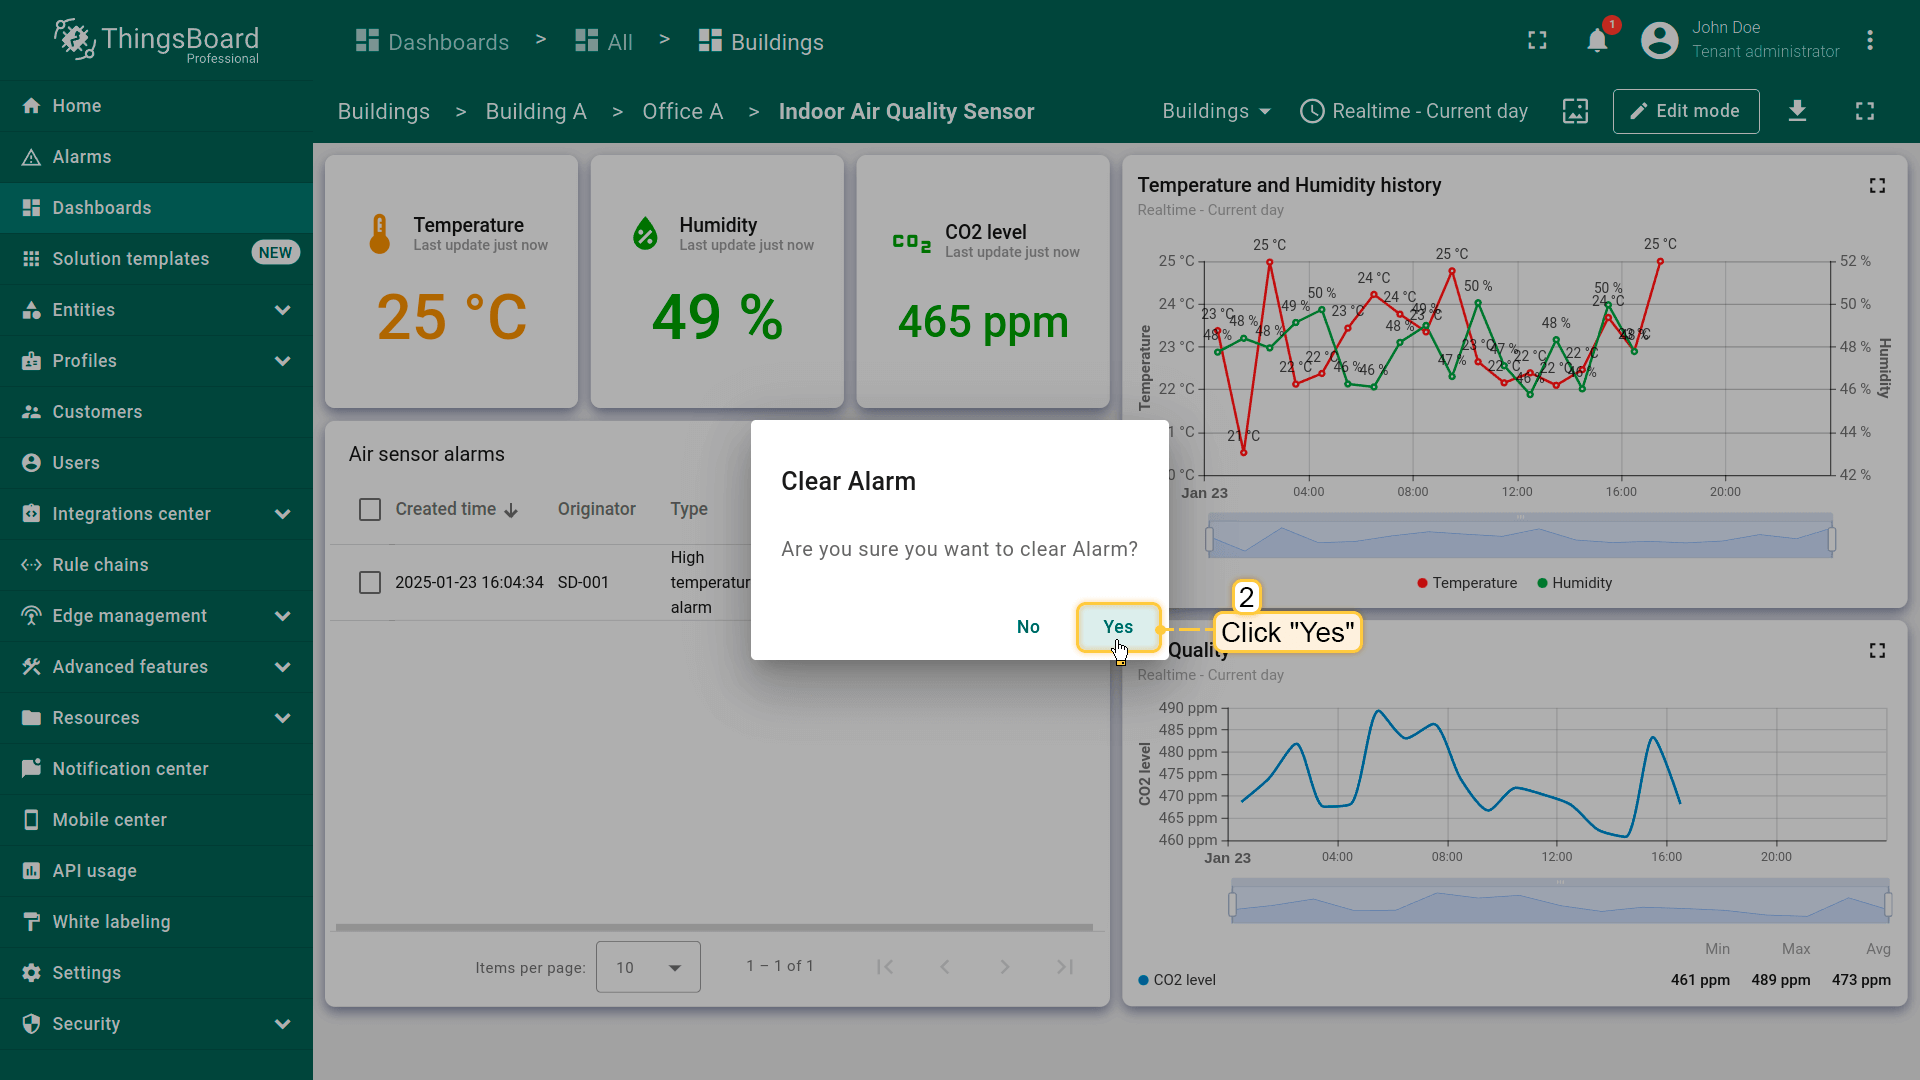
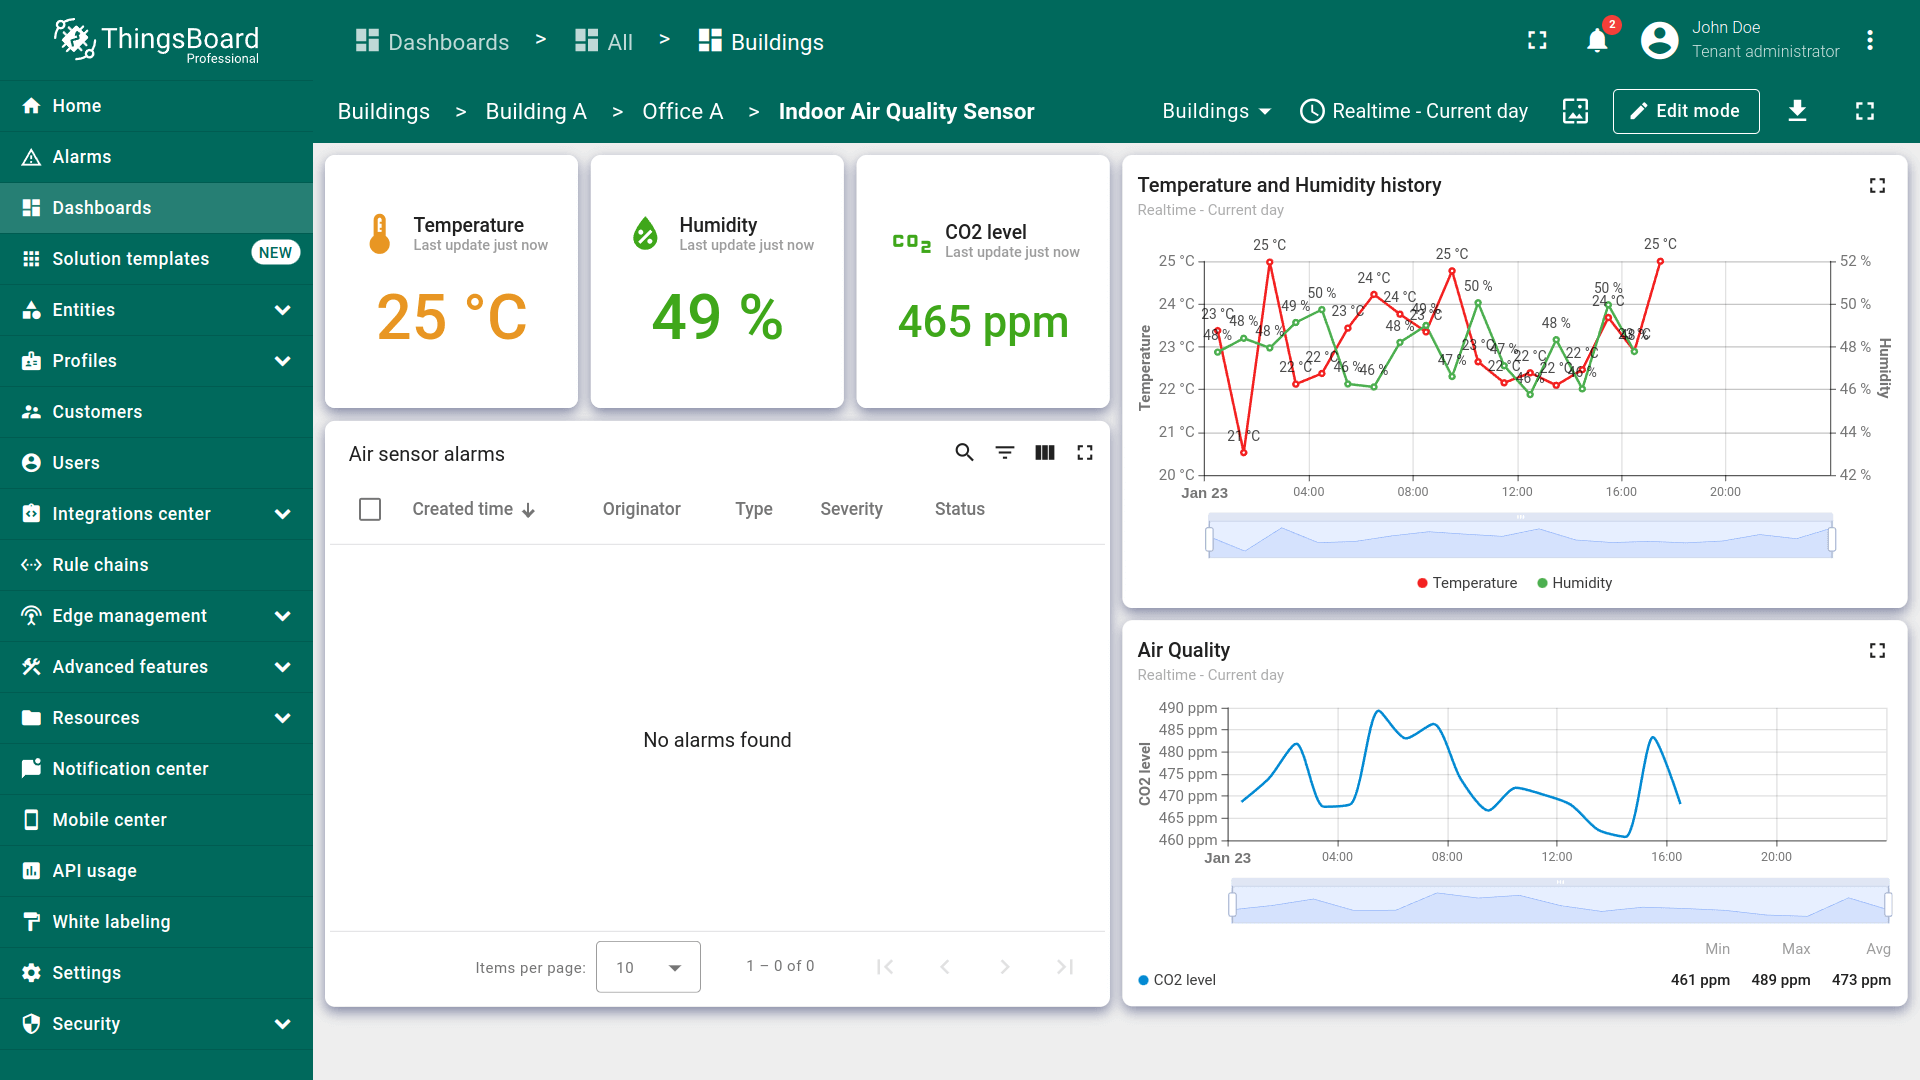
Clear alarm
To clear an alarm, click the “Clear” icon next to the alarm event and confirm the action.
Adding alarm widget to all other states
Next, we will add the alarm widget to each state of the dashboard to monitor alarms that appear on your device at any level of the dashboard.
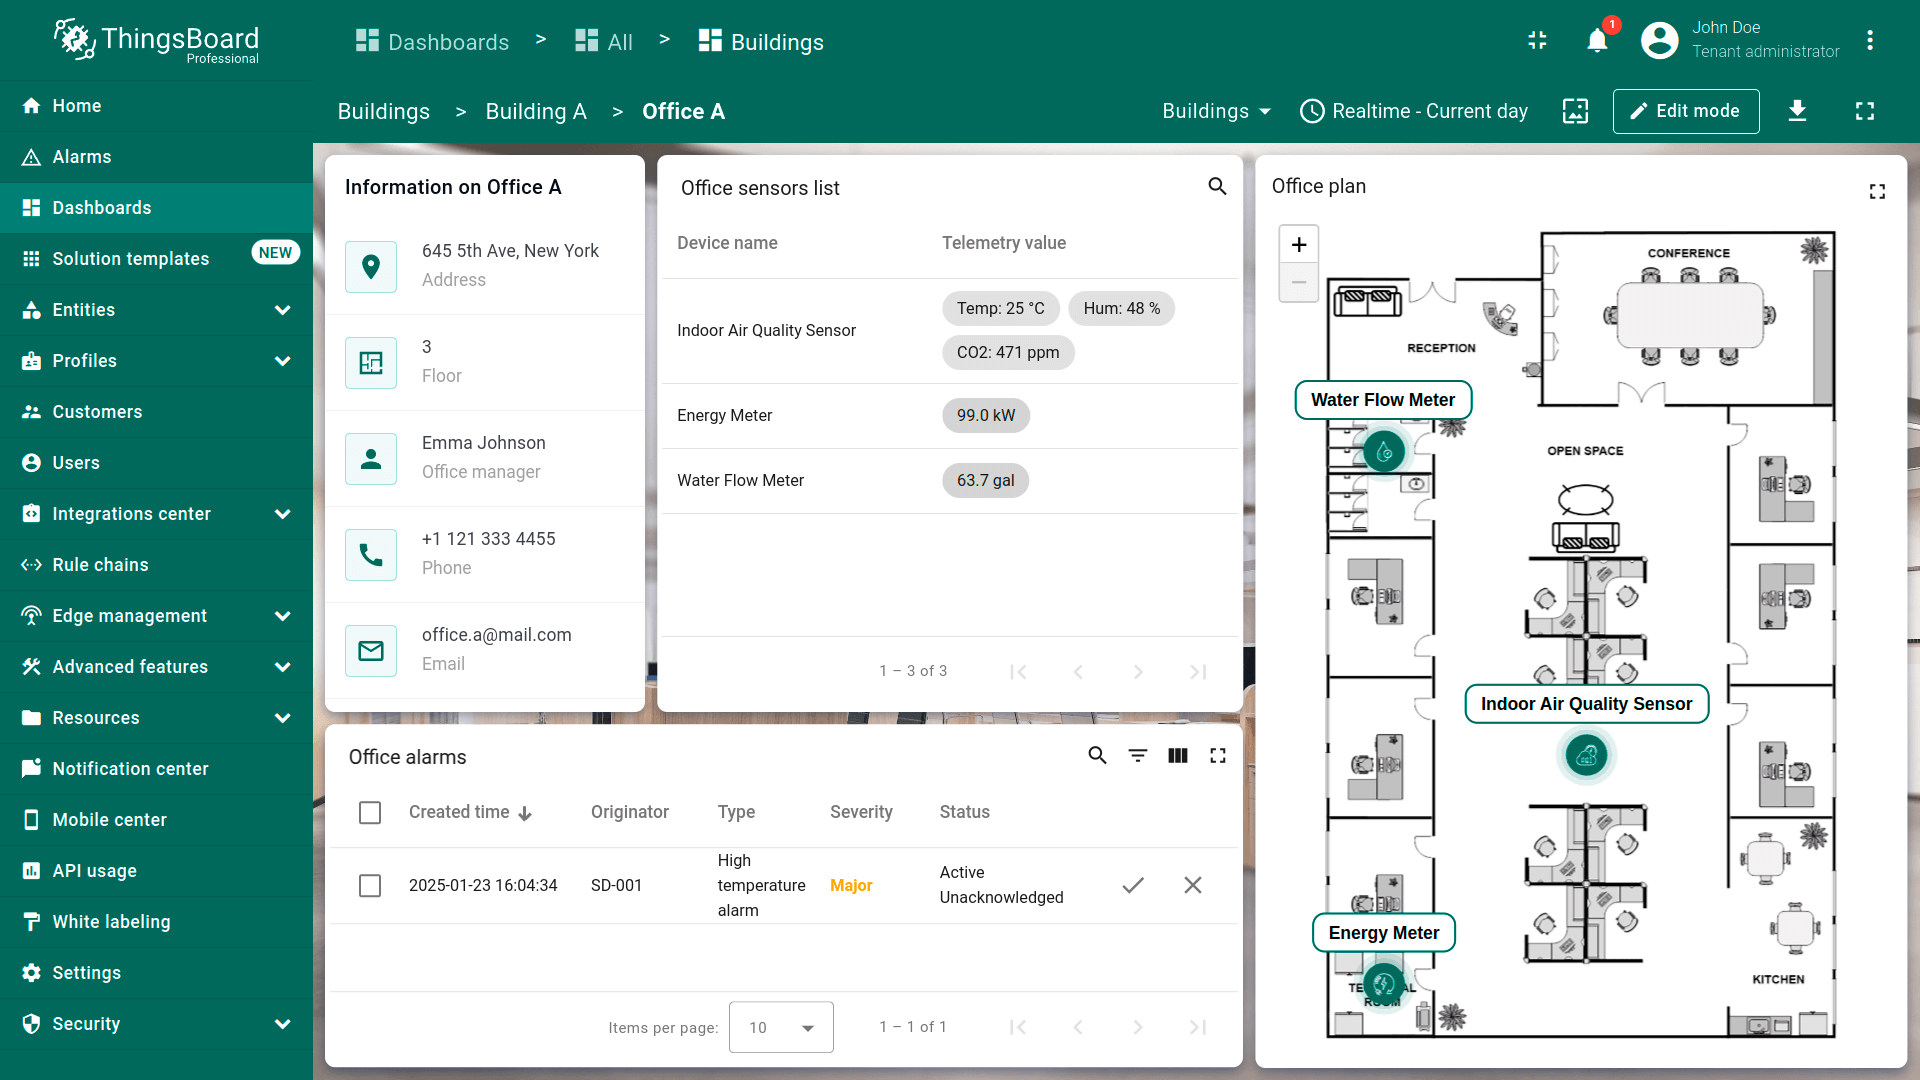
Adding alarm widget to office state
Add an alarm widget to the office state. This widget will display alarms from all devices associated with the selected office. We'll add this widget using the copy method.
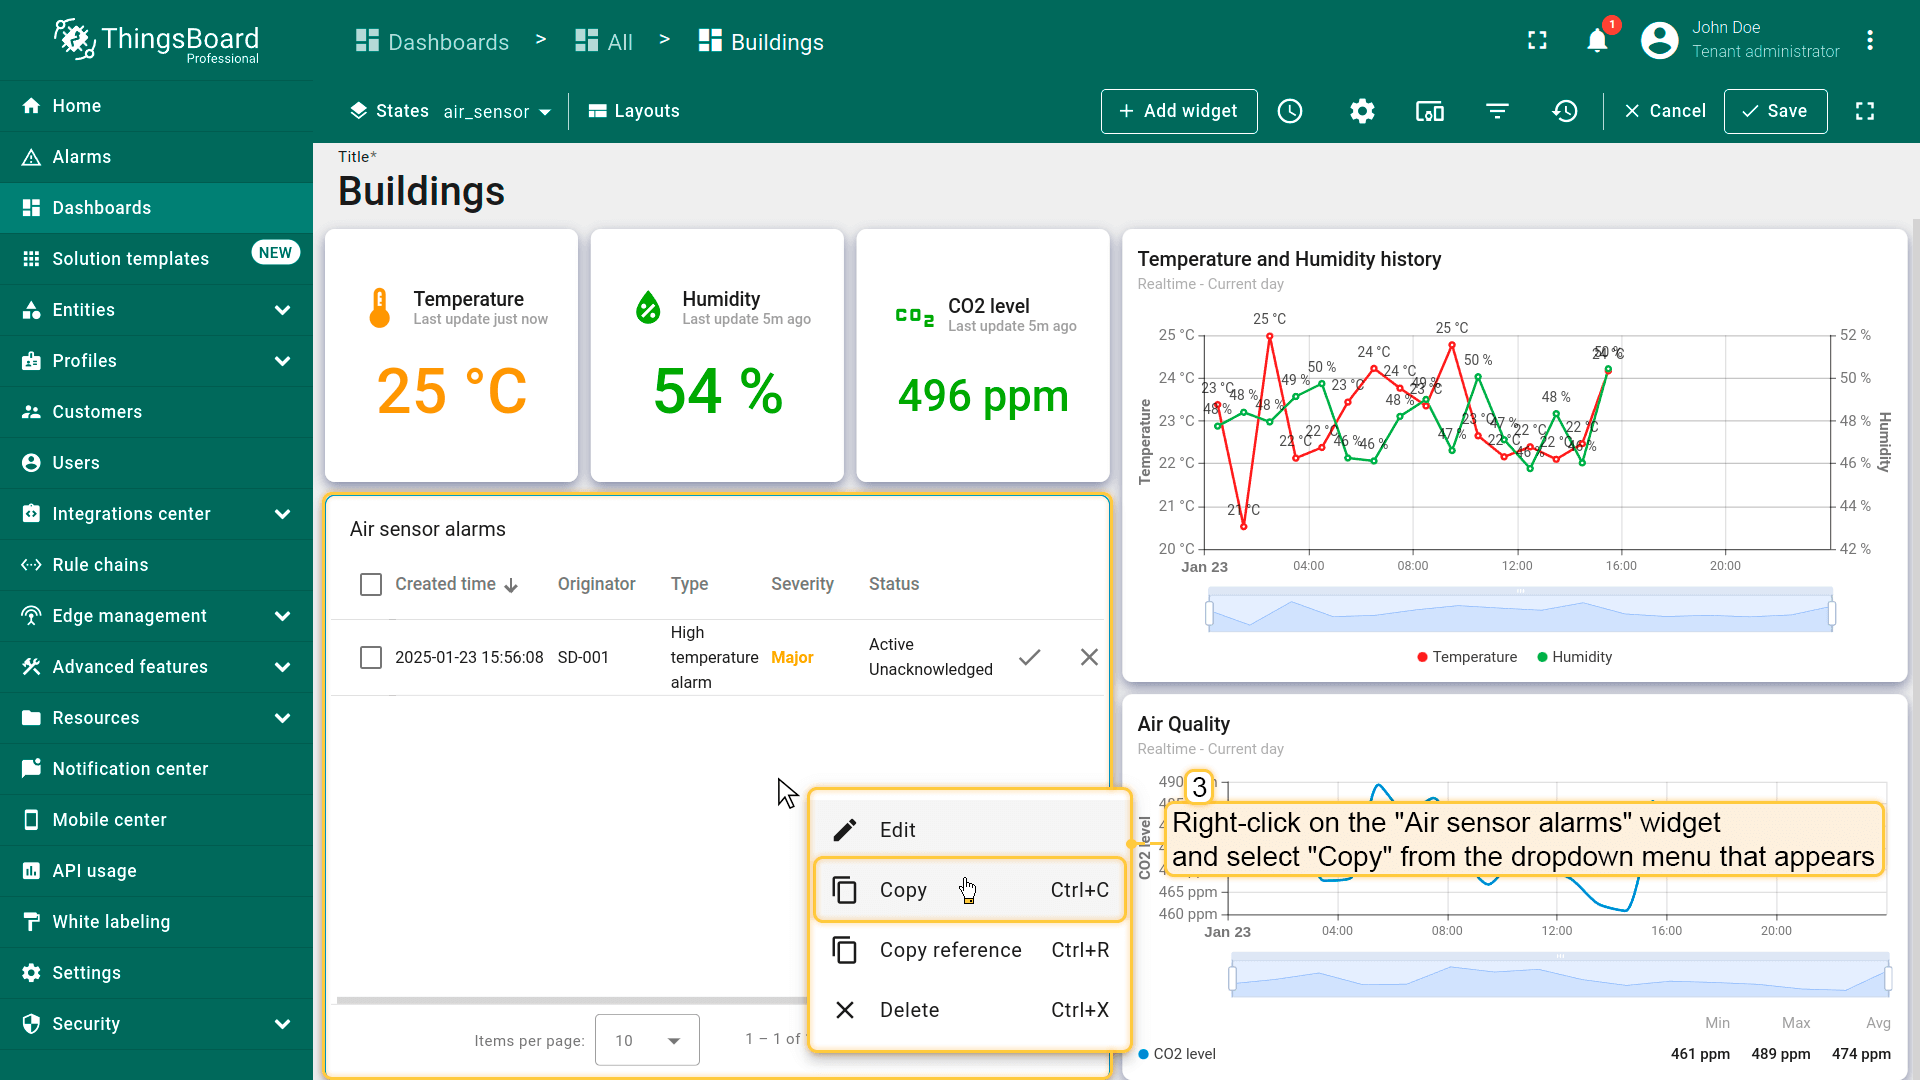
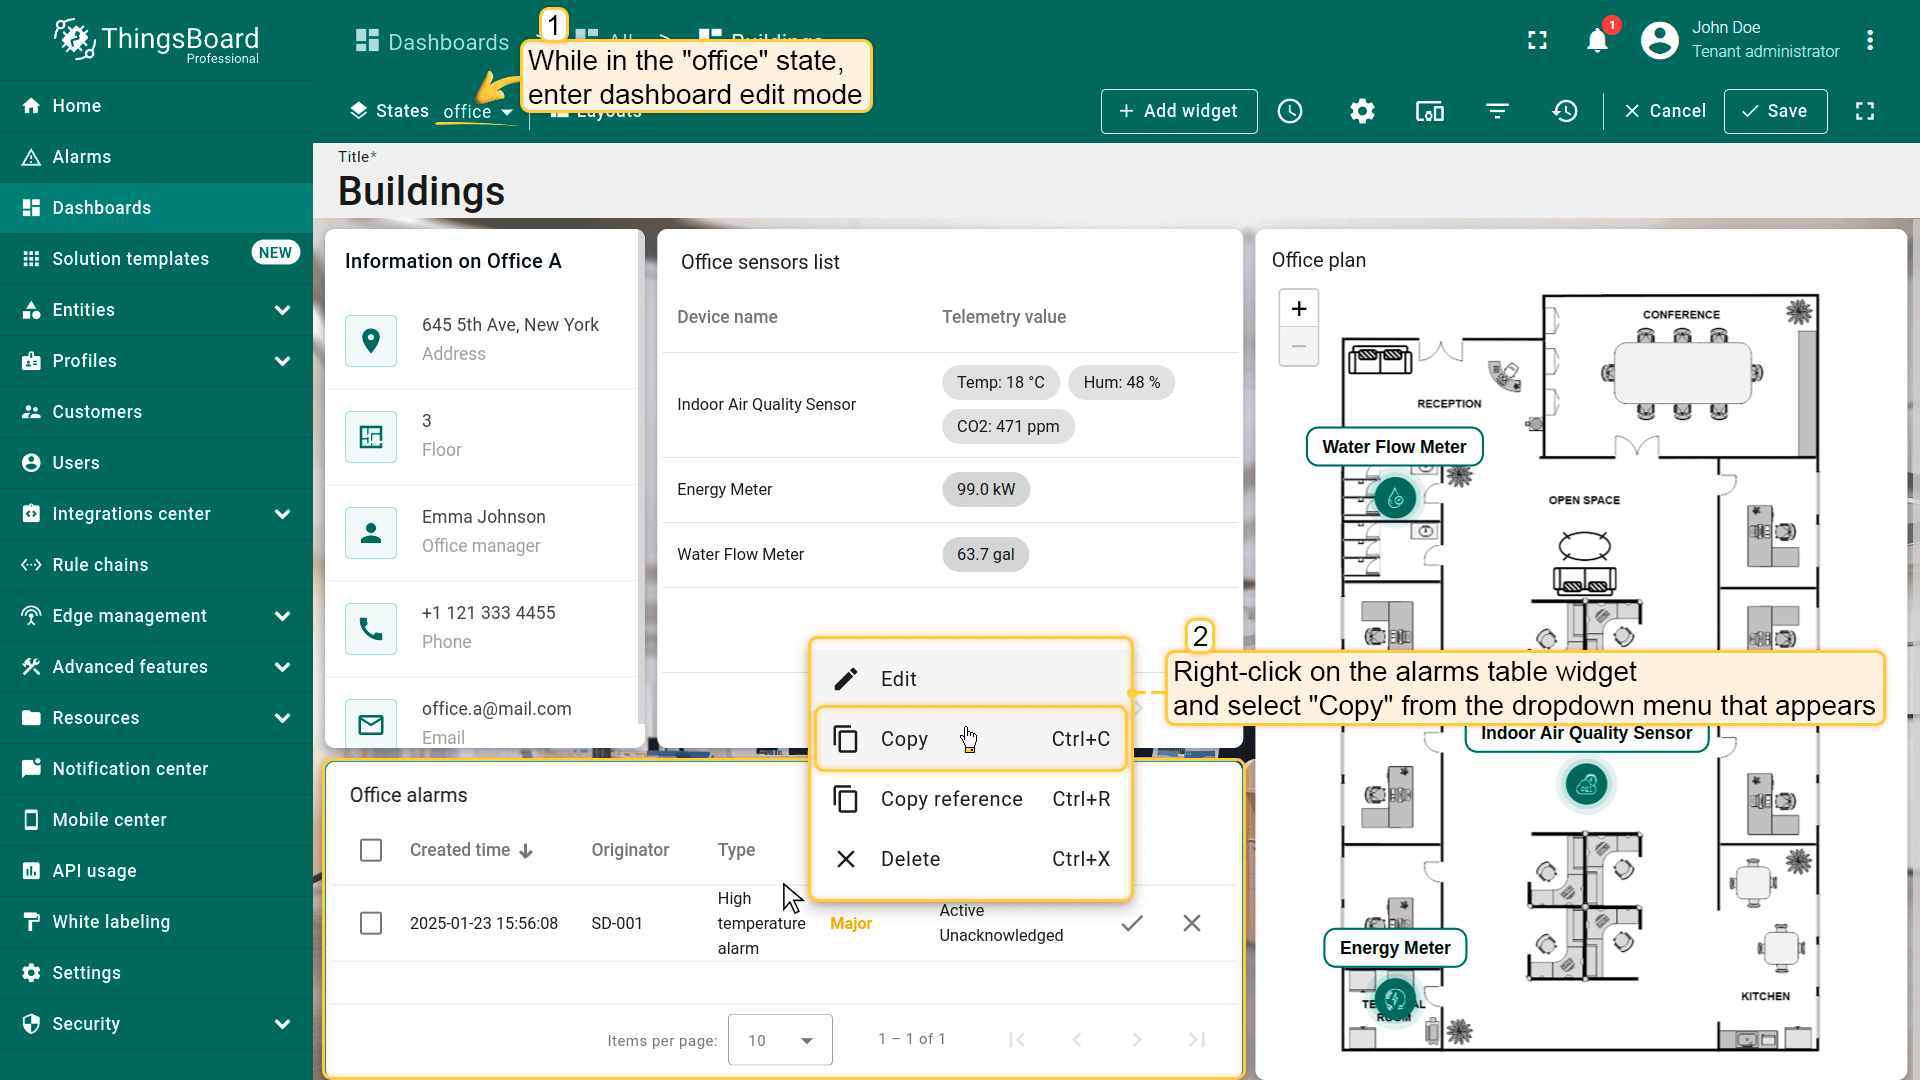
- Go to the air_sensor state, and enter dashboard edit mode;
- Right-click on the alarm widget, and select "Copy" from the dropdown menu;
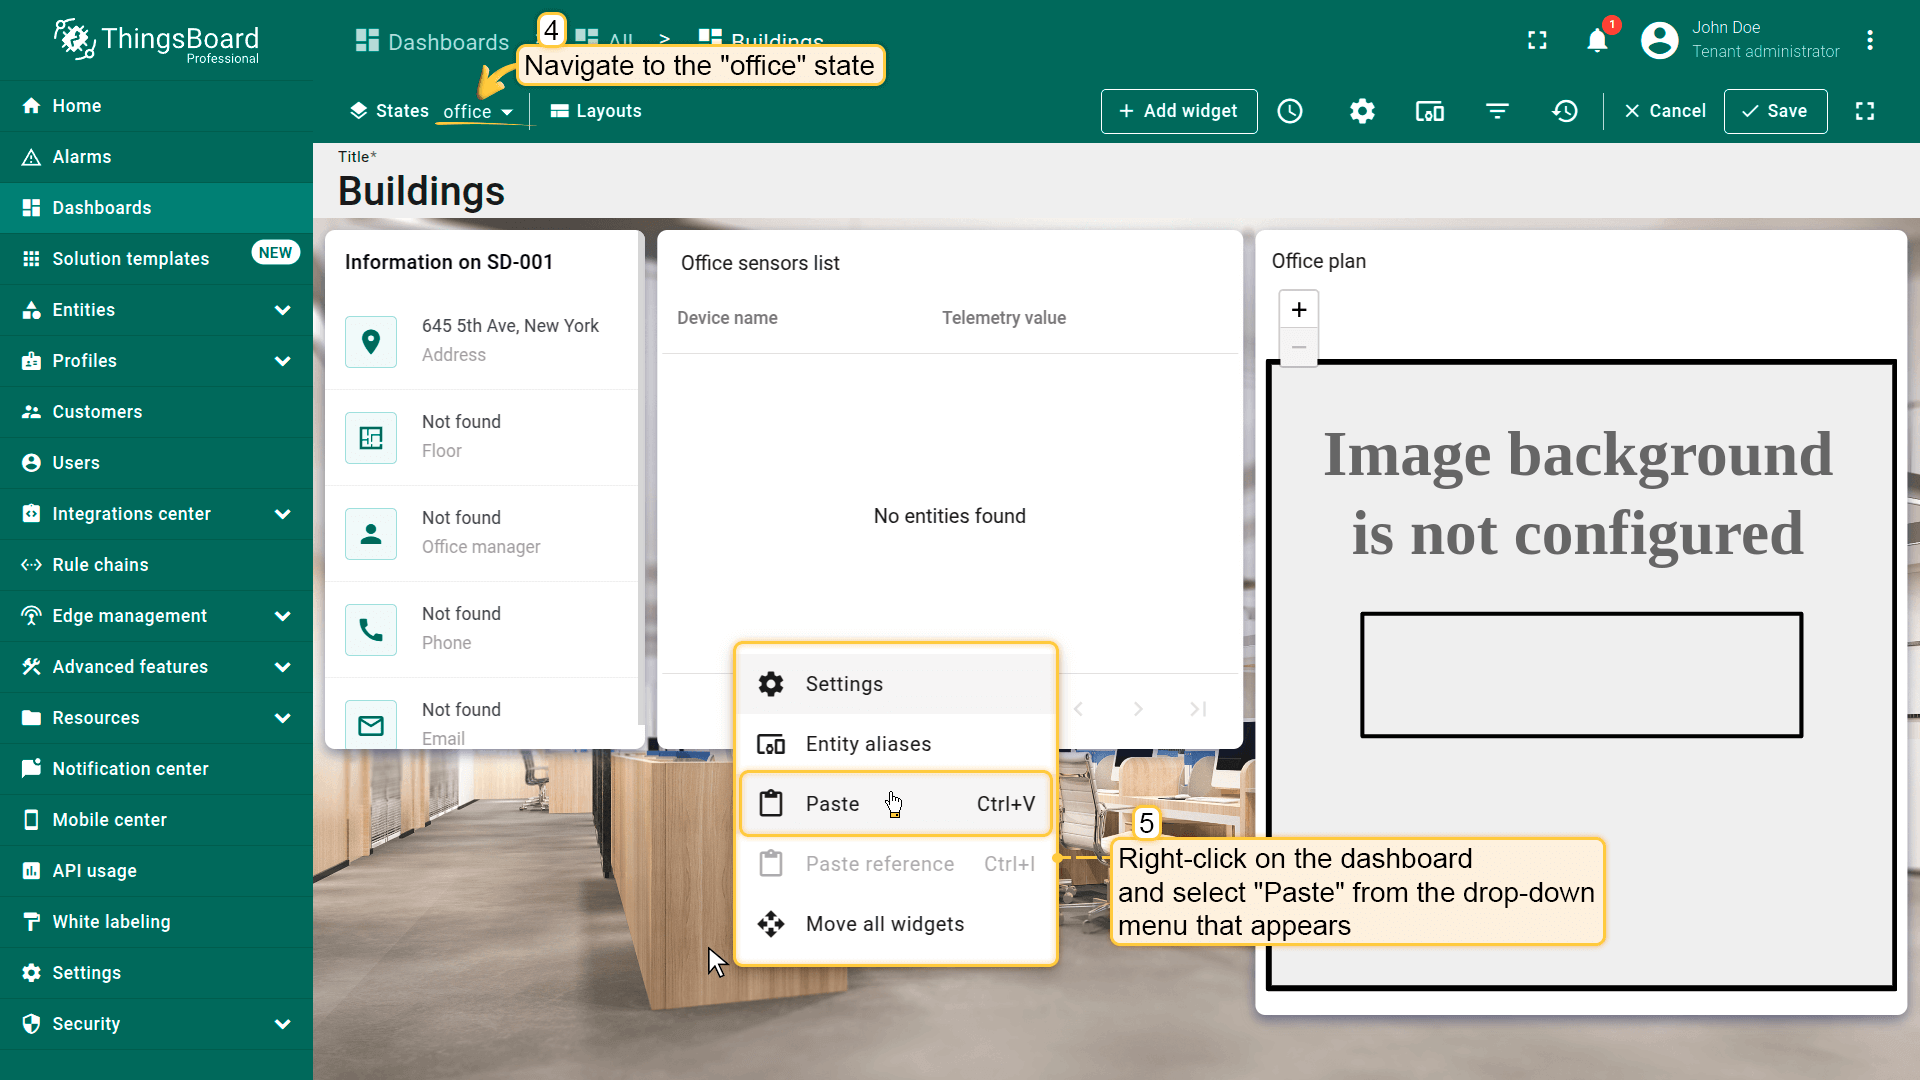
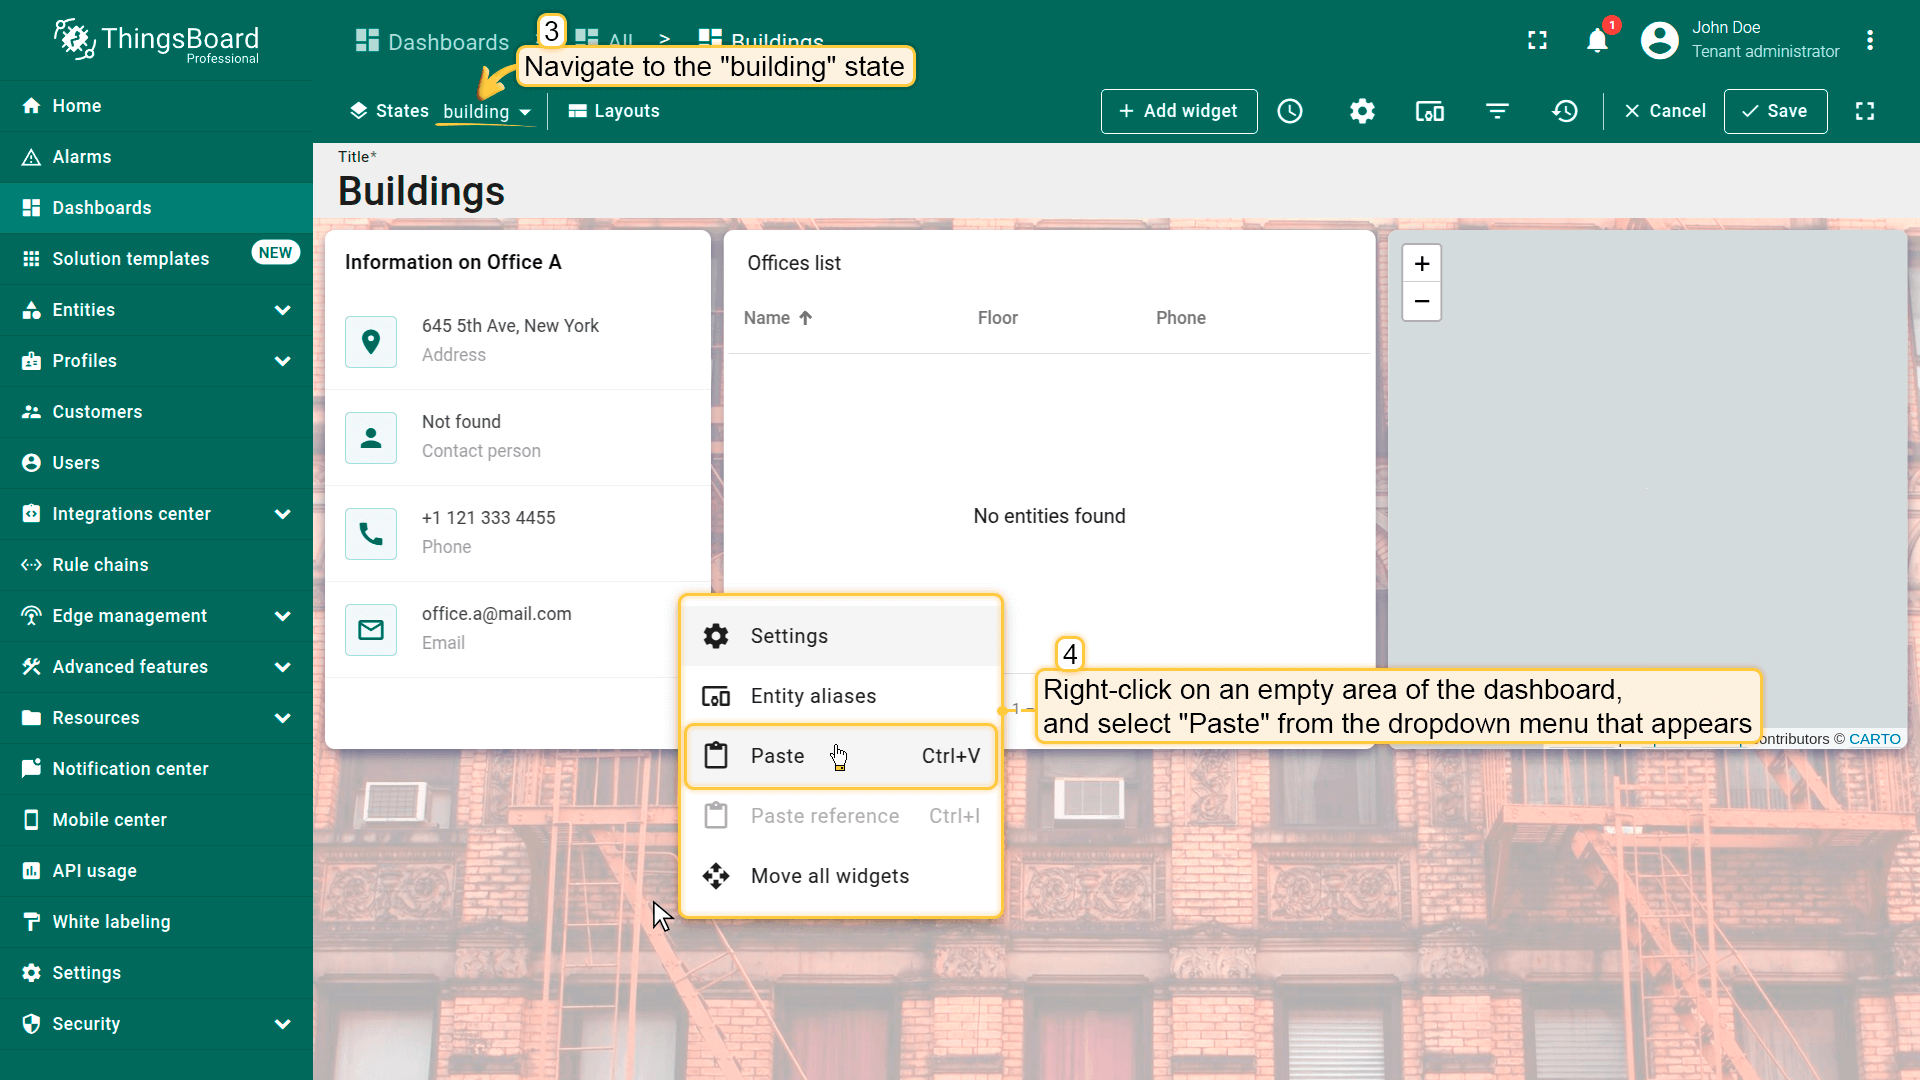
- Navigate to the office state, right-click on an empty area of the dashboard, and select "Paste";
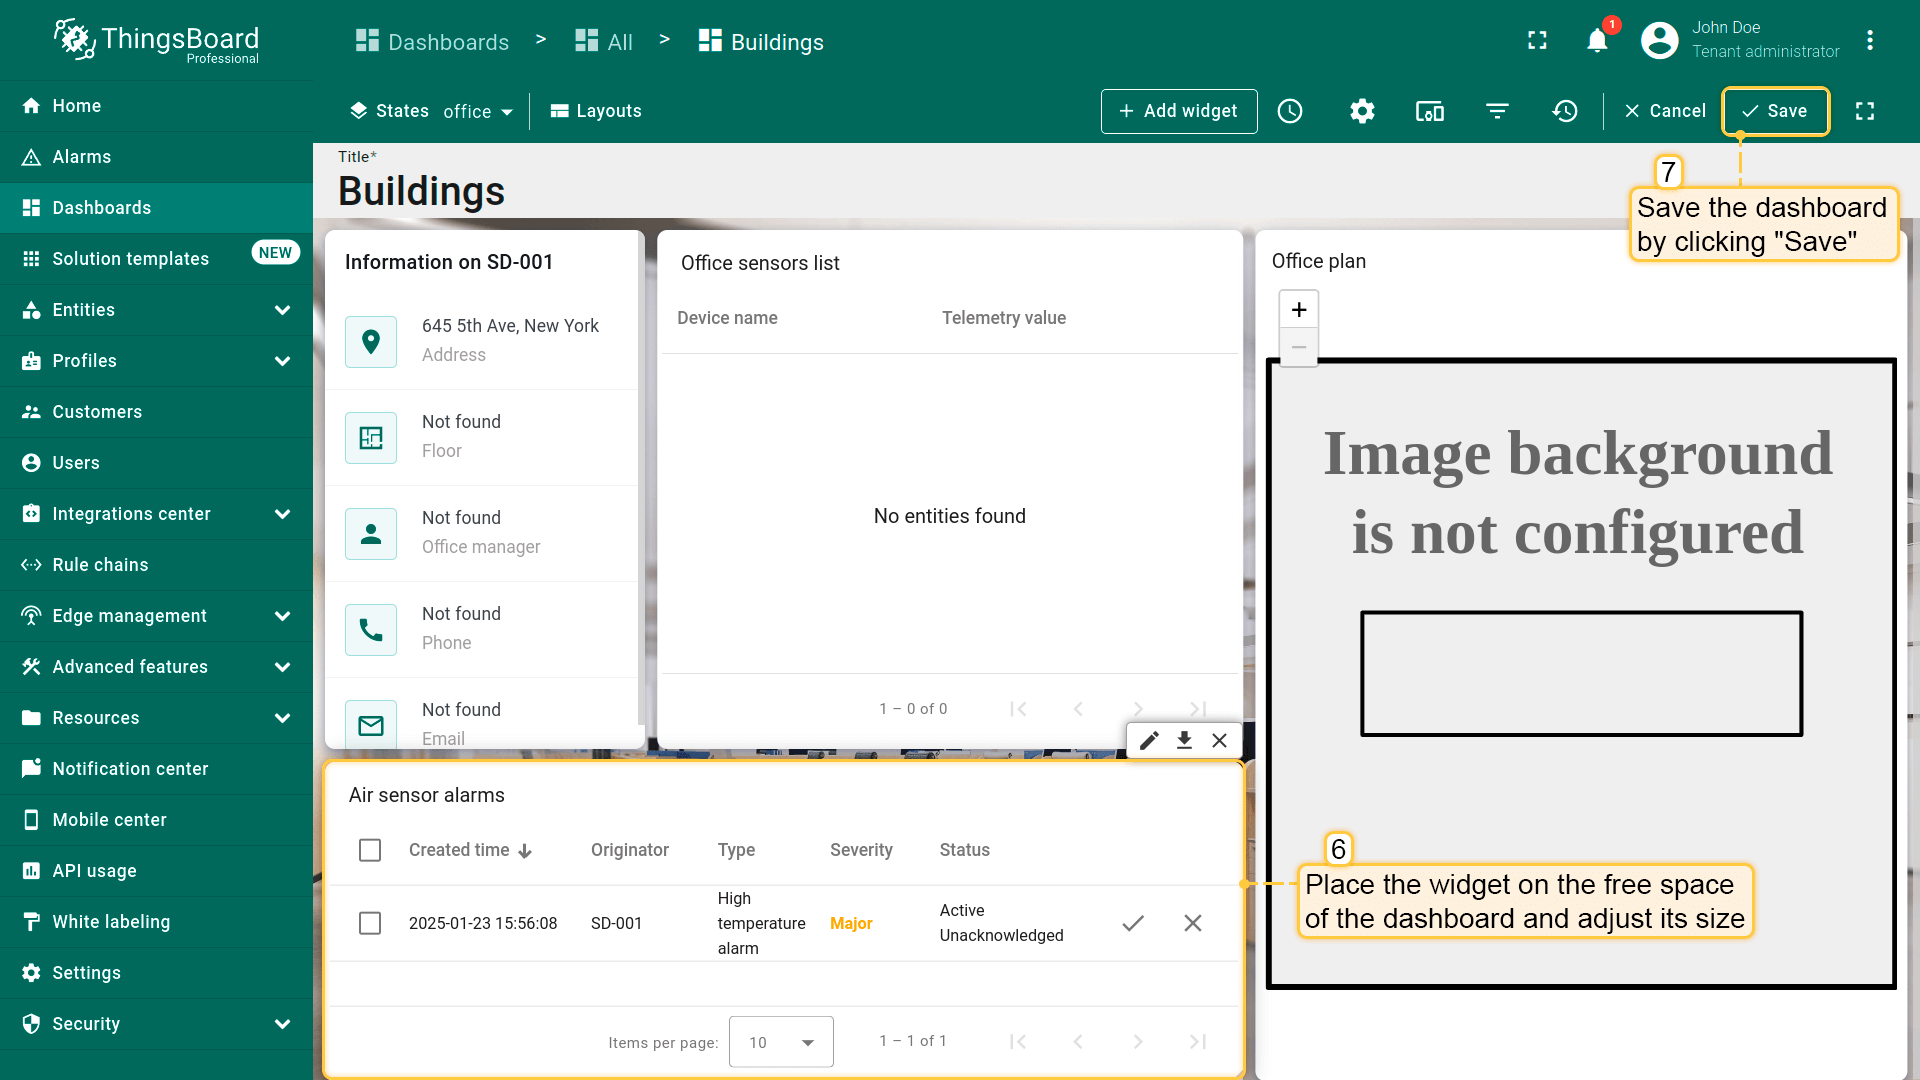
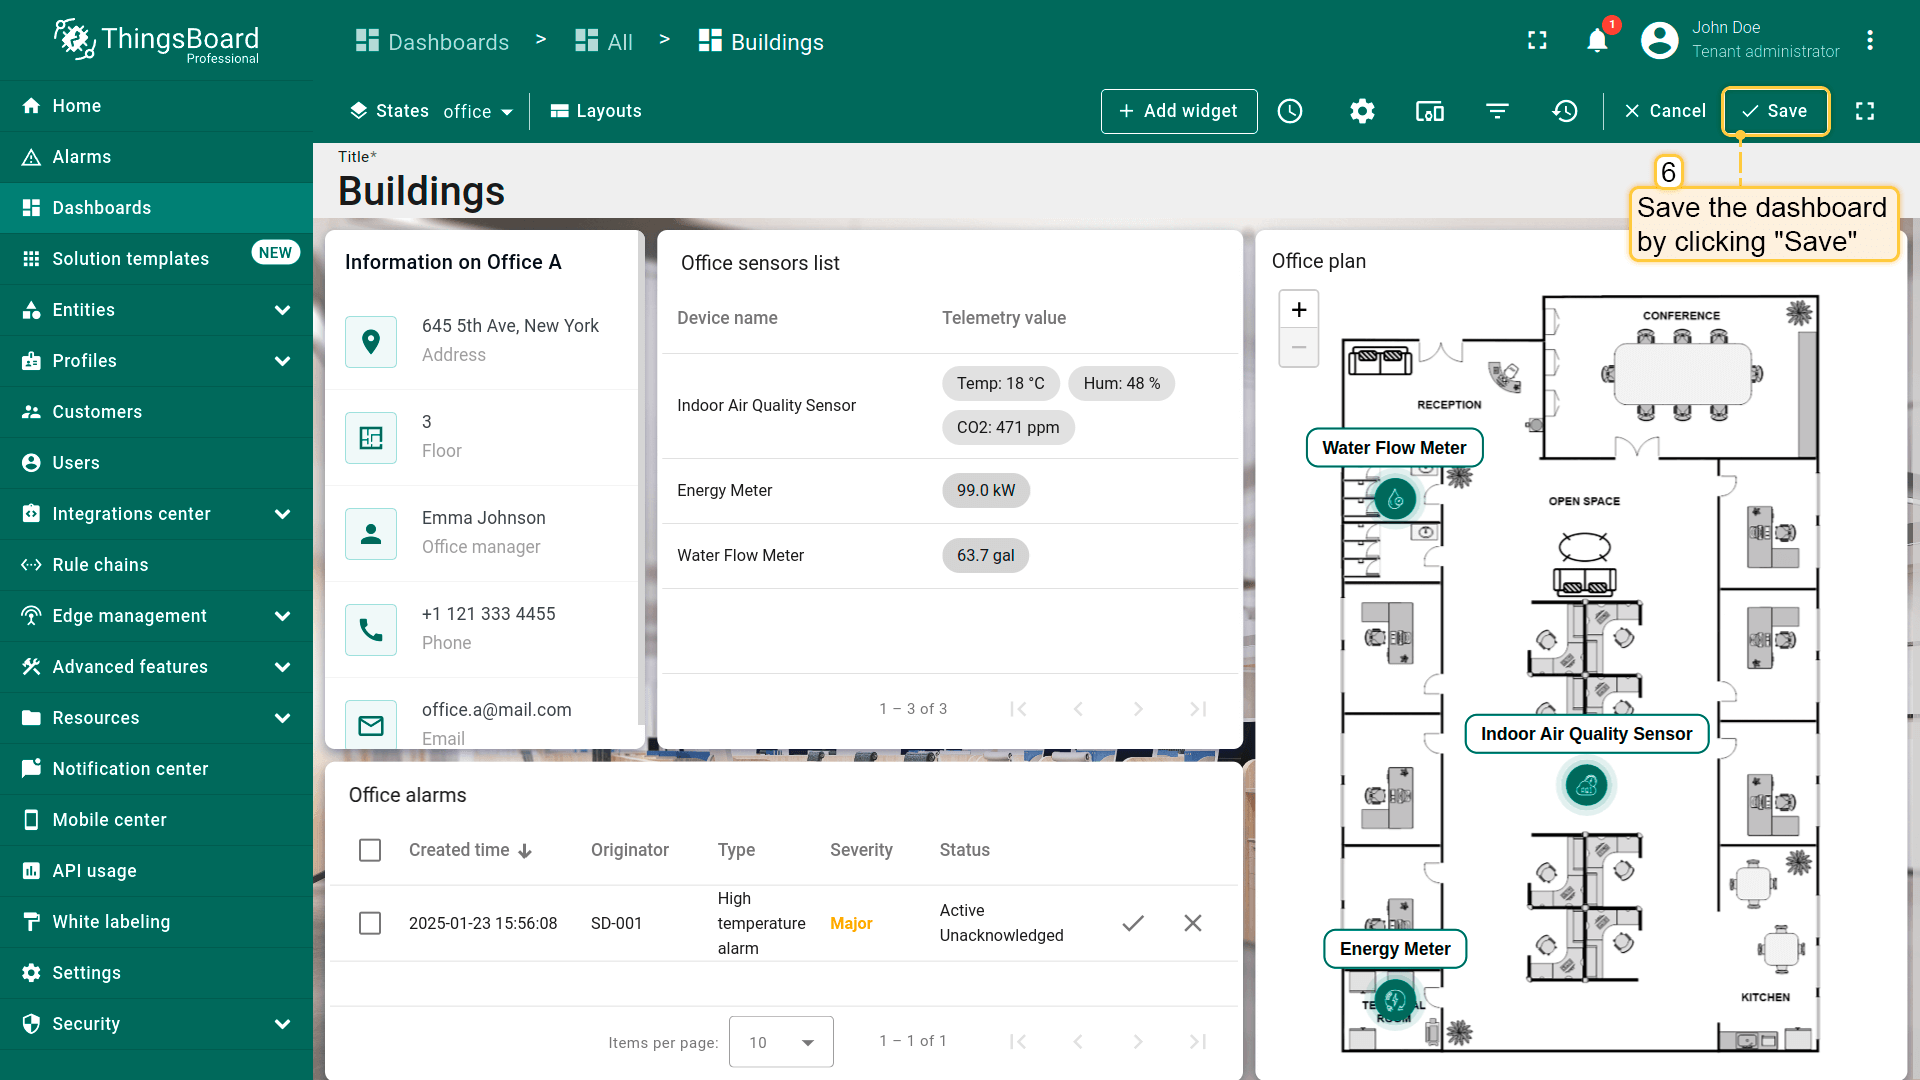
- Place the widget in an empty spot on the dashboard and adjust its size. Then, save the dashboard;
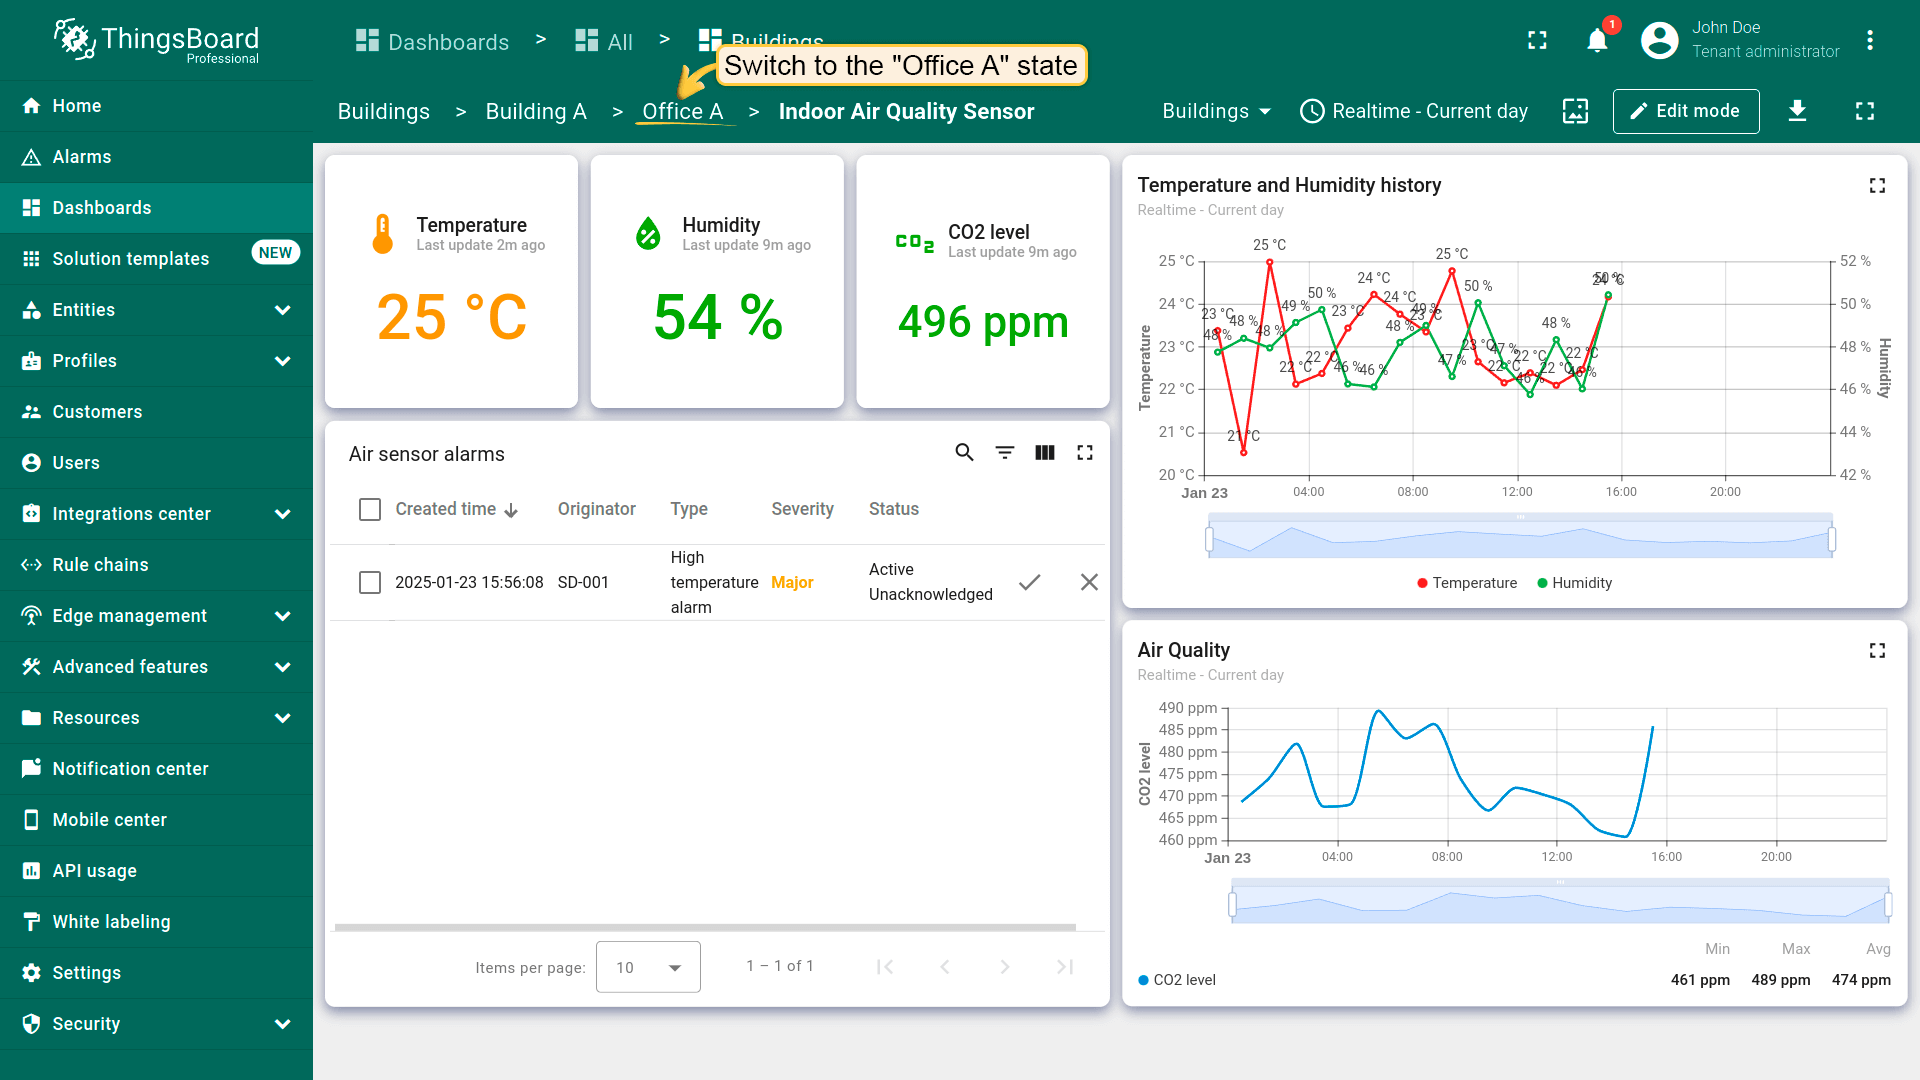
After saving the changes, you will automatically be redirected to the air_sensor state. Switch to the Office A state to check the result.
As you may notice, active alarms are not displayed in the widget. This happens because the “Office A” entity is currently selected, while the alarm was created on a device that has a relationship with this office. Previously, in the alarm rule, we specified that the alarm should propagate to related entities.
Now we need to configure the widget to search for and display alarms for both the selected entity and its child entities, provided that relationships exist between them:
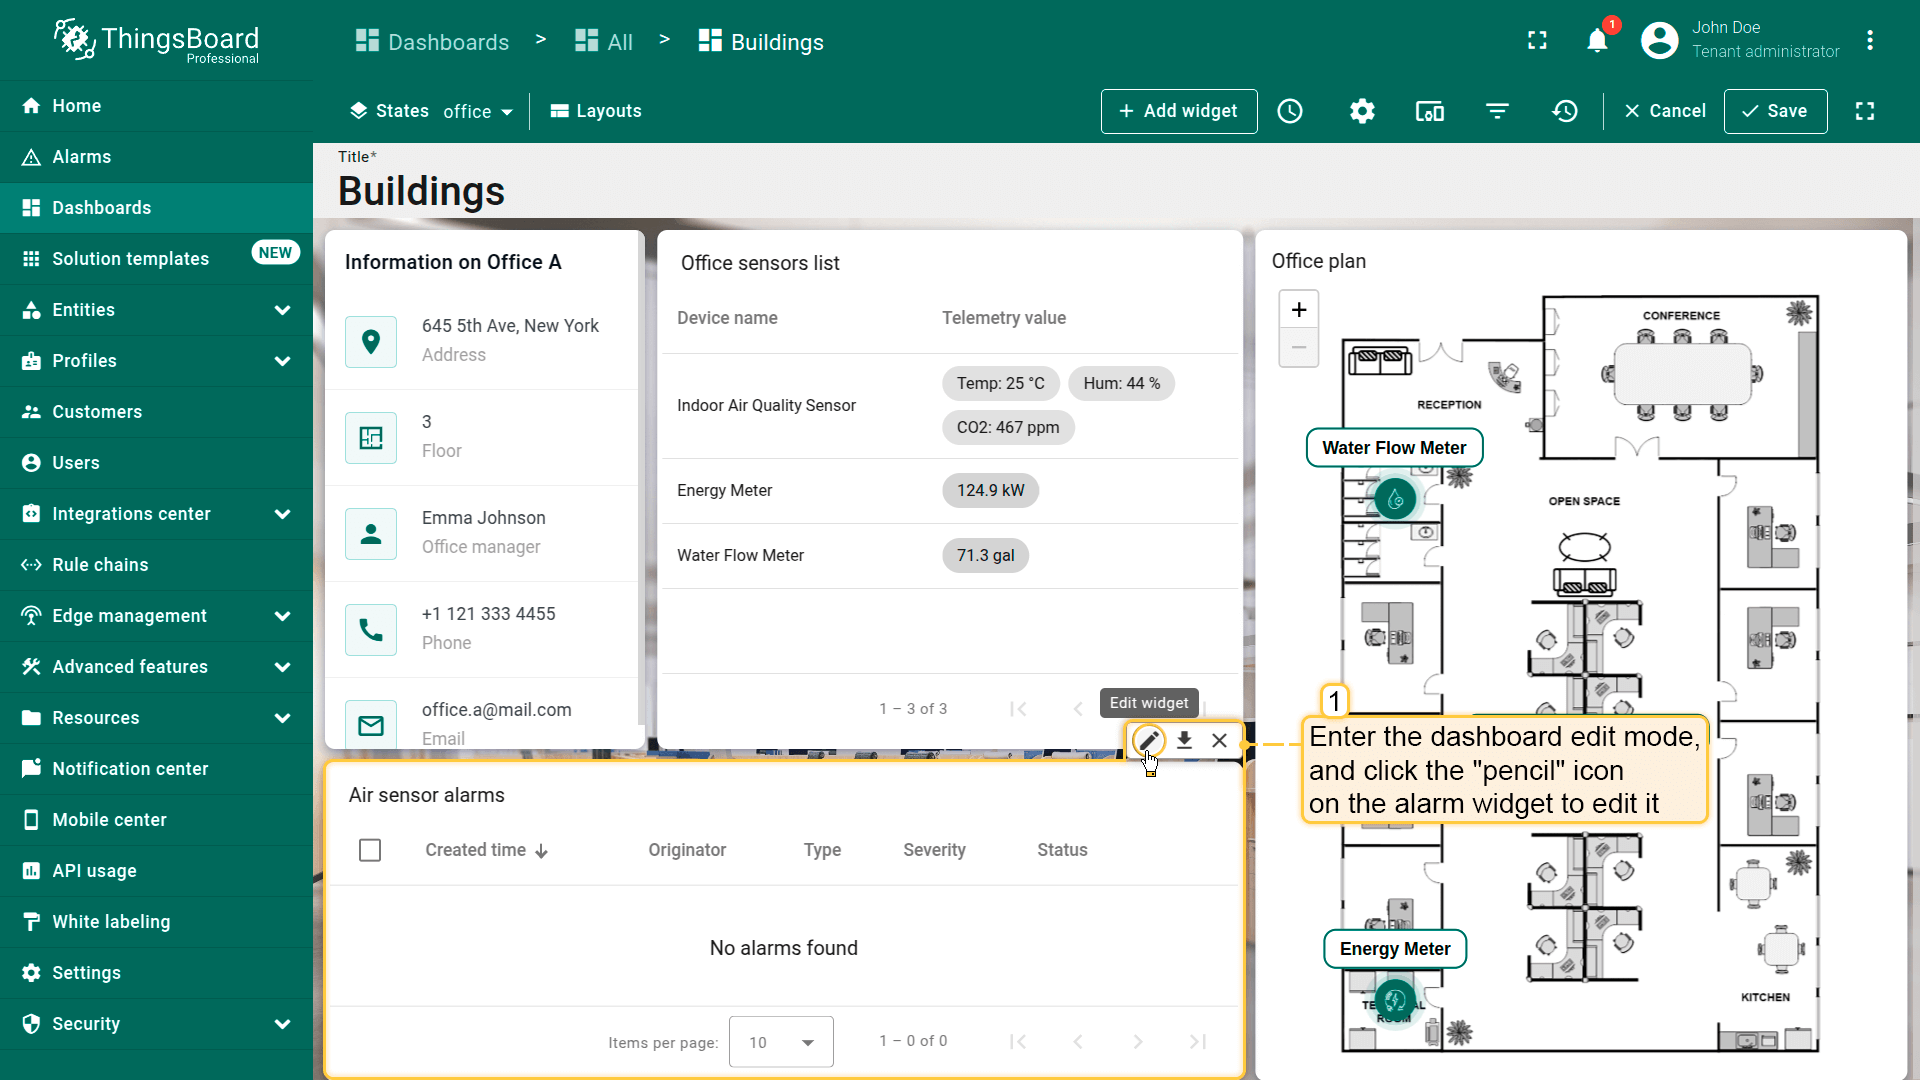
- Enter the dashboard edit mode and click the "pencil" icon on the alarm widget to edit it;
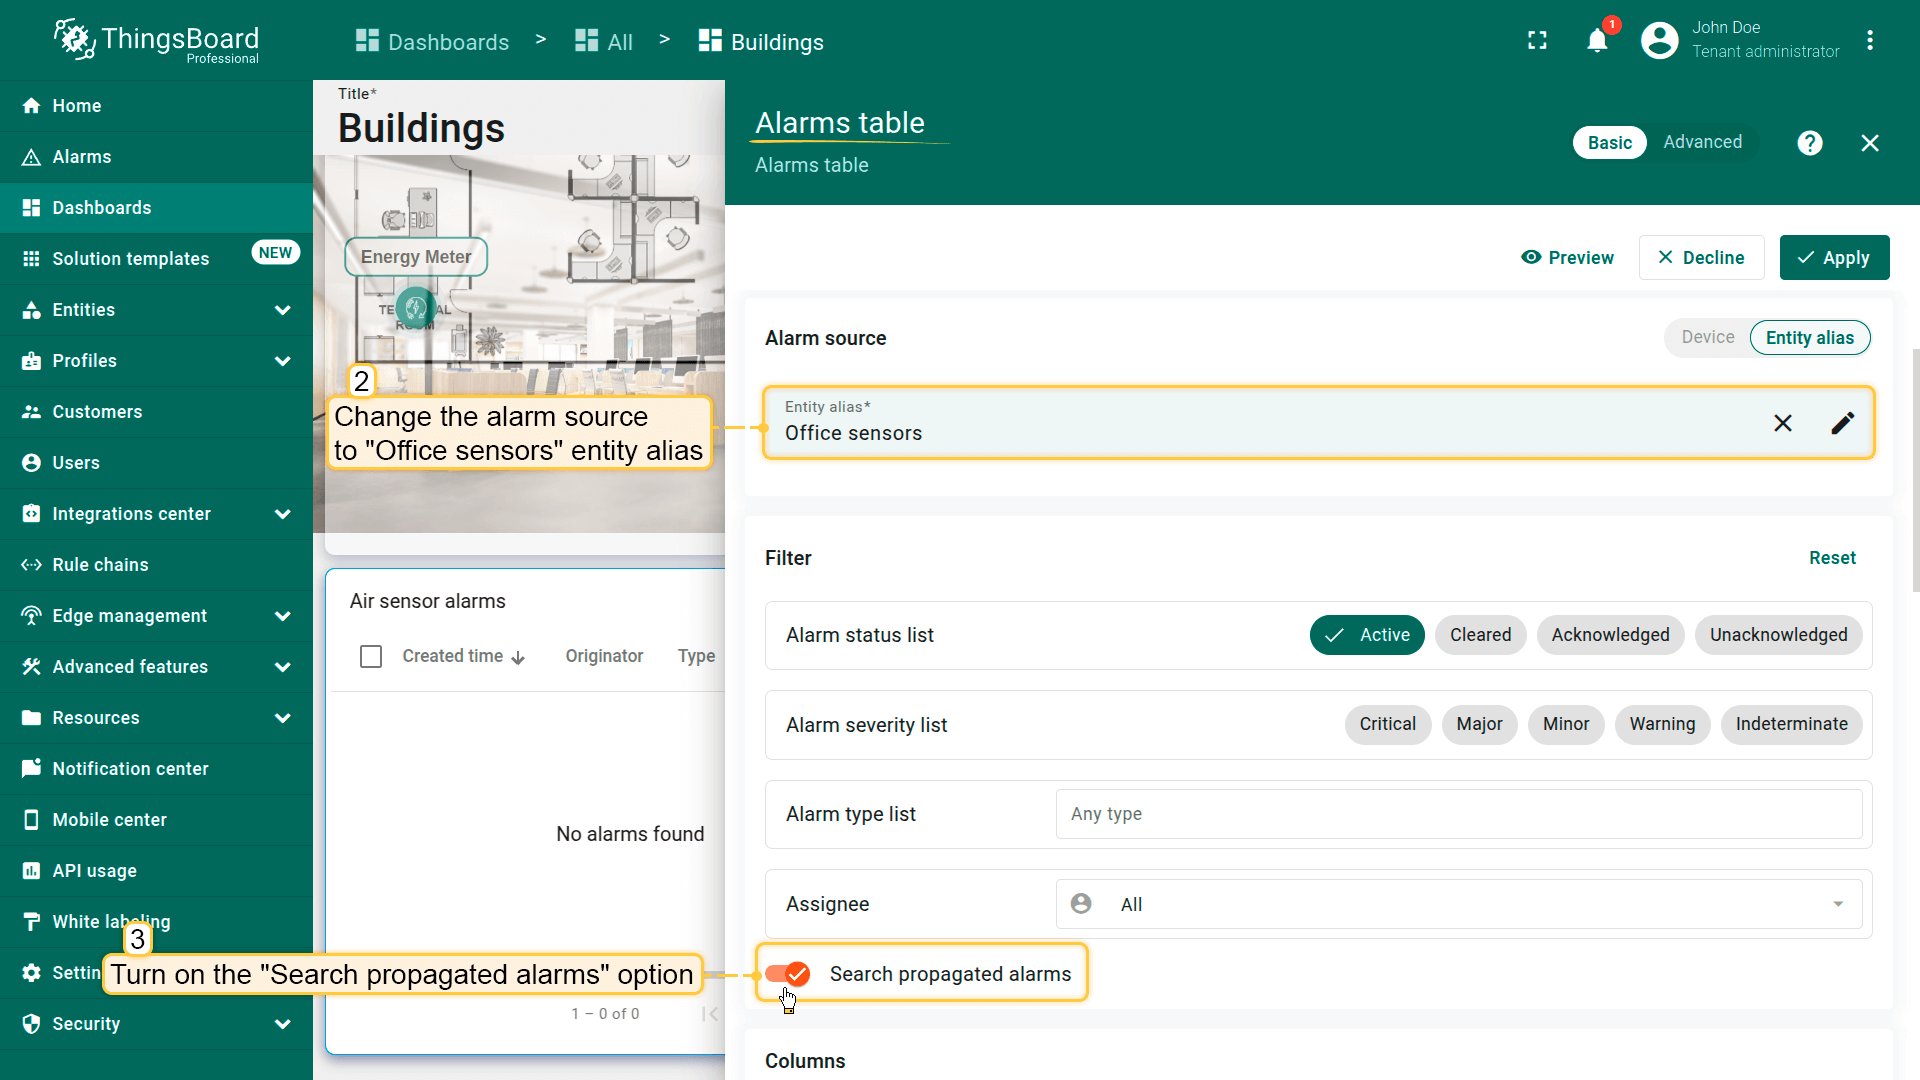
- Change the alarms source to "Office sensors" entity alias. Turn on the "Search propagated alarms" option. This option enables displaying alarms for both the selected entity and its child entities, provided that relationships exist between them;
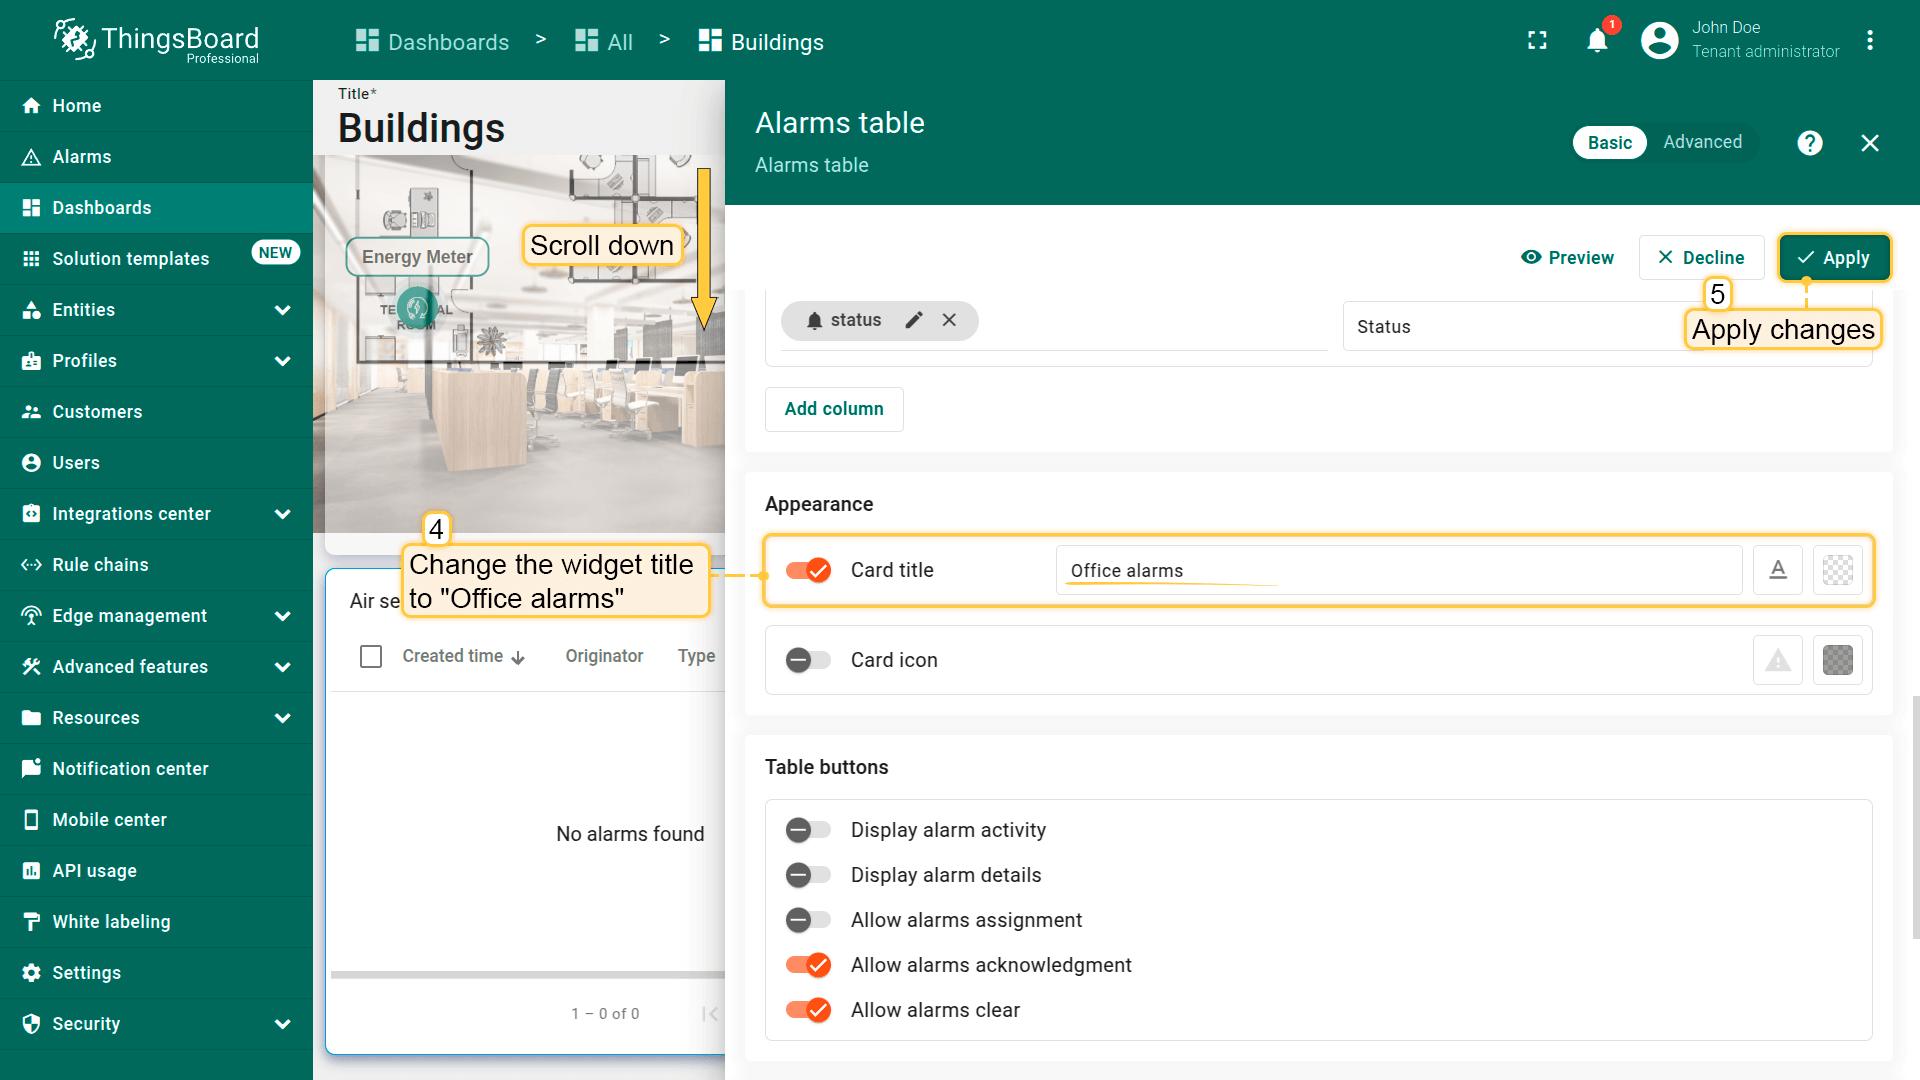
- Change the widget title to "Office alarms". Then, apply the changes;
- Save the dashboard.
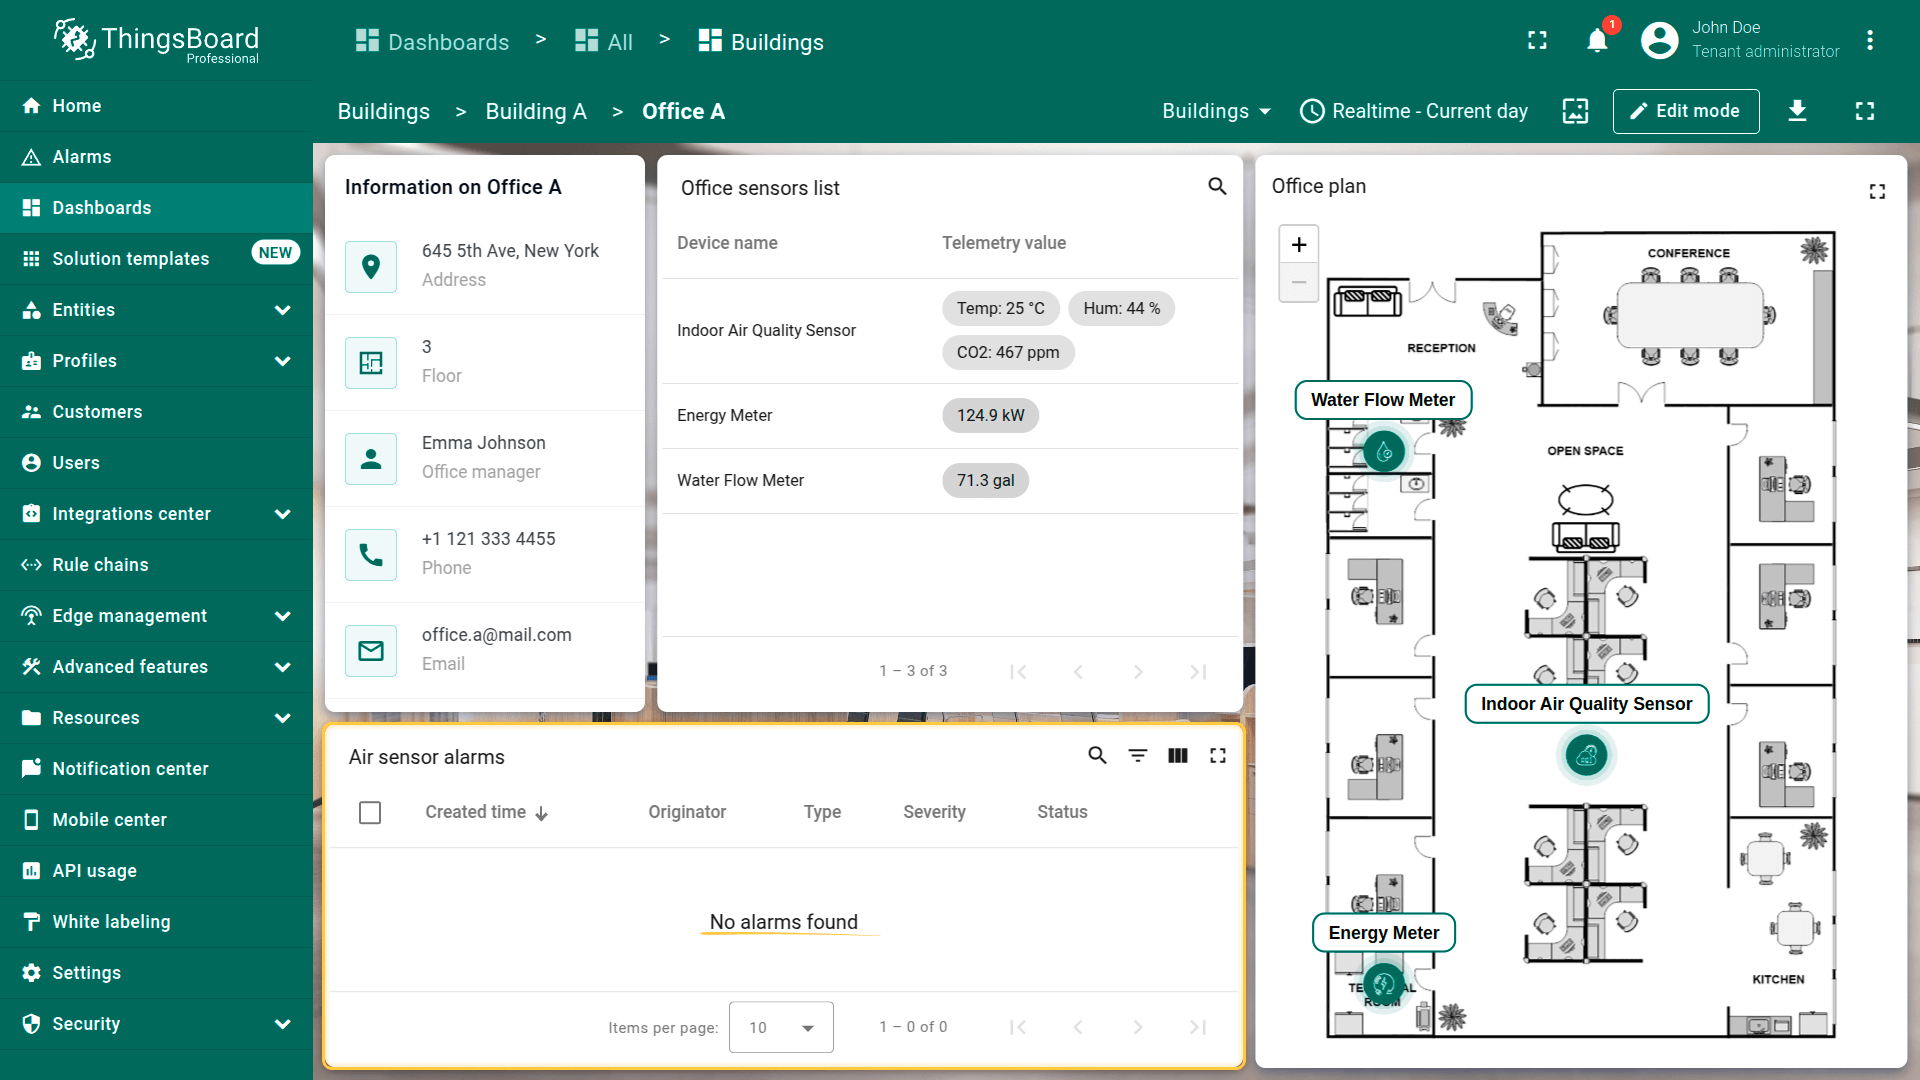
Now, as you can see, the widget displays the alarms of the devices that have a relation to the selected office.

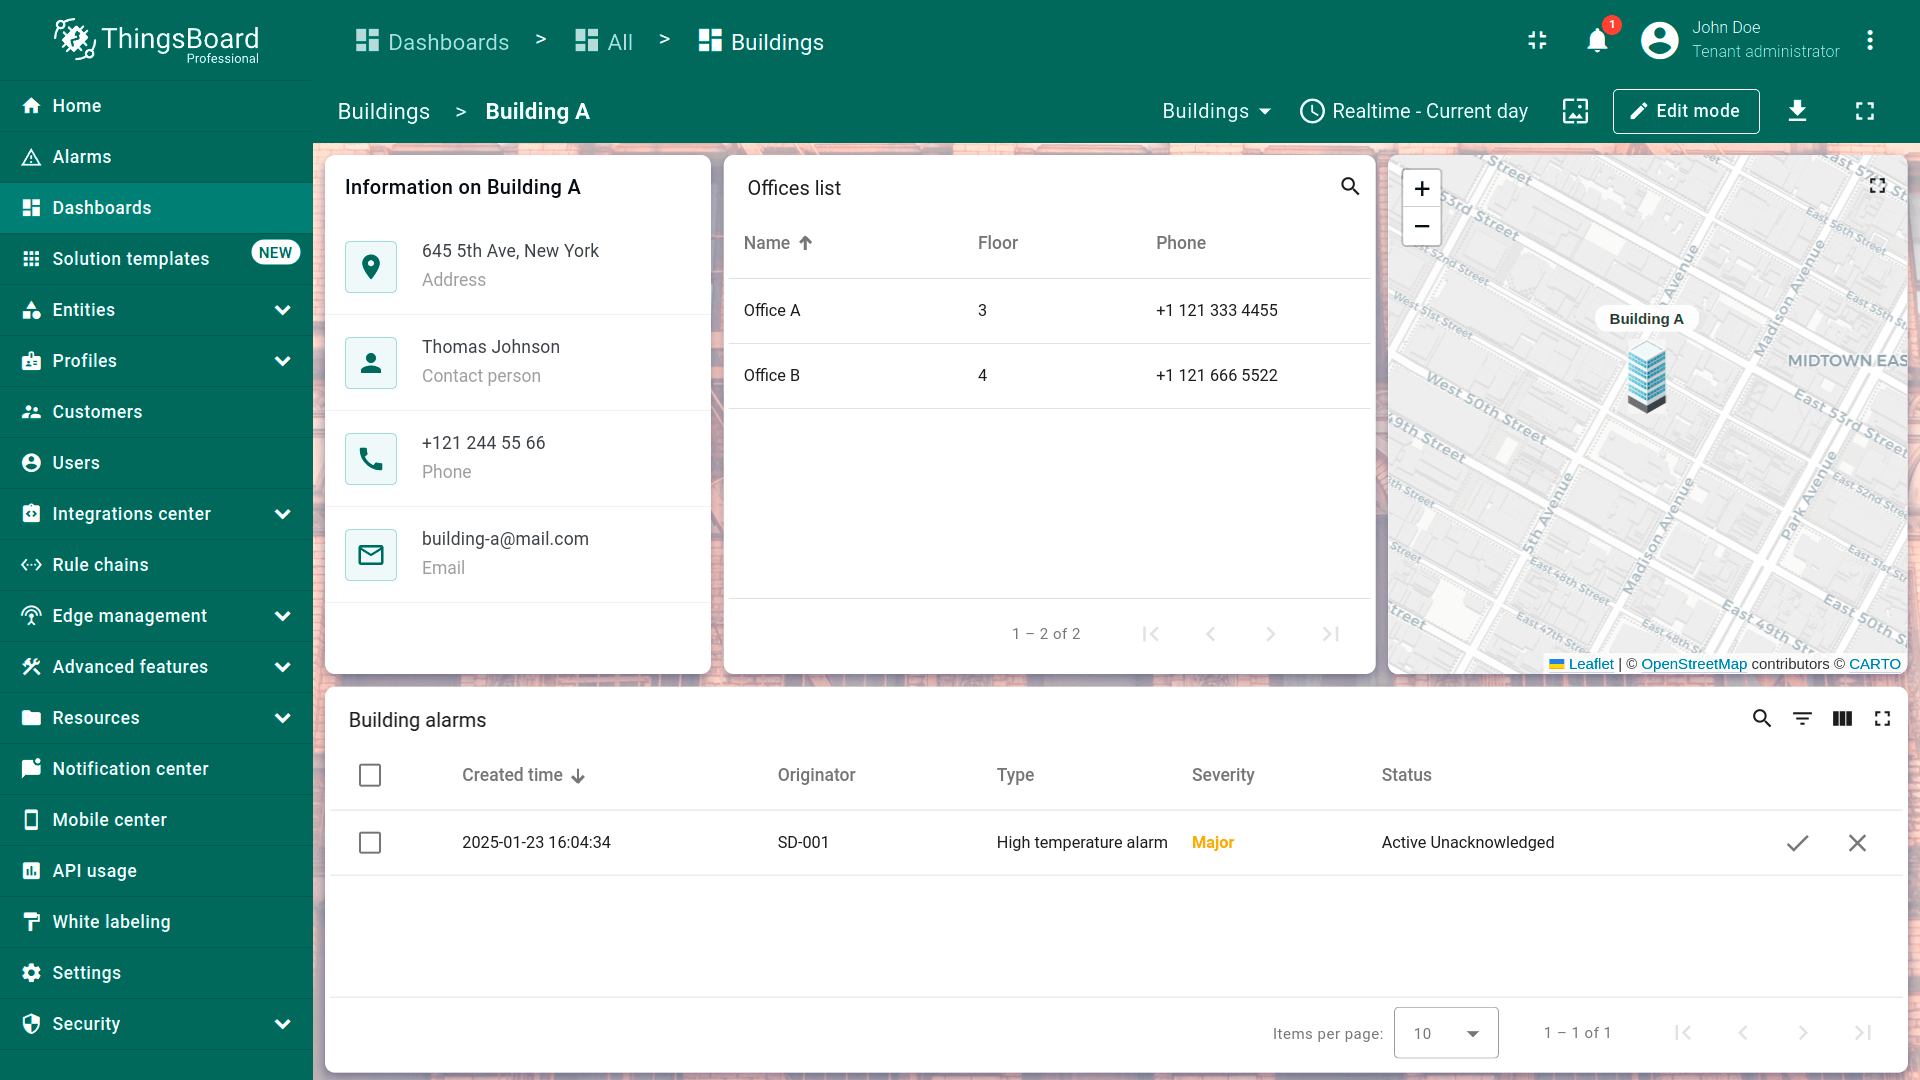
Adding alarm widget to building state
Similar to the previous steps, we will add an alarm widget to the building state. This widget will display alarms from all devices associated with the selected building. We will also add this widget using the copy method.
- Being in the office state, enter dashboard edit mode. Right-click on the alarm widget, and select "Copy" from the dropdown menu;
- Navigate to the Buildings (default) state, right-click on an empty area of the dashboard, and select "Paste";
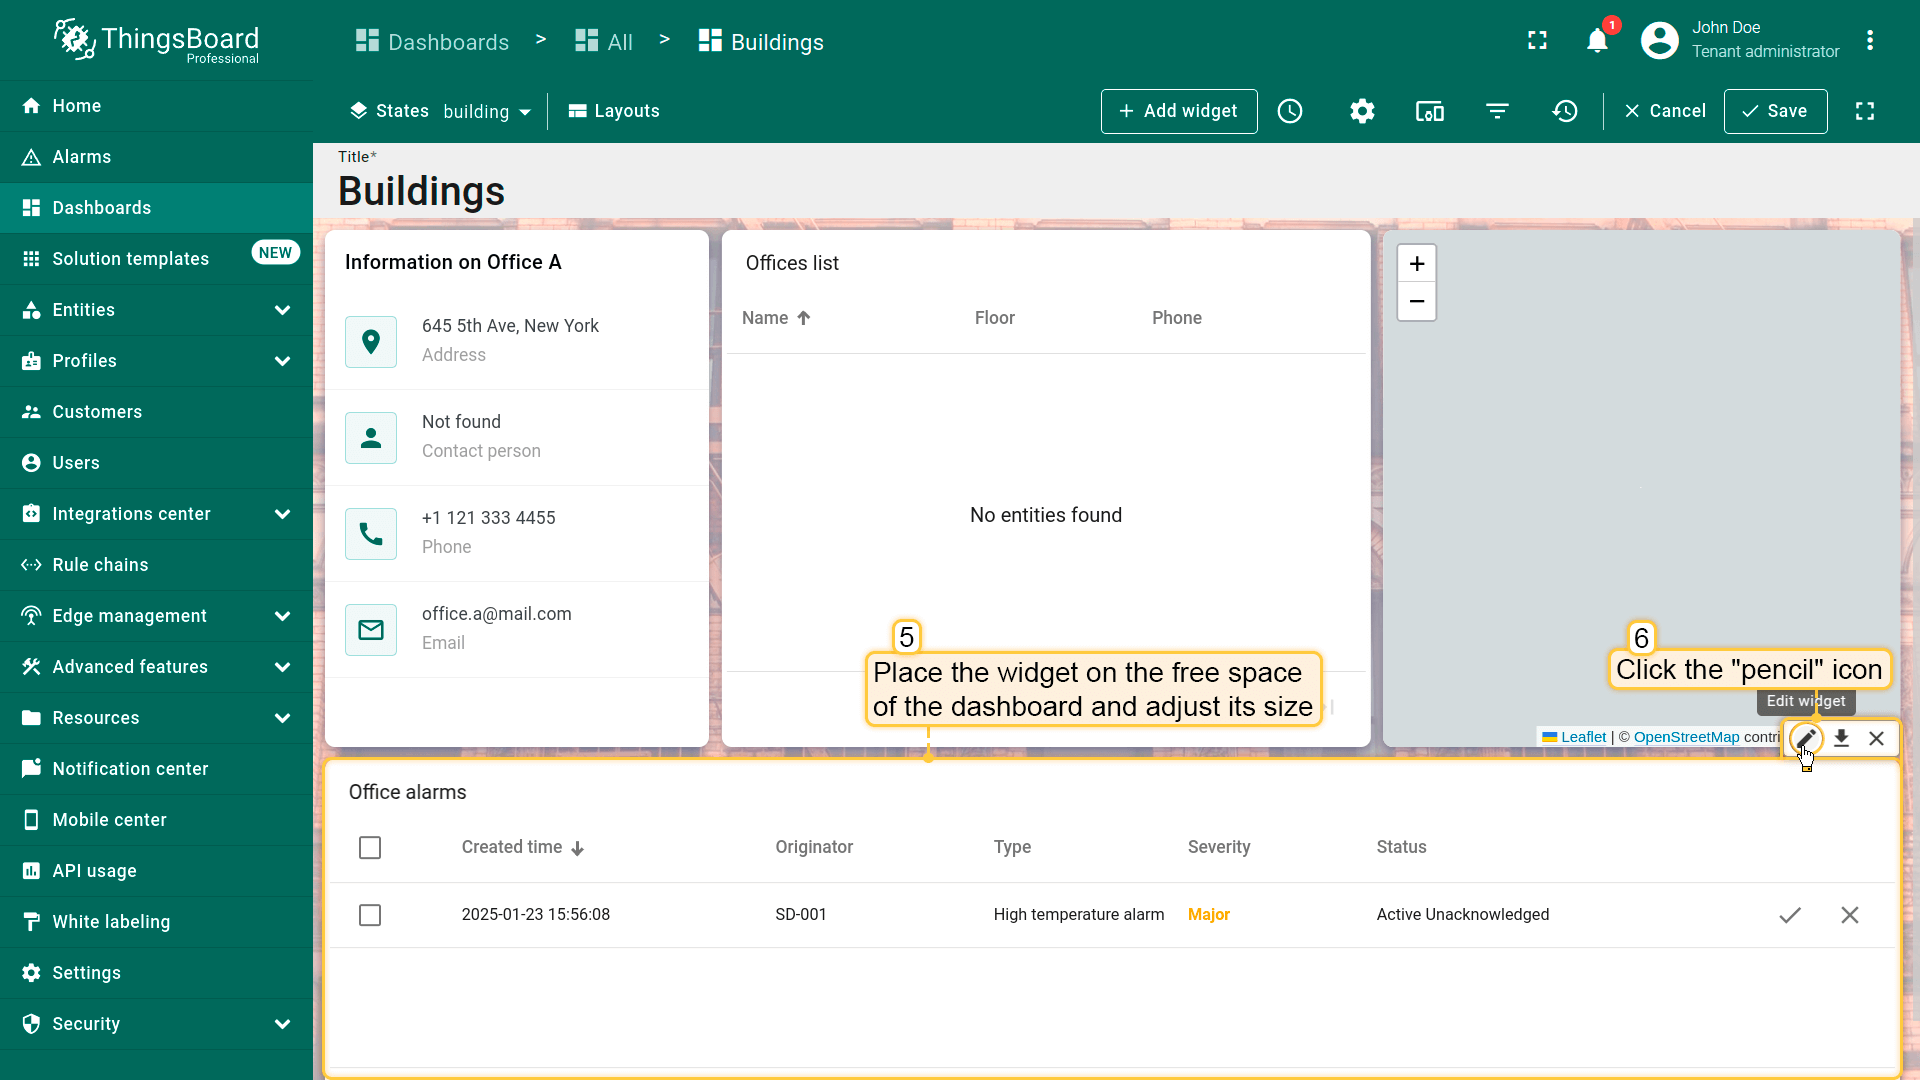
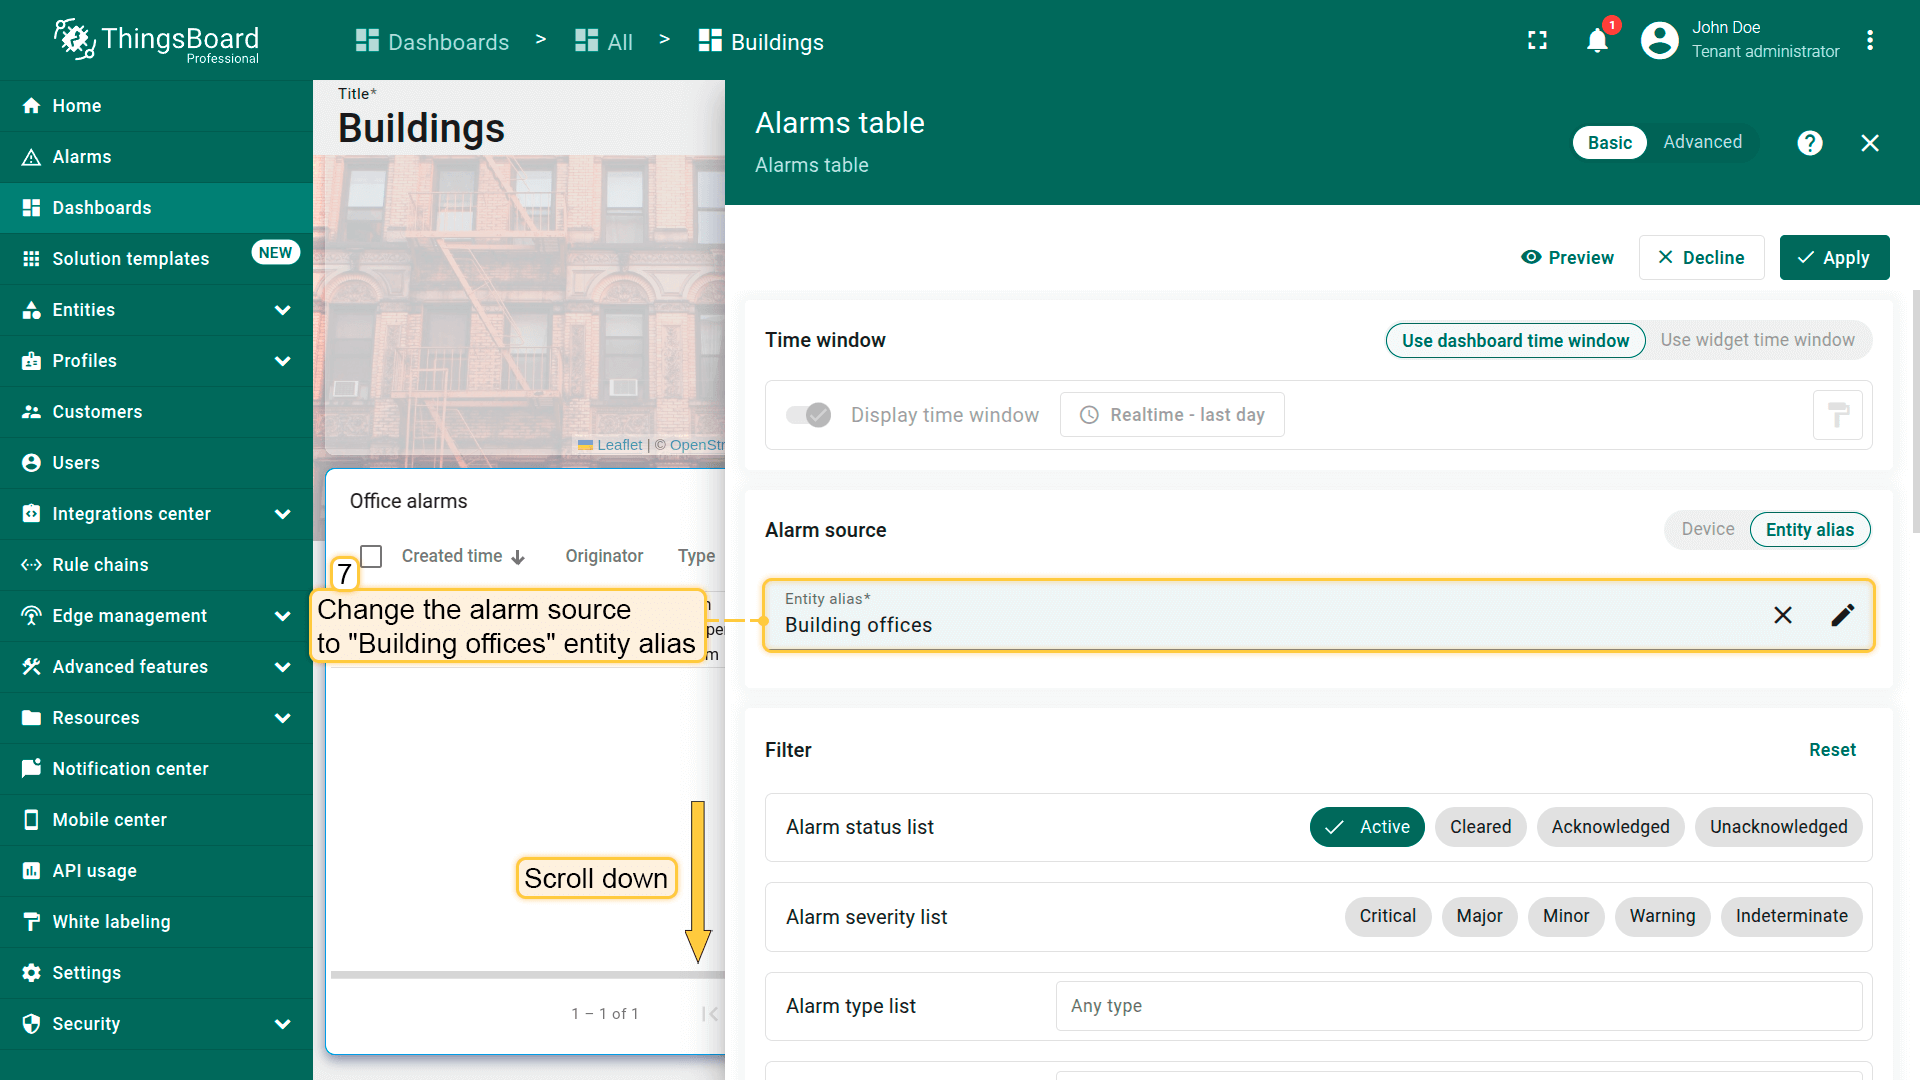
- Place the widget in an empty spot on the dashboard and adjust its size. Click the "pencil" icon on the alarm widget to edit it;
- Change the alarms source to "Building offices" entity alias;
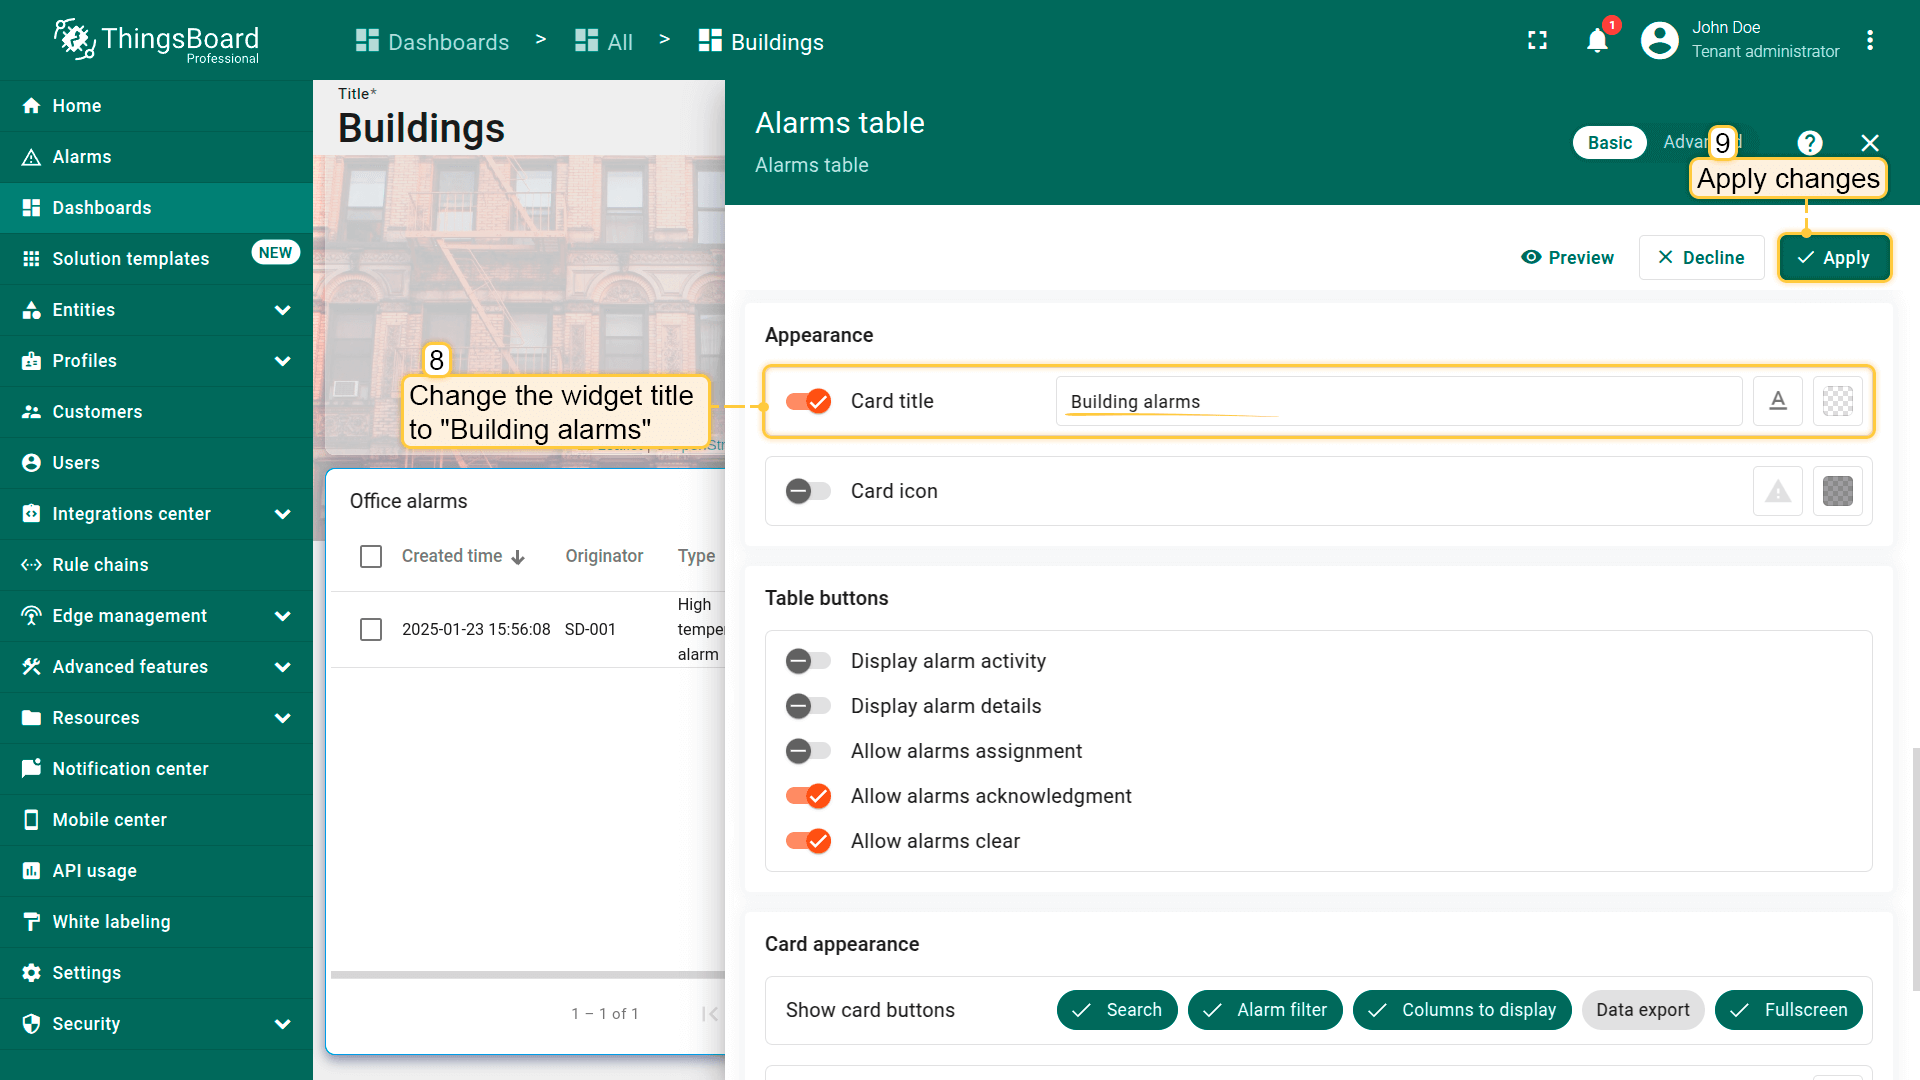
- Change the widget title to "Building alarms". Then, apply the changes;
- Save the dashboard.
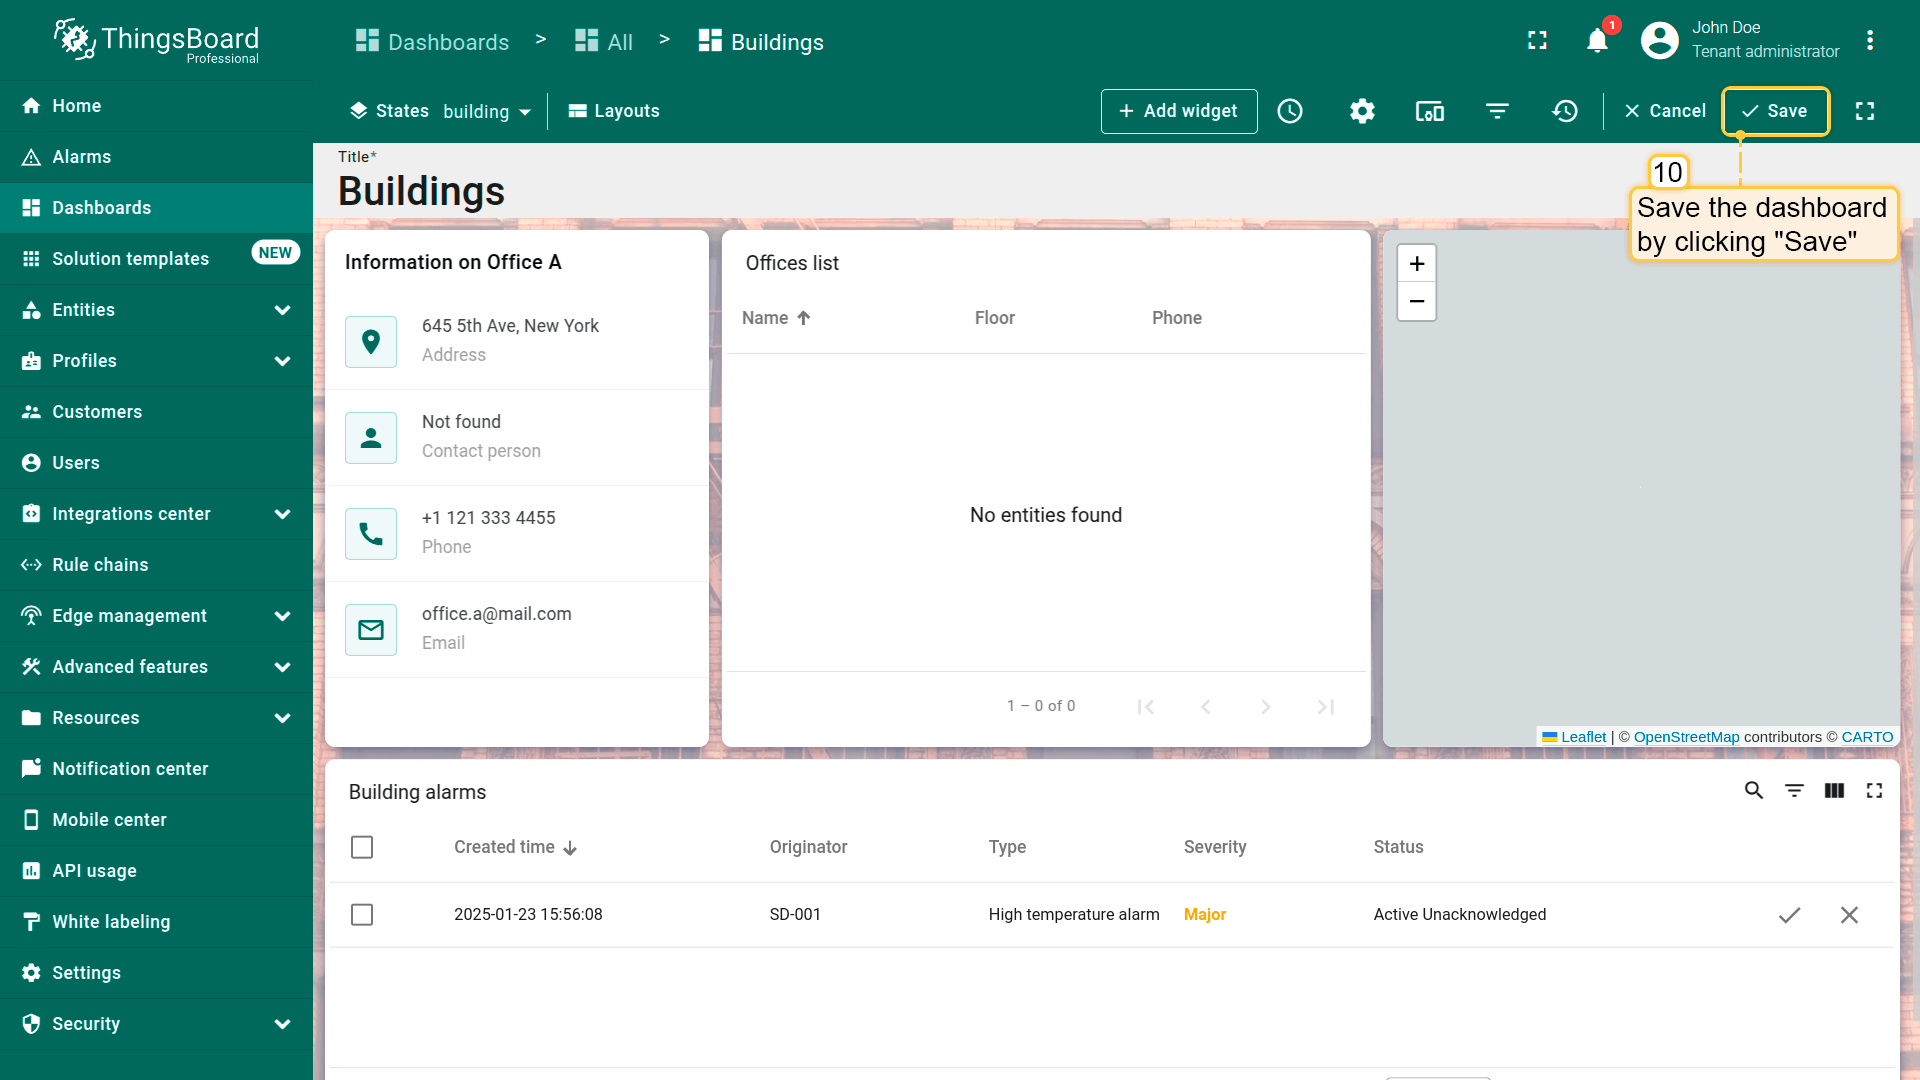
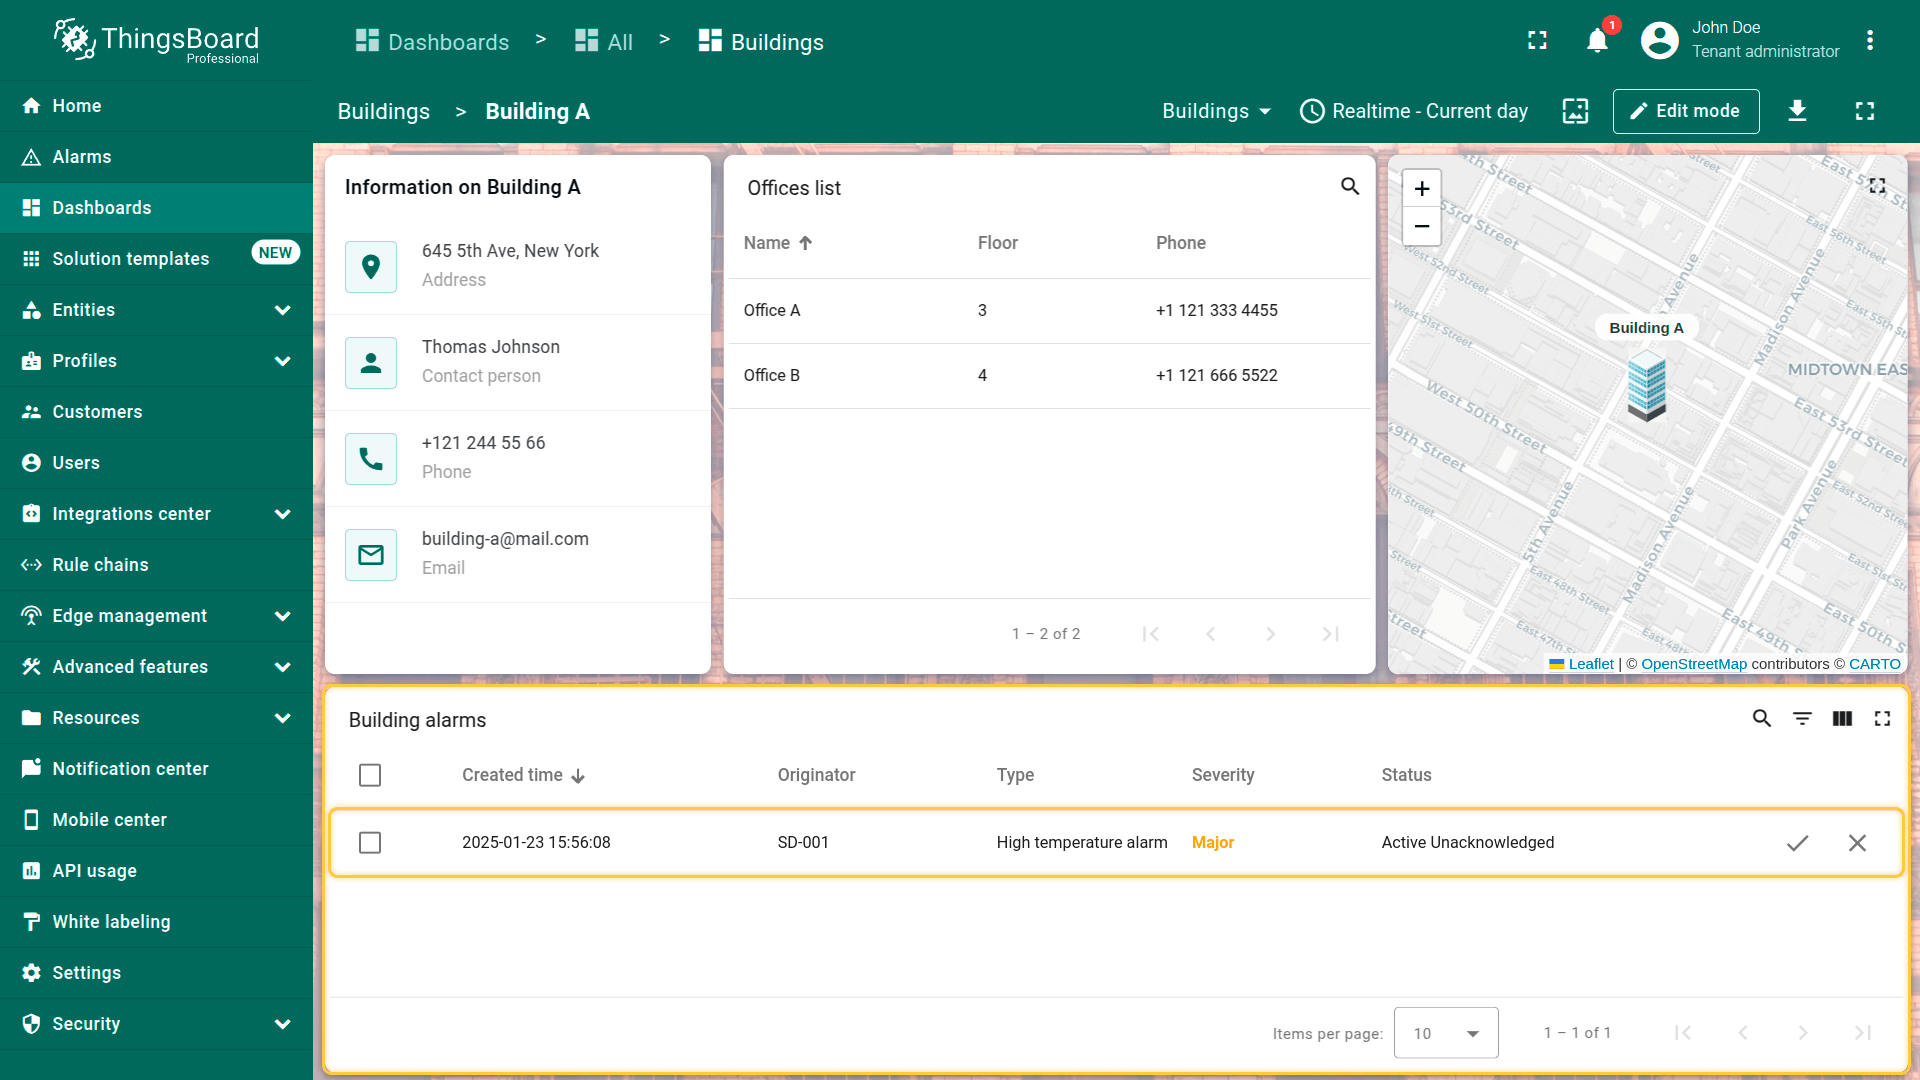
The alarm widget displays the alarms of the devices related to the selected building.
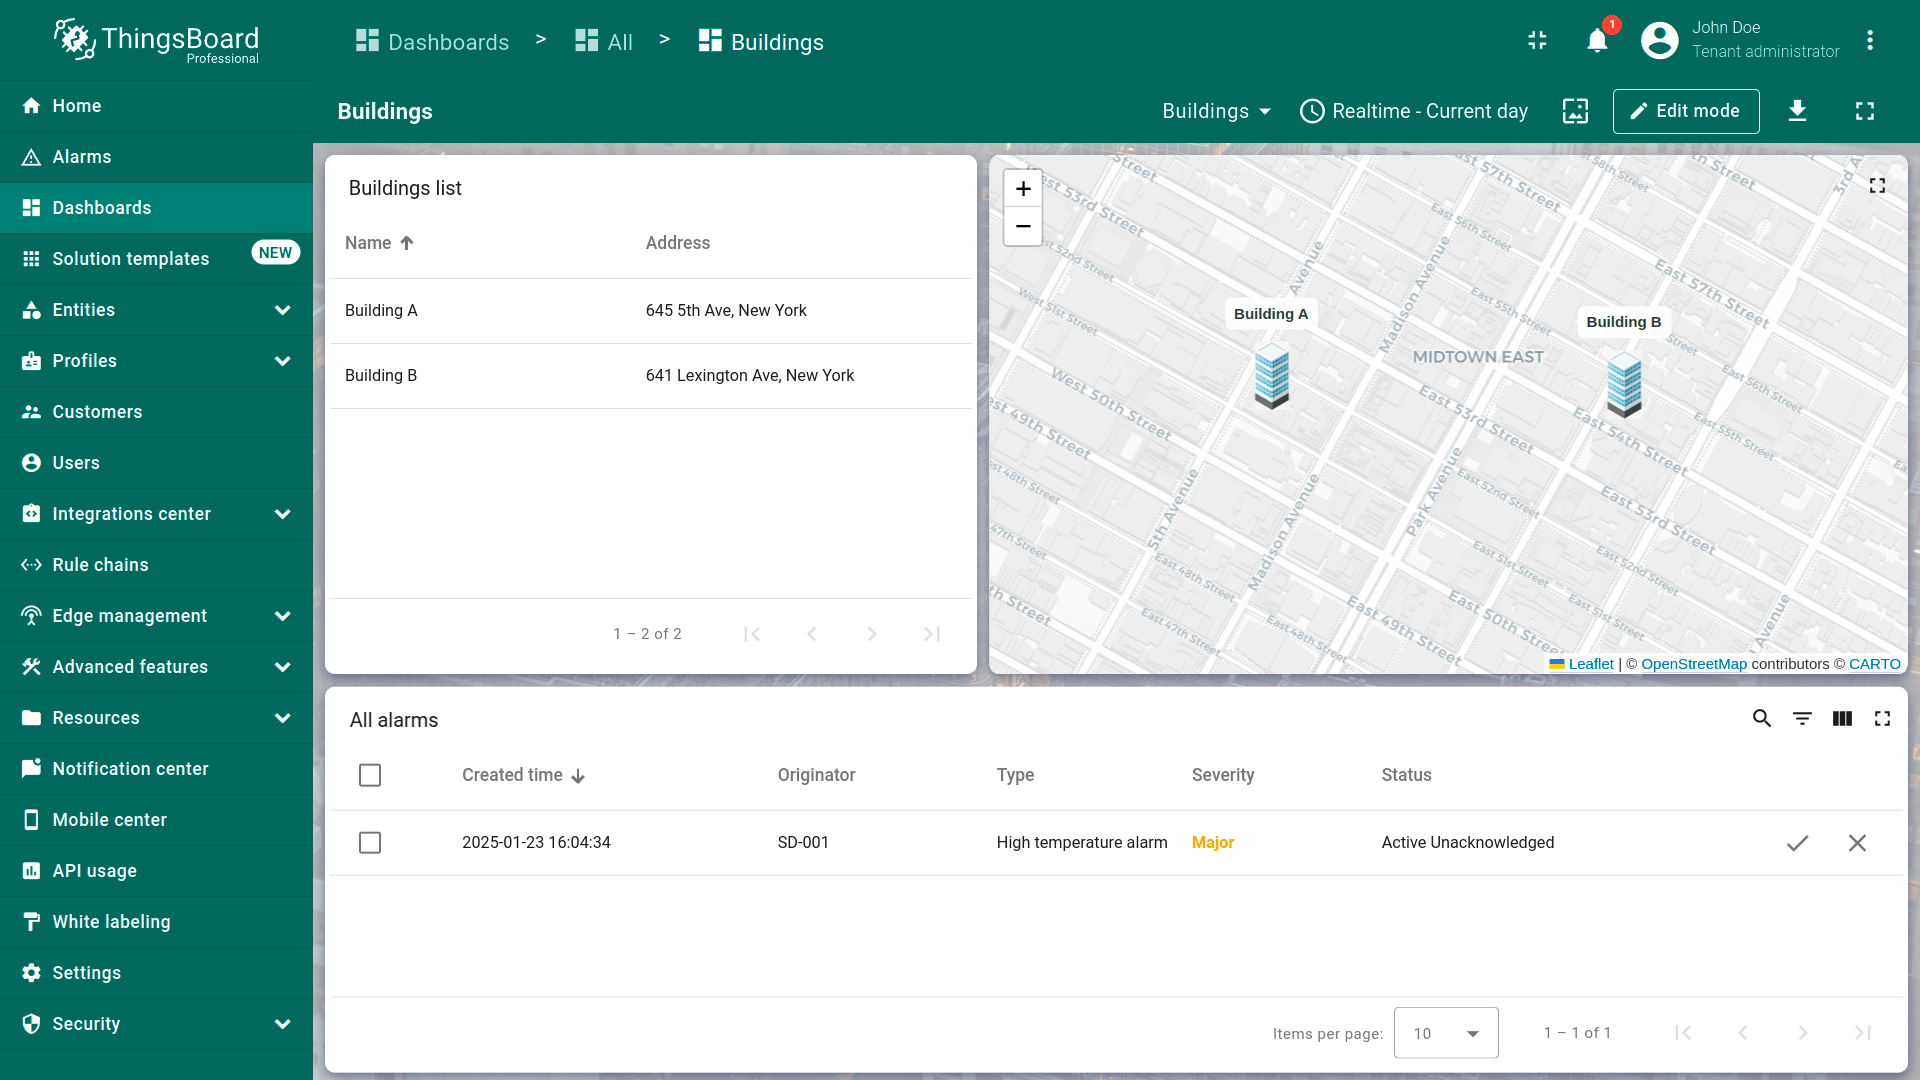
Adding alarm widget to buildings (default) state
Now it remains to add the alarm widget to the Building (default) state. Also by copying method:
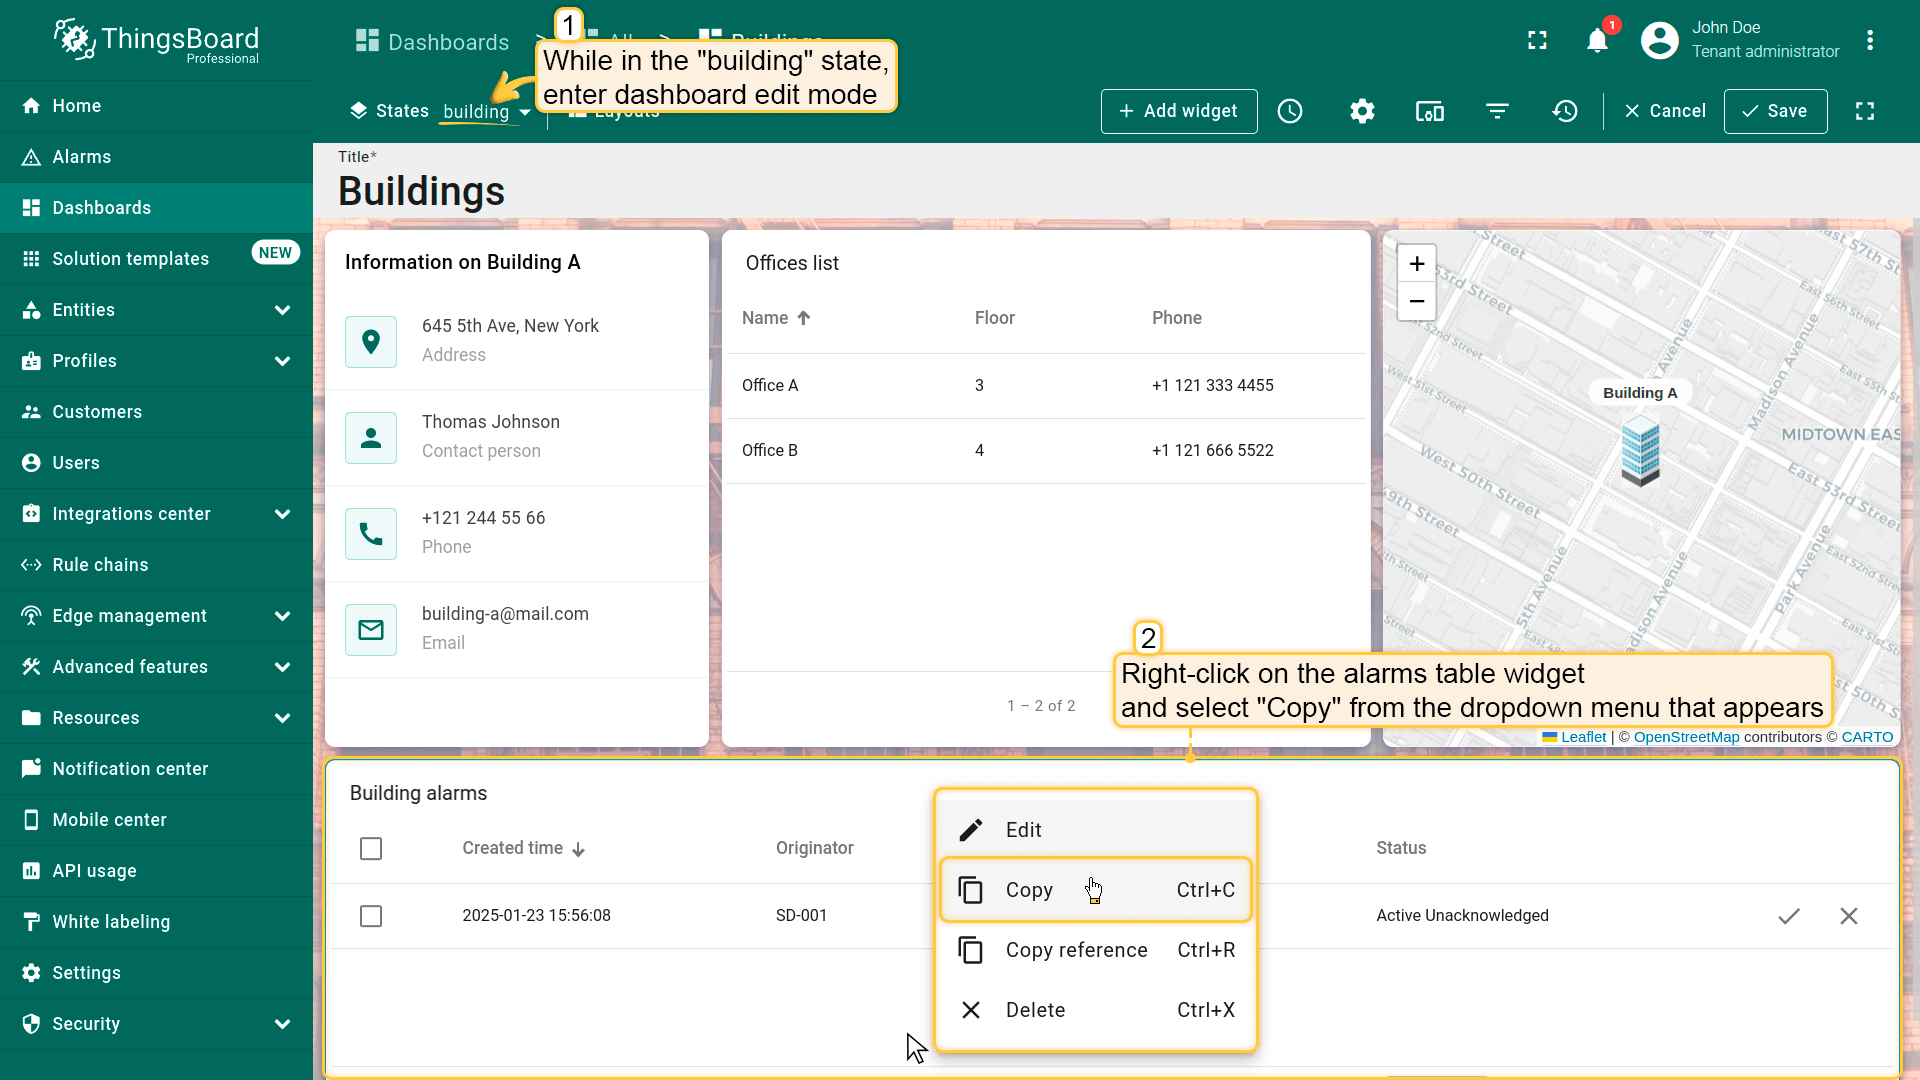
- Being in the office state, enter dashboard edit mode. Right-click on the alarm widget, and select "Copy" from the dropdown menu;
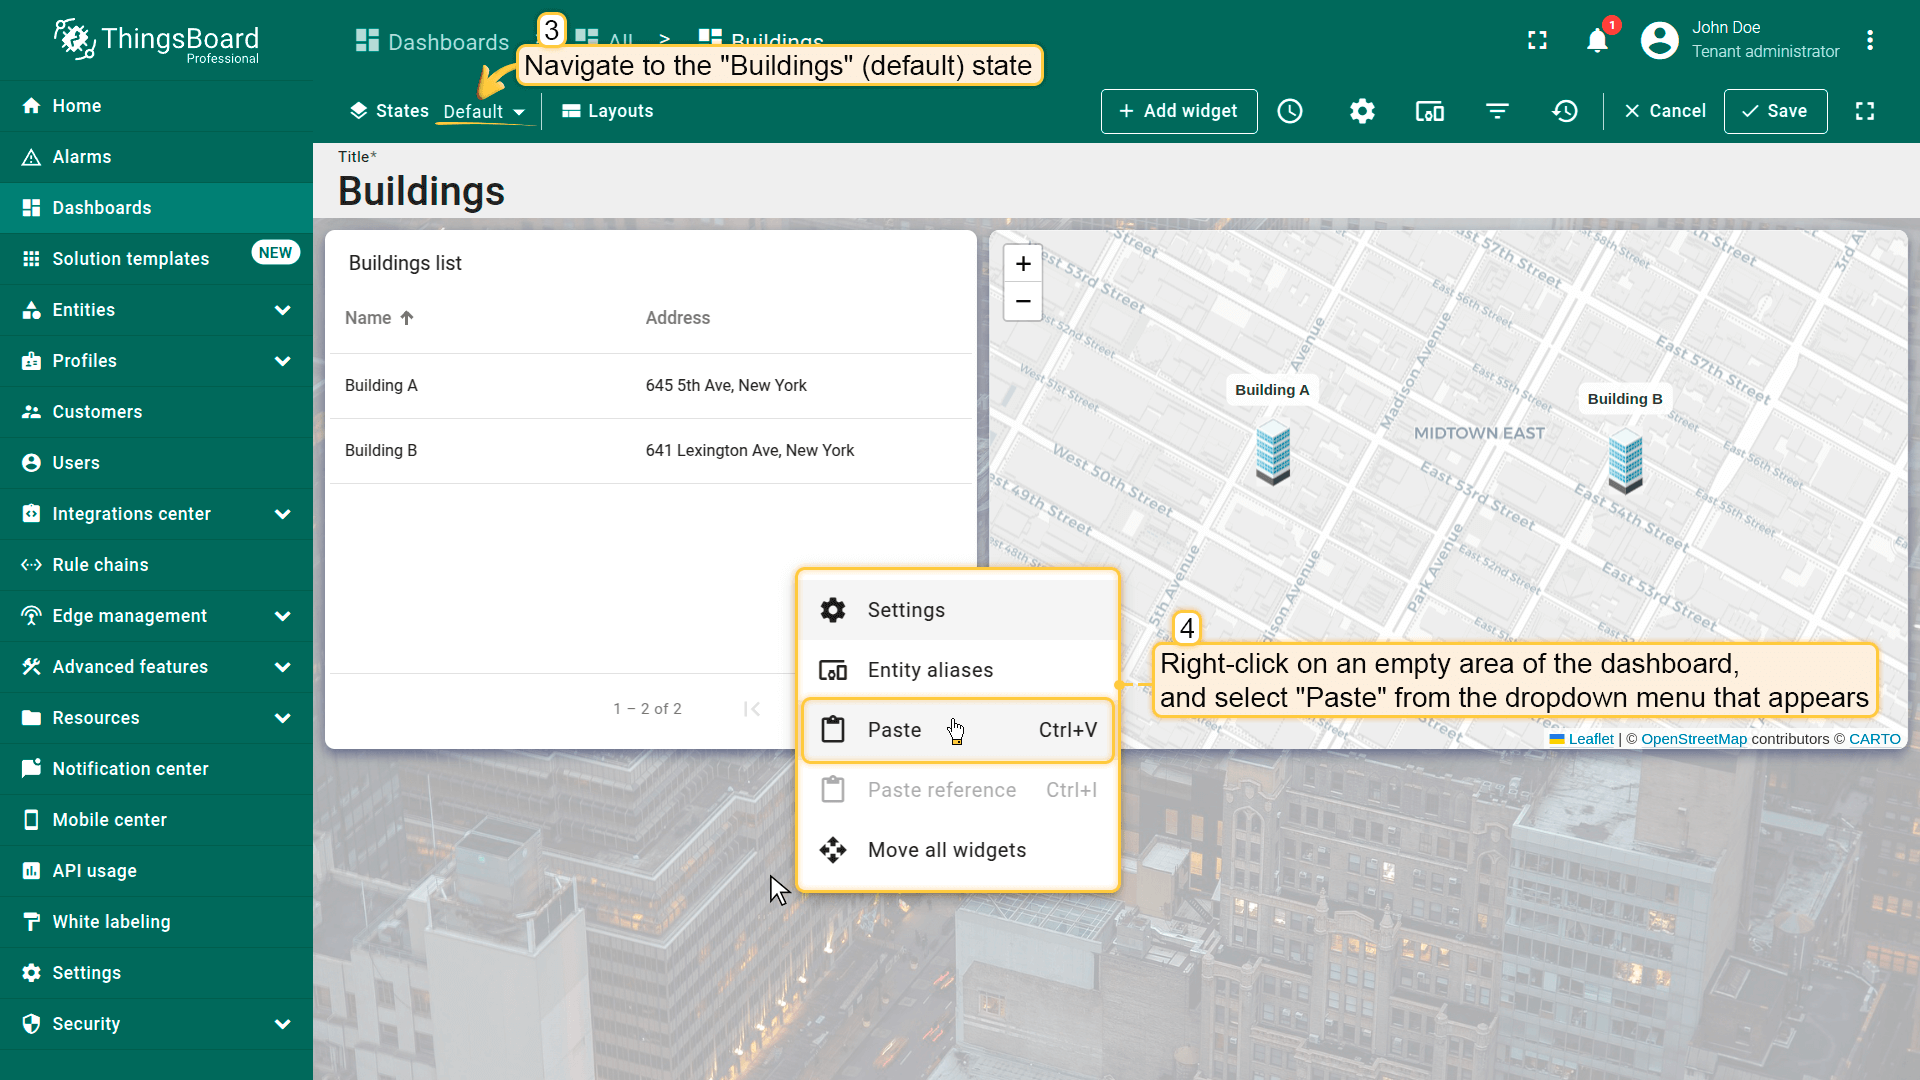
- Navigate to the Buildings (default) state, right-click on an empty area of the dashboard, and select "Paste";
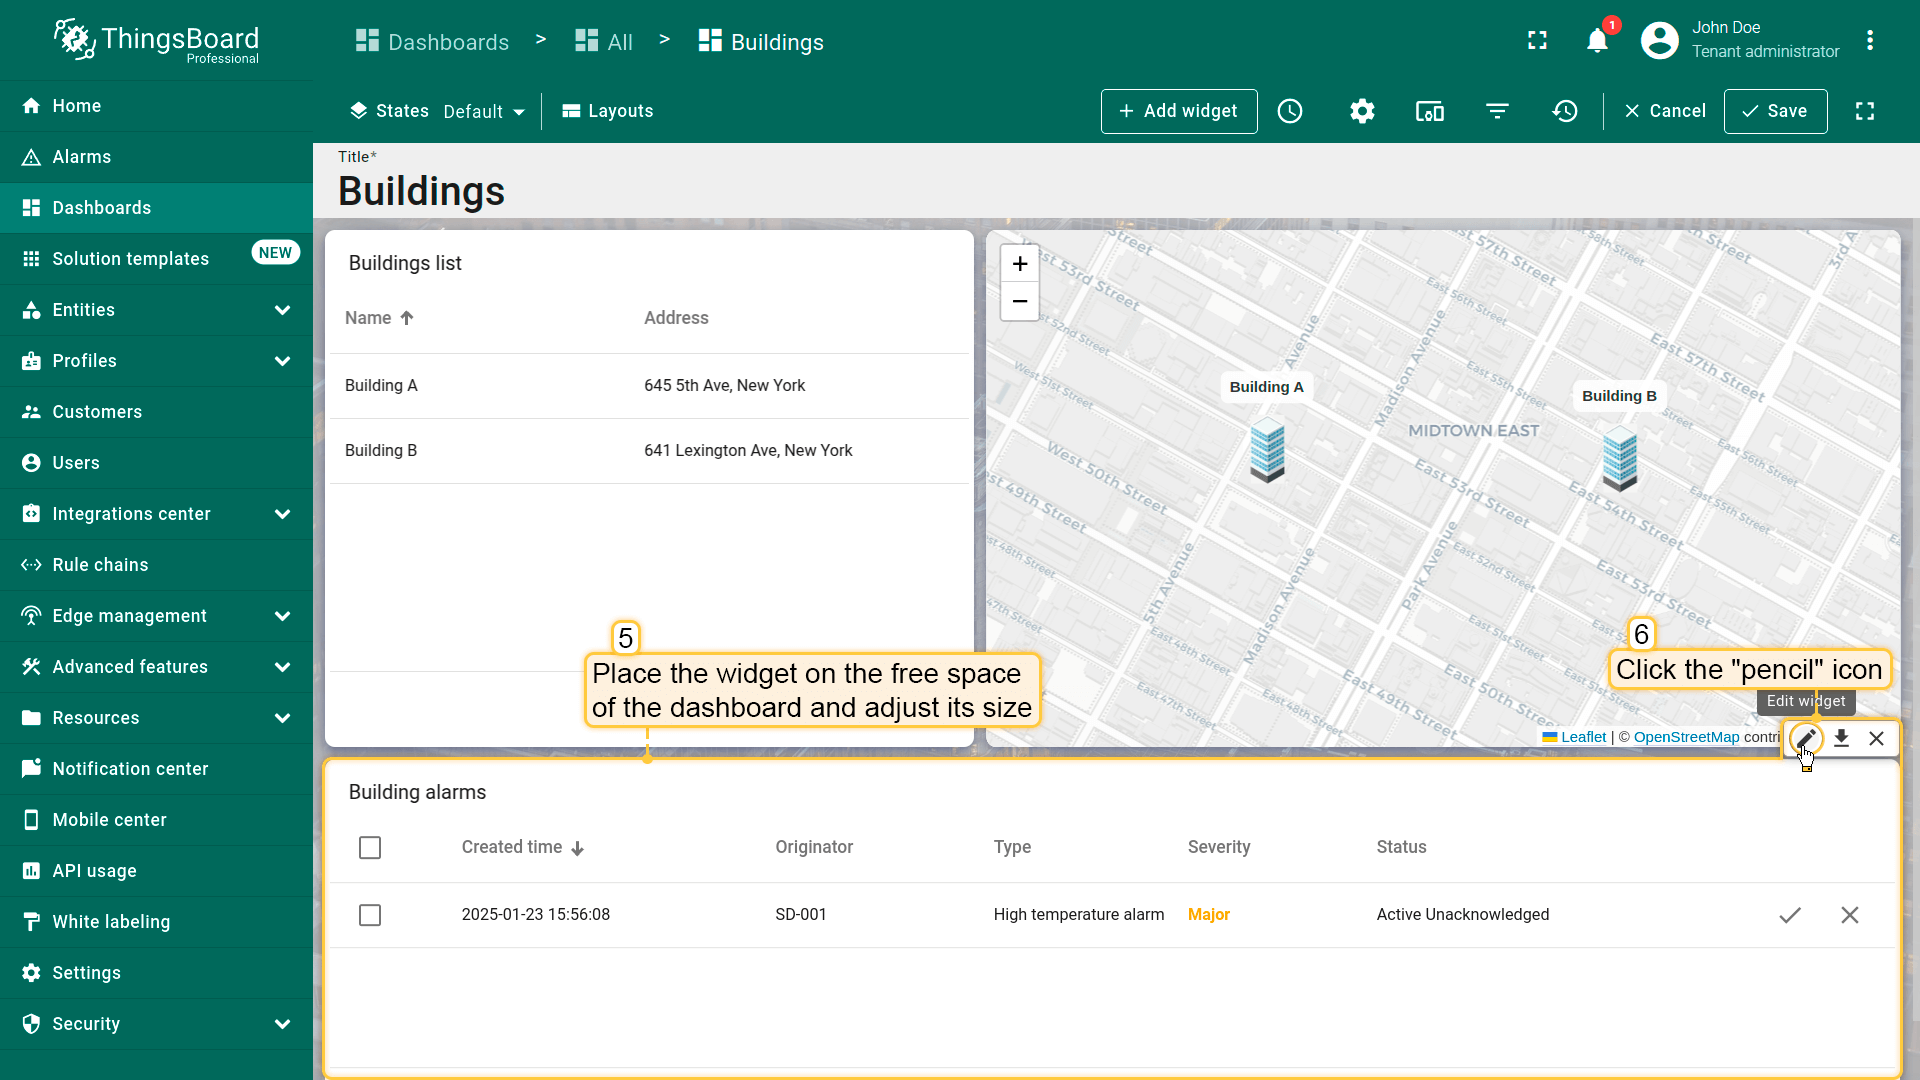
- Place the widget in an empty area on the dashboard and adjust its size. Then, click the "pencil" icon on the alarm widget to edit it;
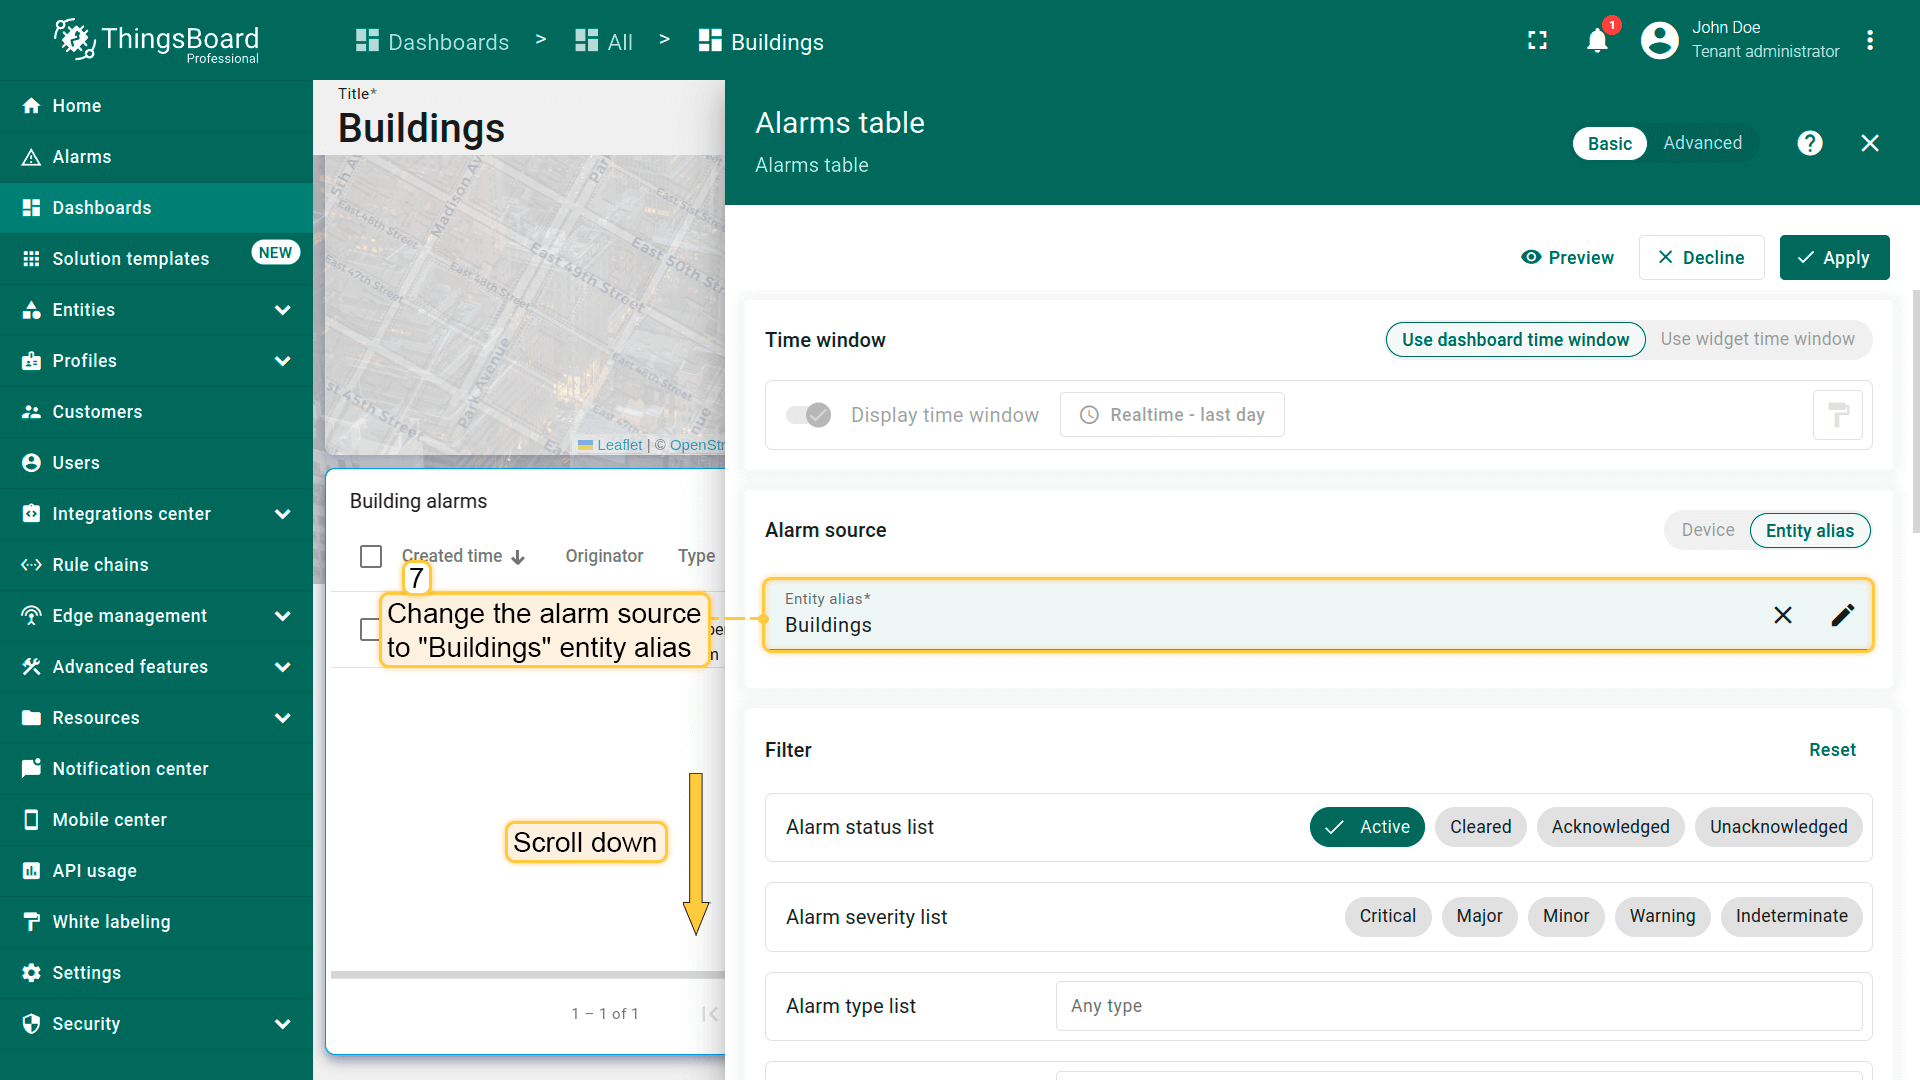
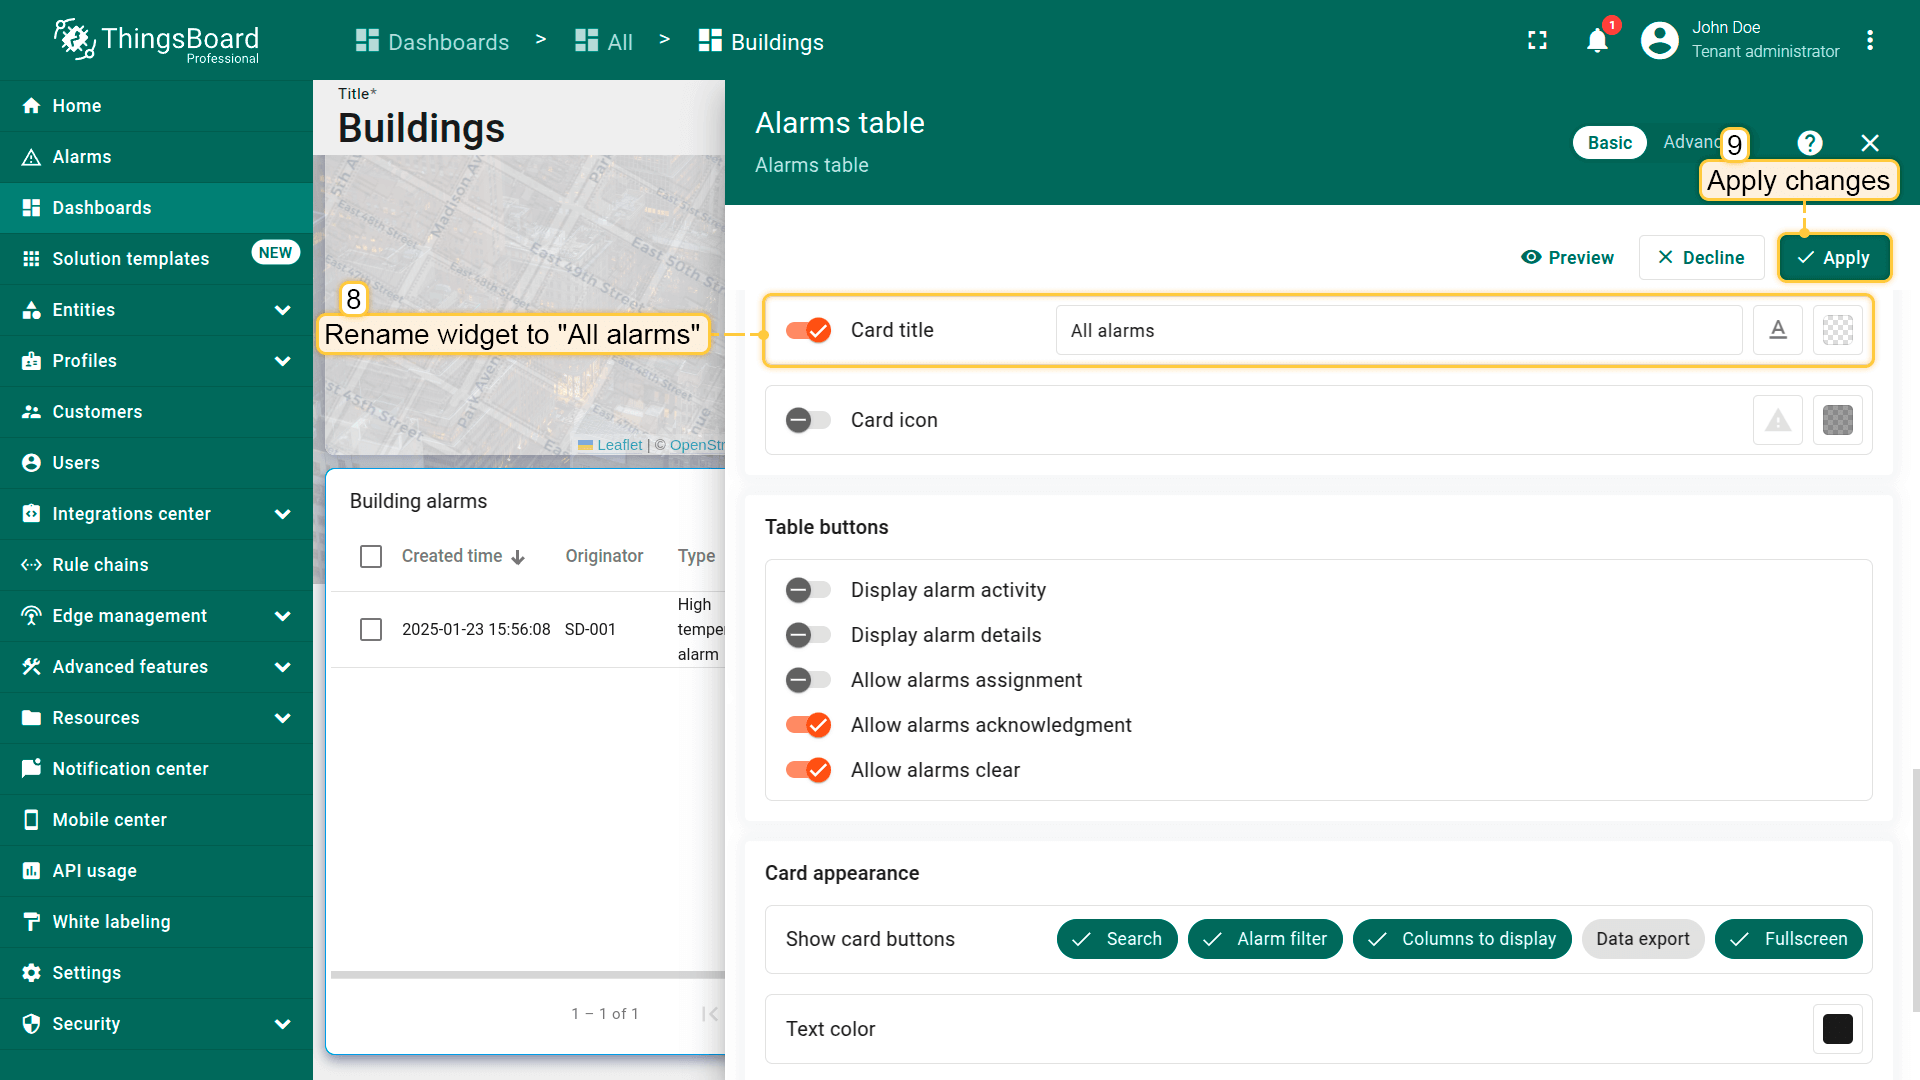
- Change the alarm source to "Buildings" entity alias;
- Rename the widget to "All alarms", and apply changes;
- Finally, save the dashboard.
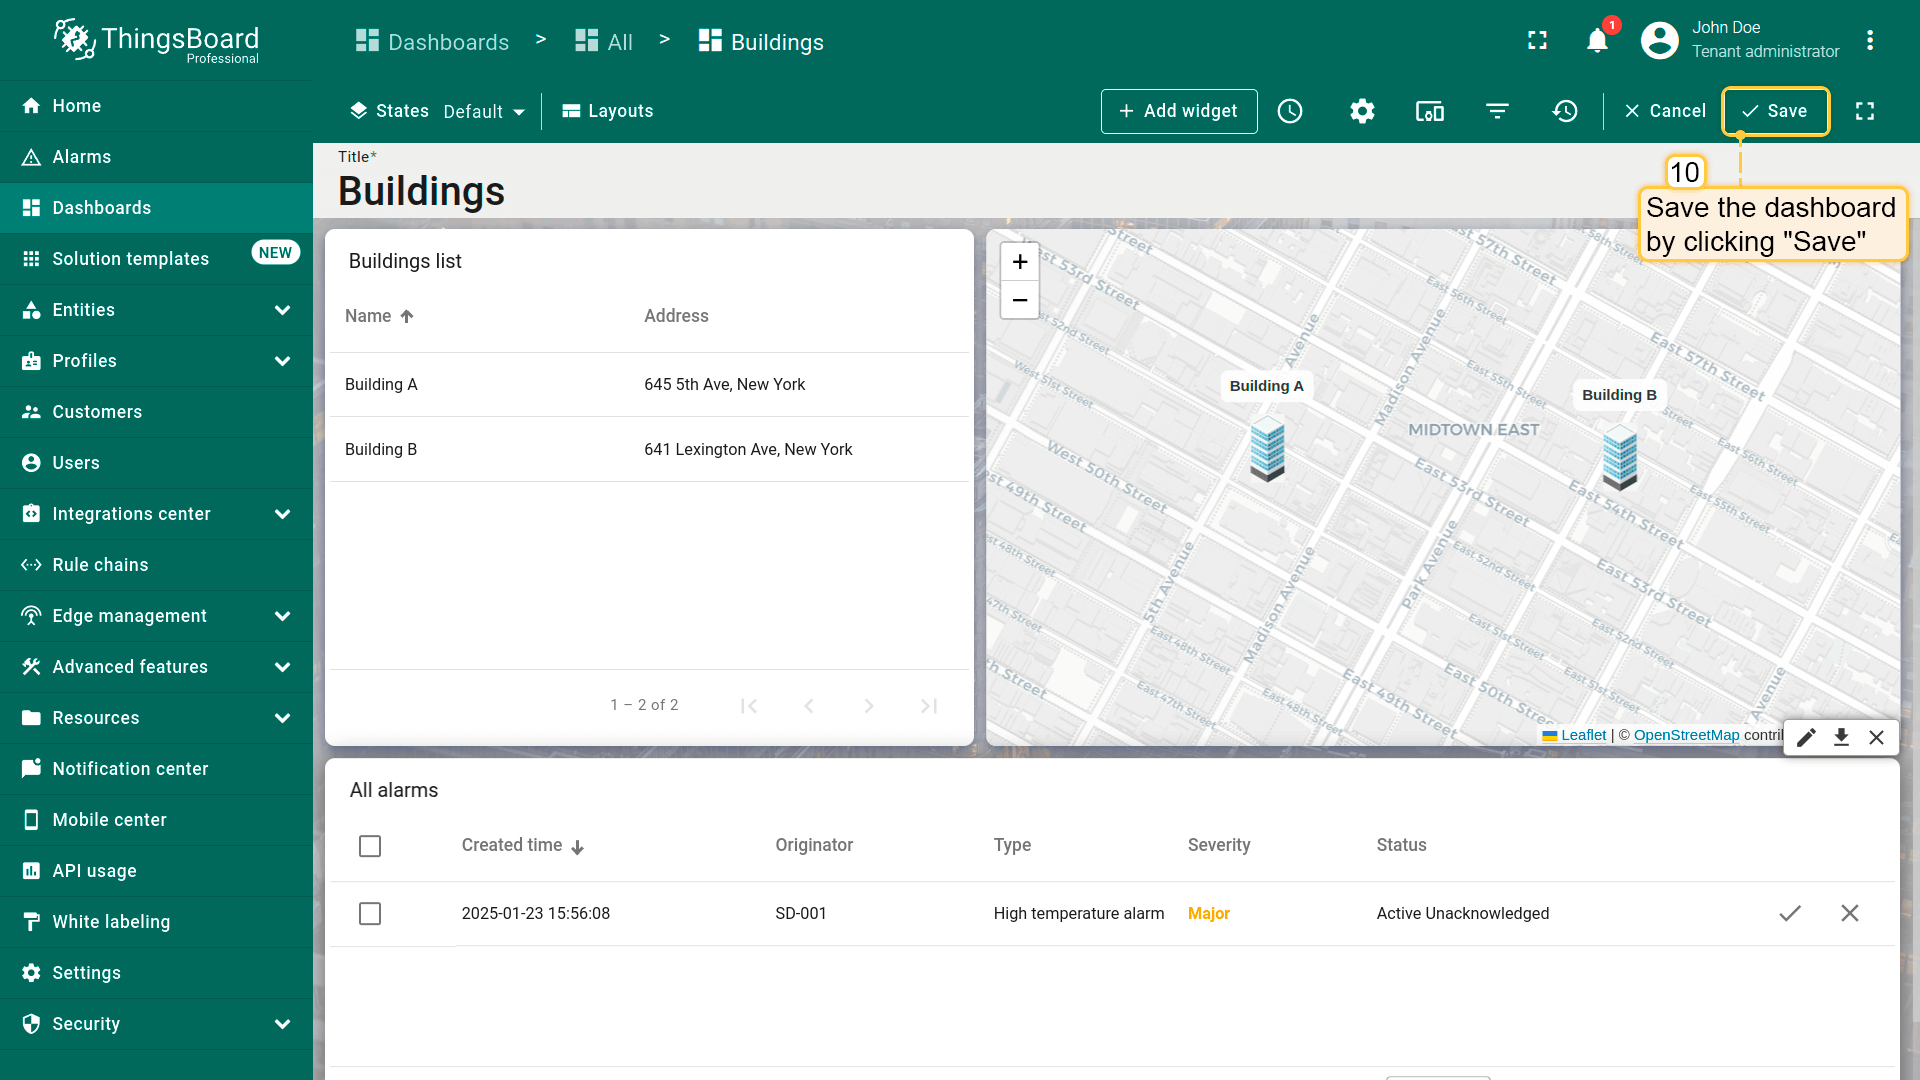
Now, if there are alarms on your devices, they will be displayed in the alarms widget in the Building (default) state.
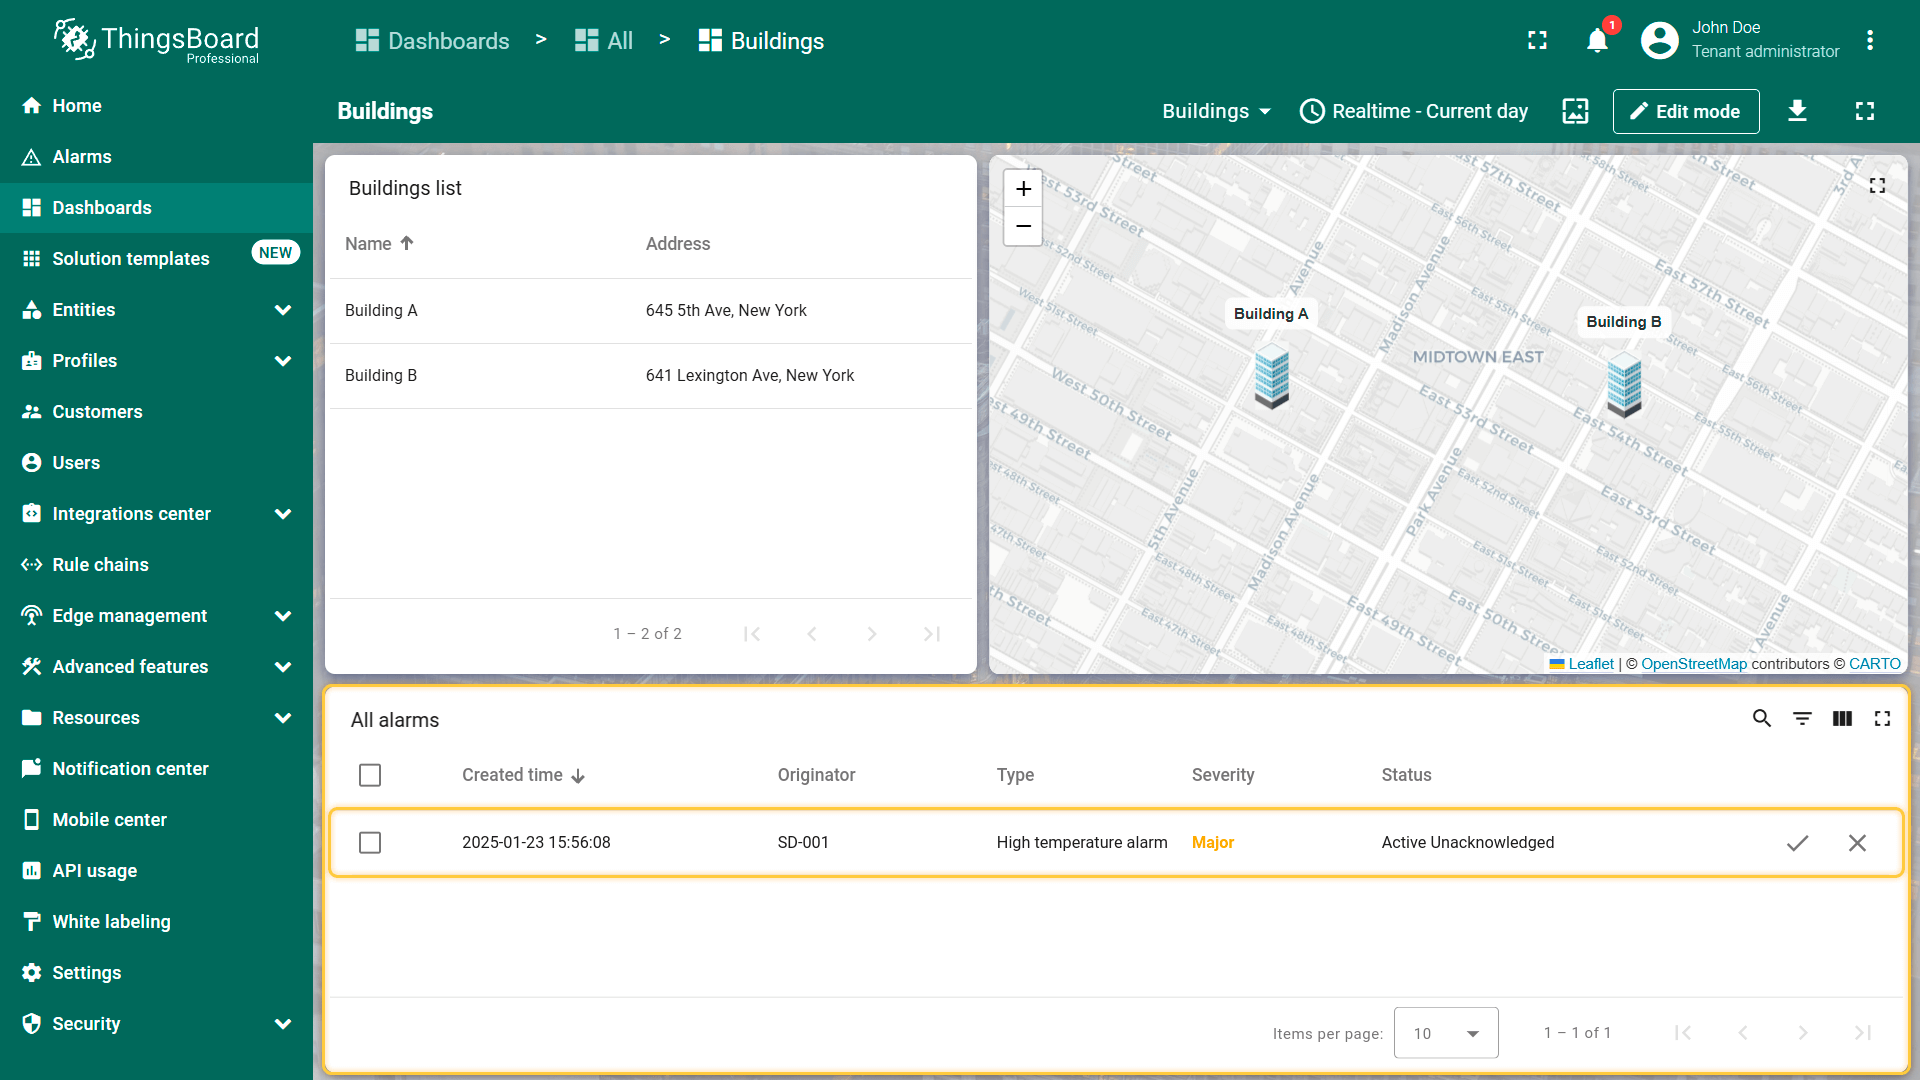
Final view of the dashboard for this lesson
Next step
In the next lesson, we will share this dashboard with customers. When you are ready to proceed, simply click the button below.