- Use case
- Prerequisites
- Create device
- Configure edge rule engine to push filtered data to the cloud
- Connect device to edge and post telemetry
- Create dashboard
- Next Steps
Use case
This use case demonstrates how to configure an “in-vehicle IoT monitoring system” connected to ThingsBoard Edge platform.
The goal is to collect data from various sensors, process it locally on the Edge, and selectively push relevant data (e.g., mileage readings) to the cloud. This setup ensures efficient tracking of the remaining mileage until the next oil change.
To achieve this, we will configure the “Edge Root Rule Chain” to process sensor readings locally on the ThingsBoard Edge platform. This setup will handle inputs from all 10 sensors and use a rule node to filter and forward only the distance readings (mileage) to the cloud.
The “in-vehicle monitoring system” includes 10 sensors:
- Distance
- Gas consumption
- Vehicle speed
- Engine temperature
- Ambient temperature
- Tire temperature
- Pressure in each tire (4x)
ThingsBoard Edge has the following responsibilities:
- Collecting readings from all 10 sensors
- Sending only “distance” readings to the cloud
Please note that this is just a simple theoretical use case to demonstrate the capabilities of the platform. You can use this tutorial as a basis for much more complex scenarios.
Prerequisites
We assume you have completed the following guides and reviewed the articles listed below:
-
Getting Started guide.
- Rule Engine Overview article.
- ThingsBoard Edge Getting Started article.
- Edge Rule Chain Templates guide.
Please make sure that you have ThingsBoard PE server up and running. Additionally, ThingsBoard Edge must be up, running and connected to the cloud.
If you have these prerequisites in place let’s go to next steps.
In other case please visit this link to provision, install and connect Edge to Server guide.
For simplicity we are going to refer to server UI URL as SERVER_URL despite if you installed ThingsBoard server on-previse or using cloud host version. Edge UI URL respectively as EDGE_URL below in tutorial.
If the Edge HTTP bind port was changed to 18080 during Edge installation, access the ThingsBoard Edge instance at http://localhost:18080.
Create device
To begin, let’s create a new device named “In-vehicle monitoring system” on the Edge.
Please open ThingsBoard Edge UI using the URL EDGE_URL.
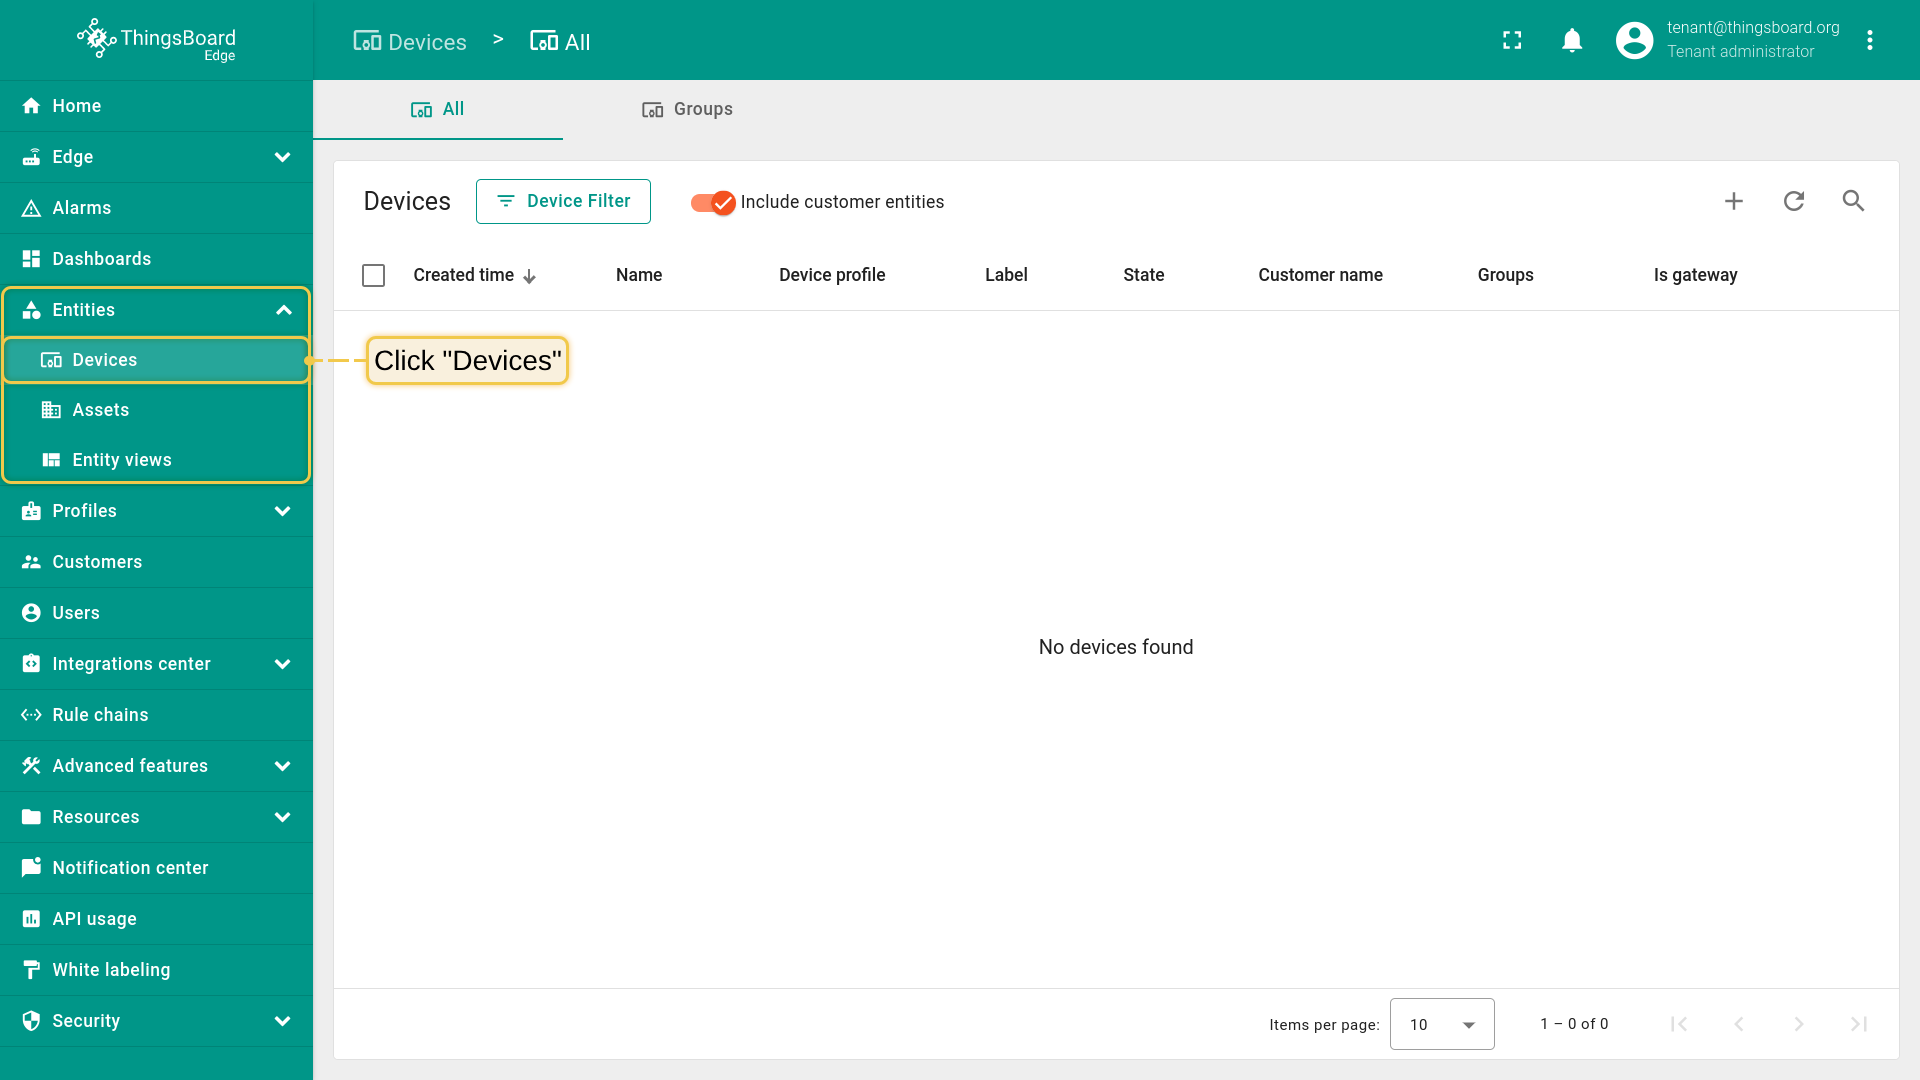
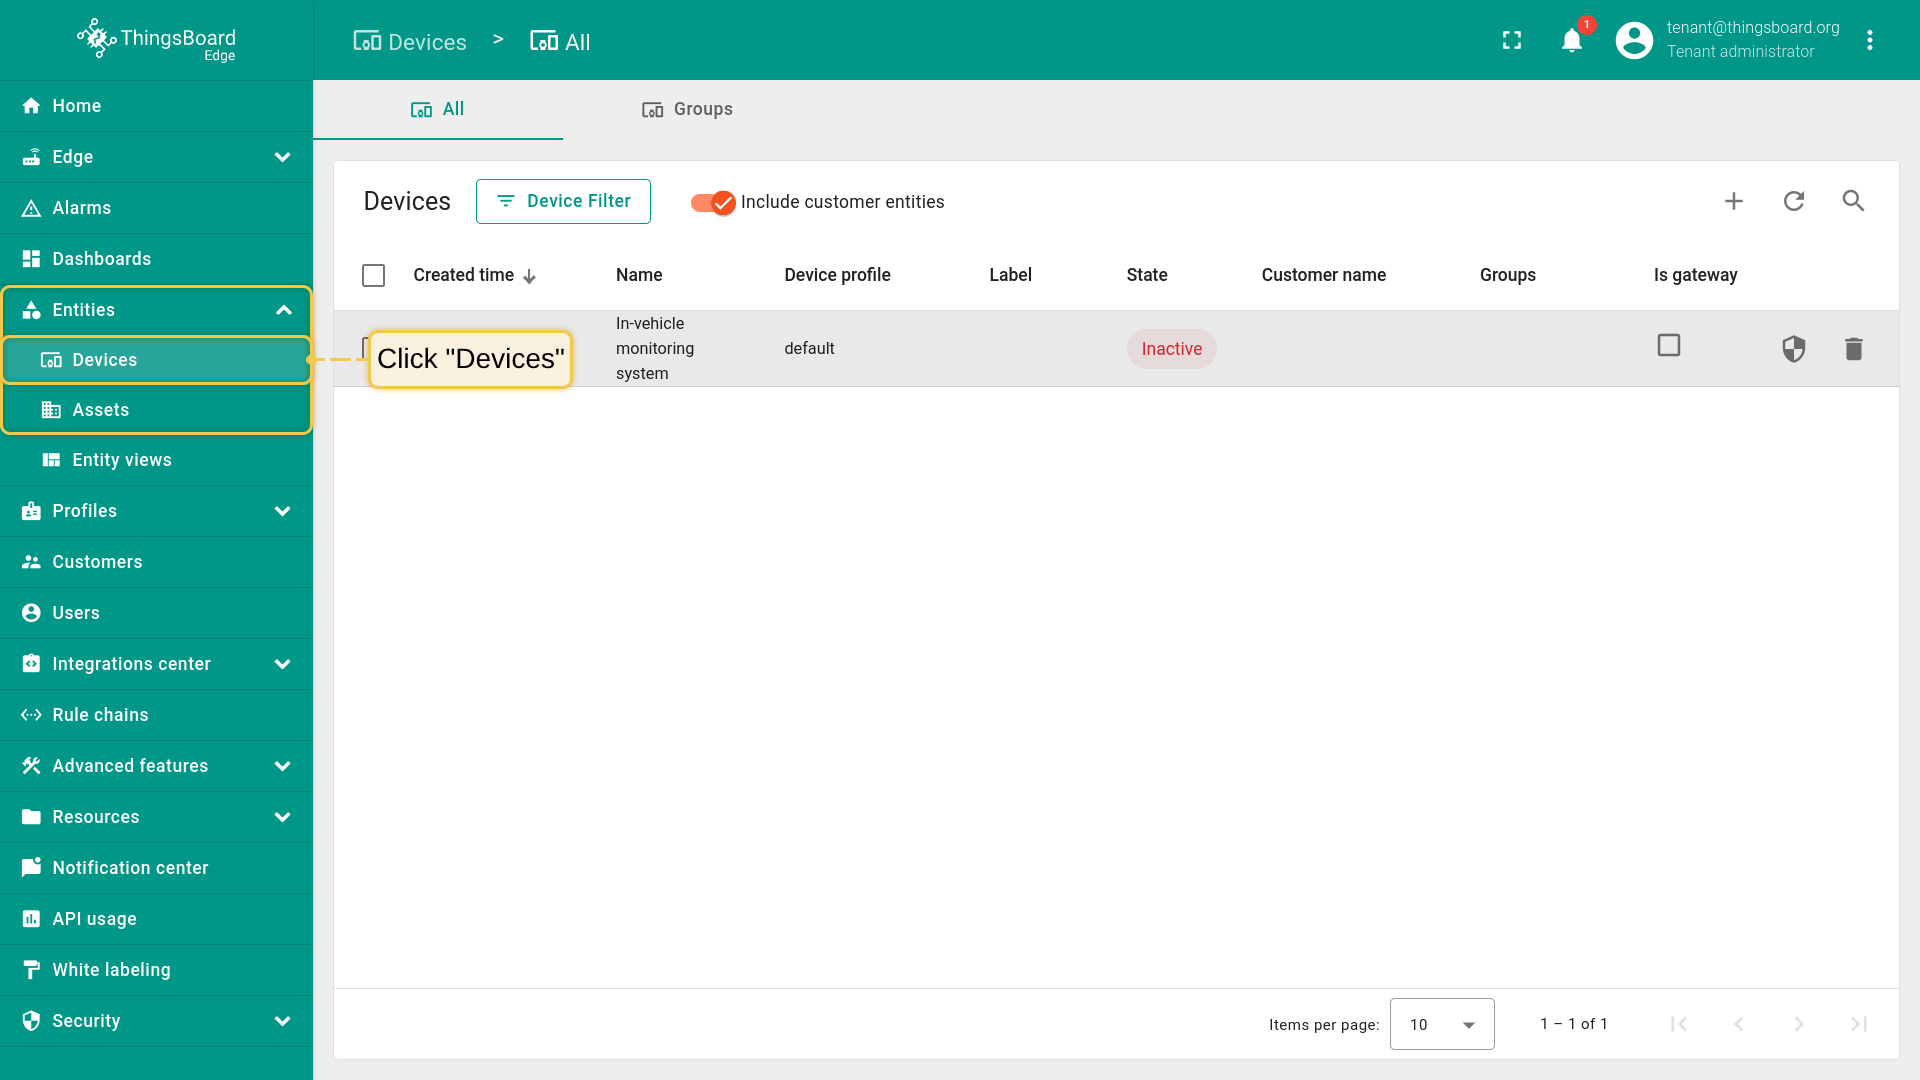
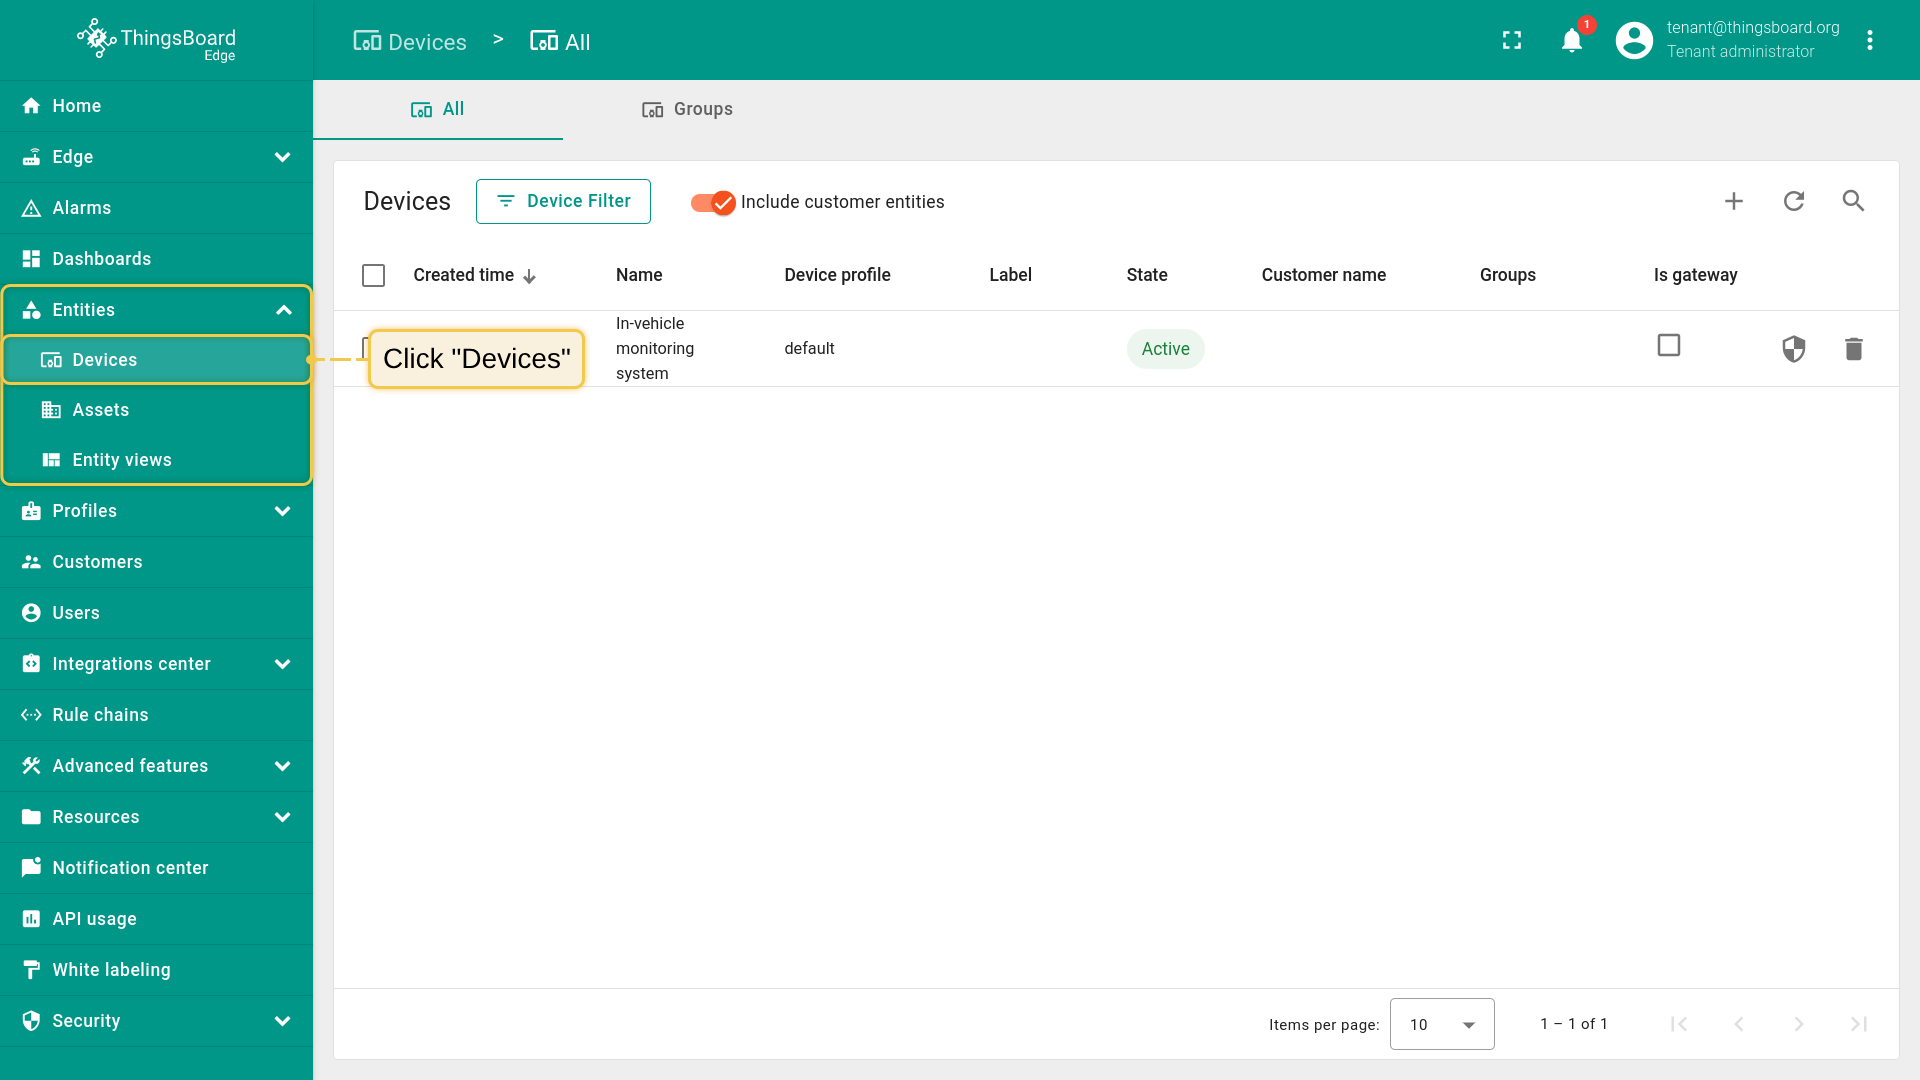
- Log in to your ThingsBoard Edge instance using your credentials. Navigate to the "Devices" page.
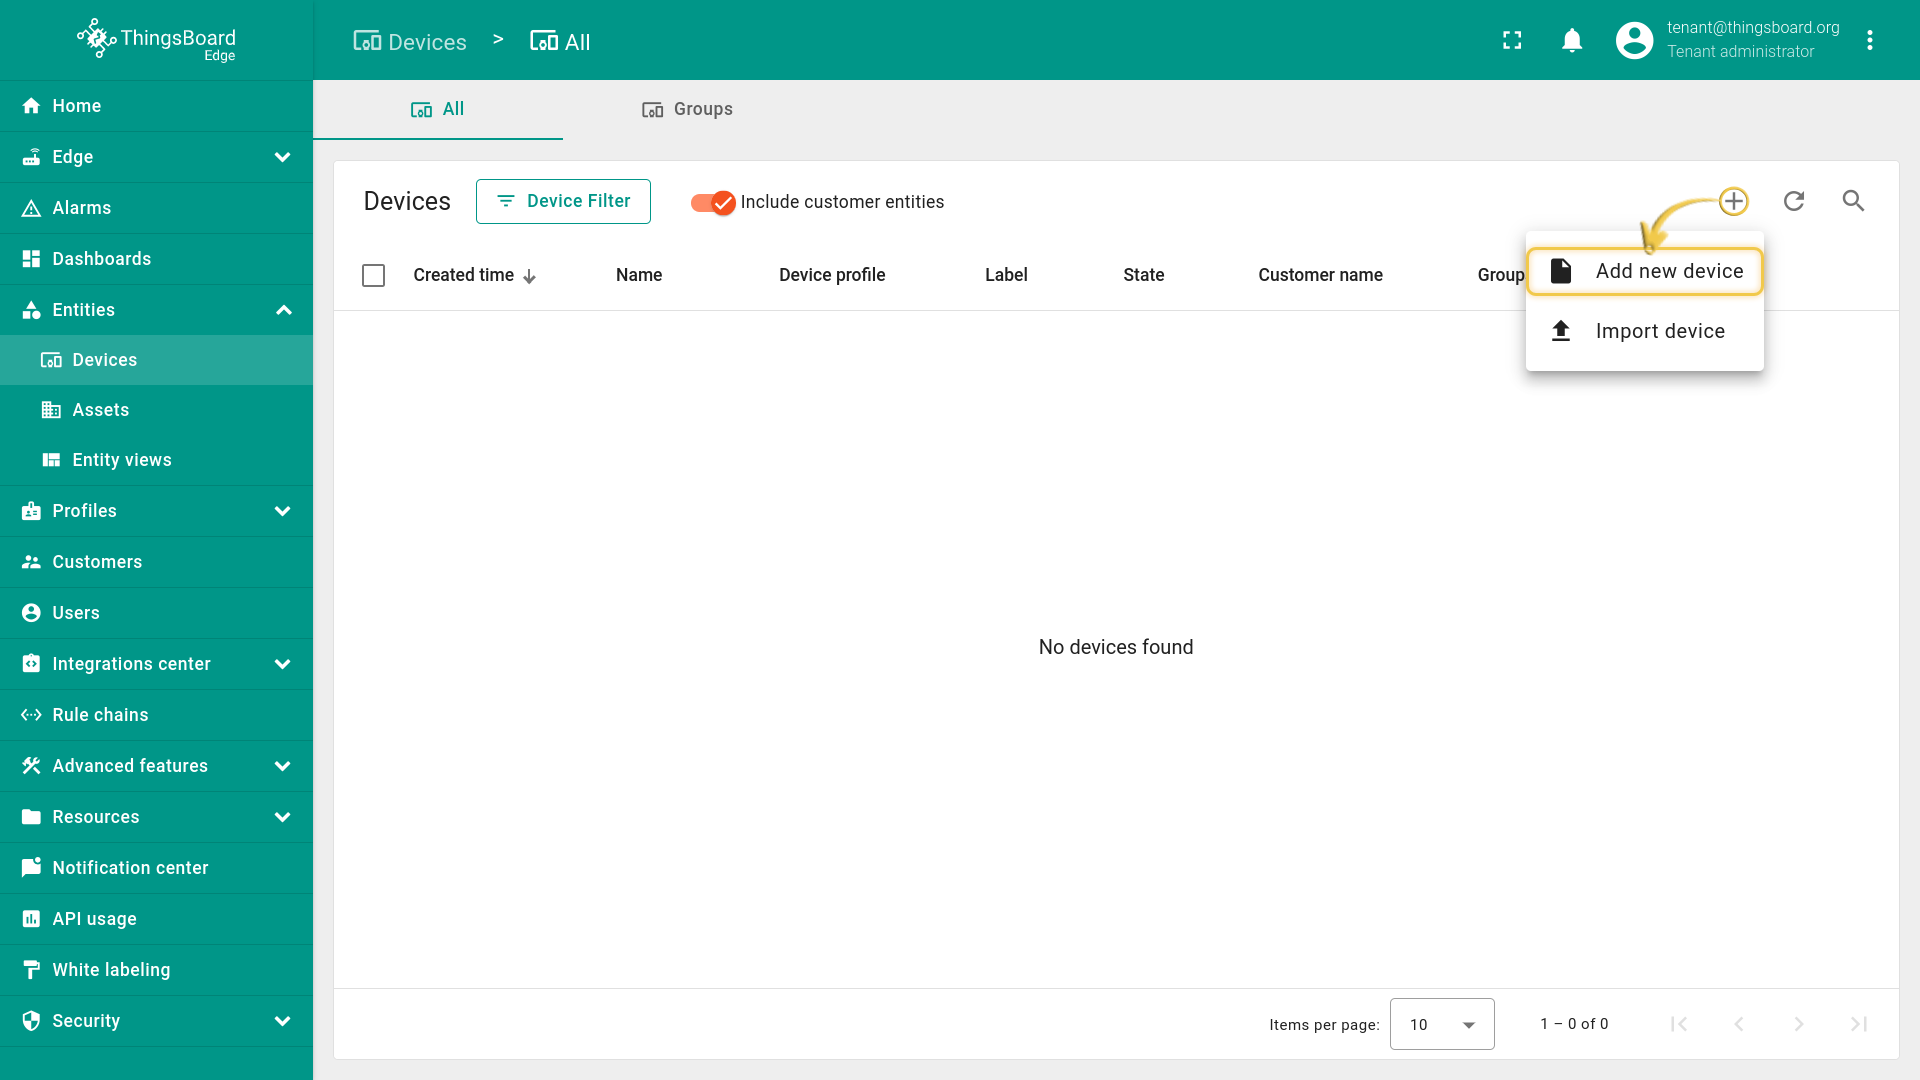
- Click on the "Add device" ("+") icon in the top right corner of the table to create a device. Then click "Add new device".
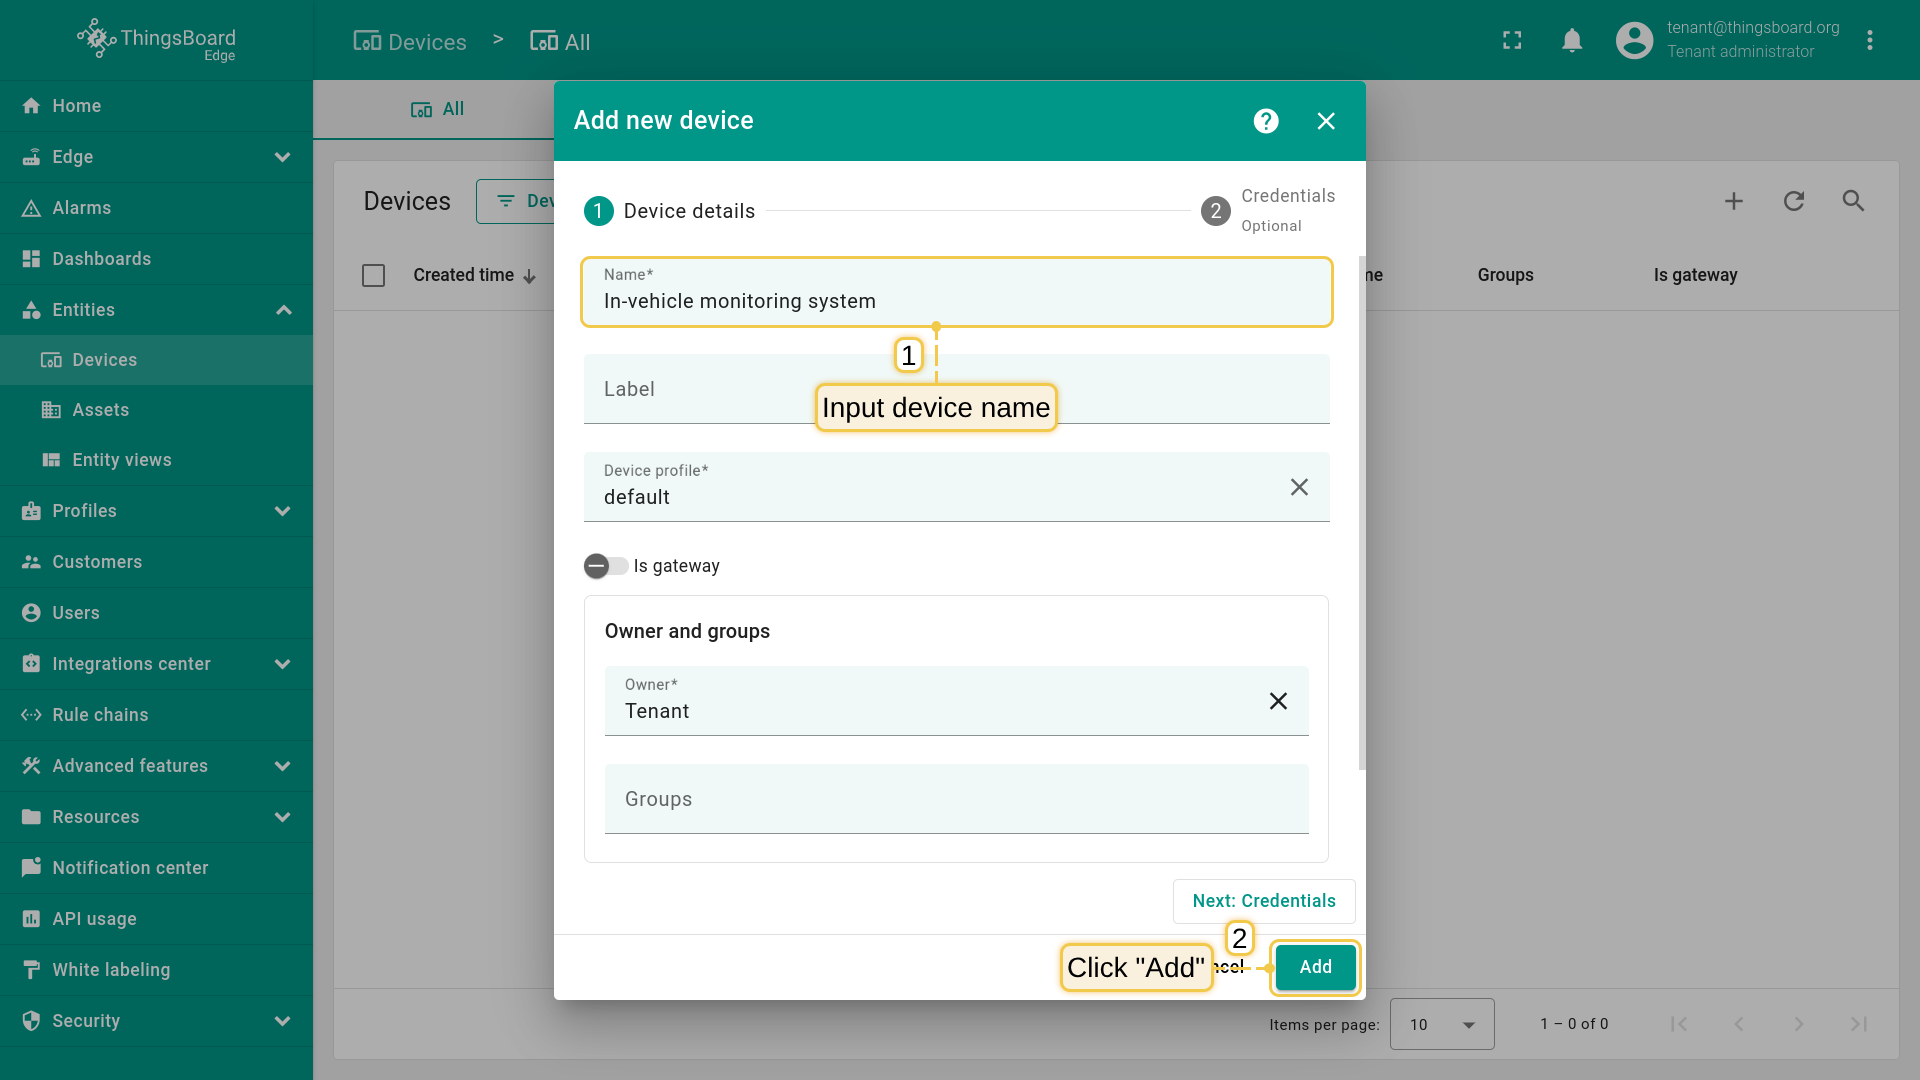
- Input the device Name, e.g., "In-vehicle monitoring system". Then click the "Add" button.
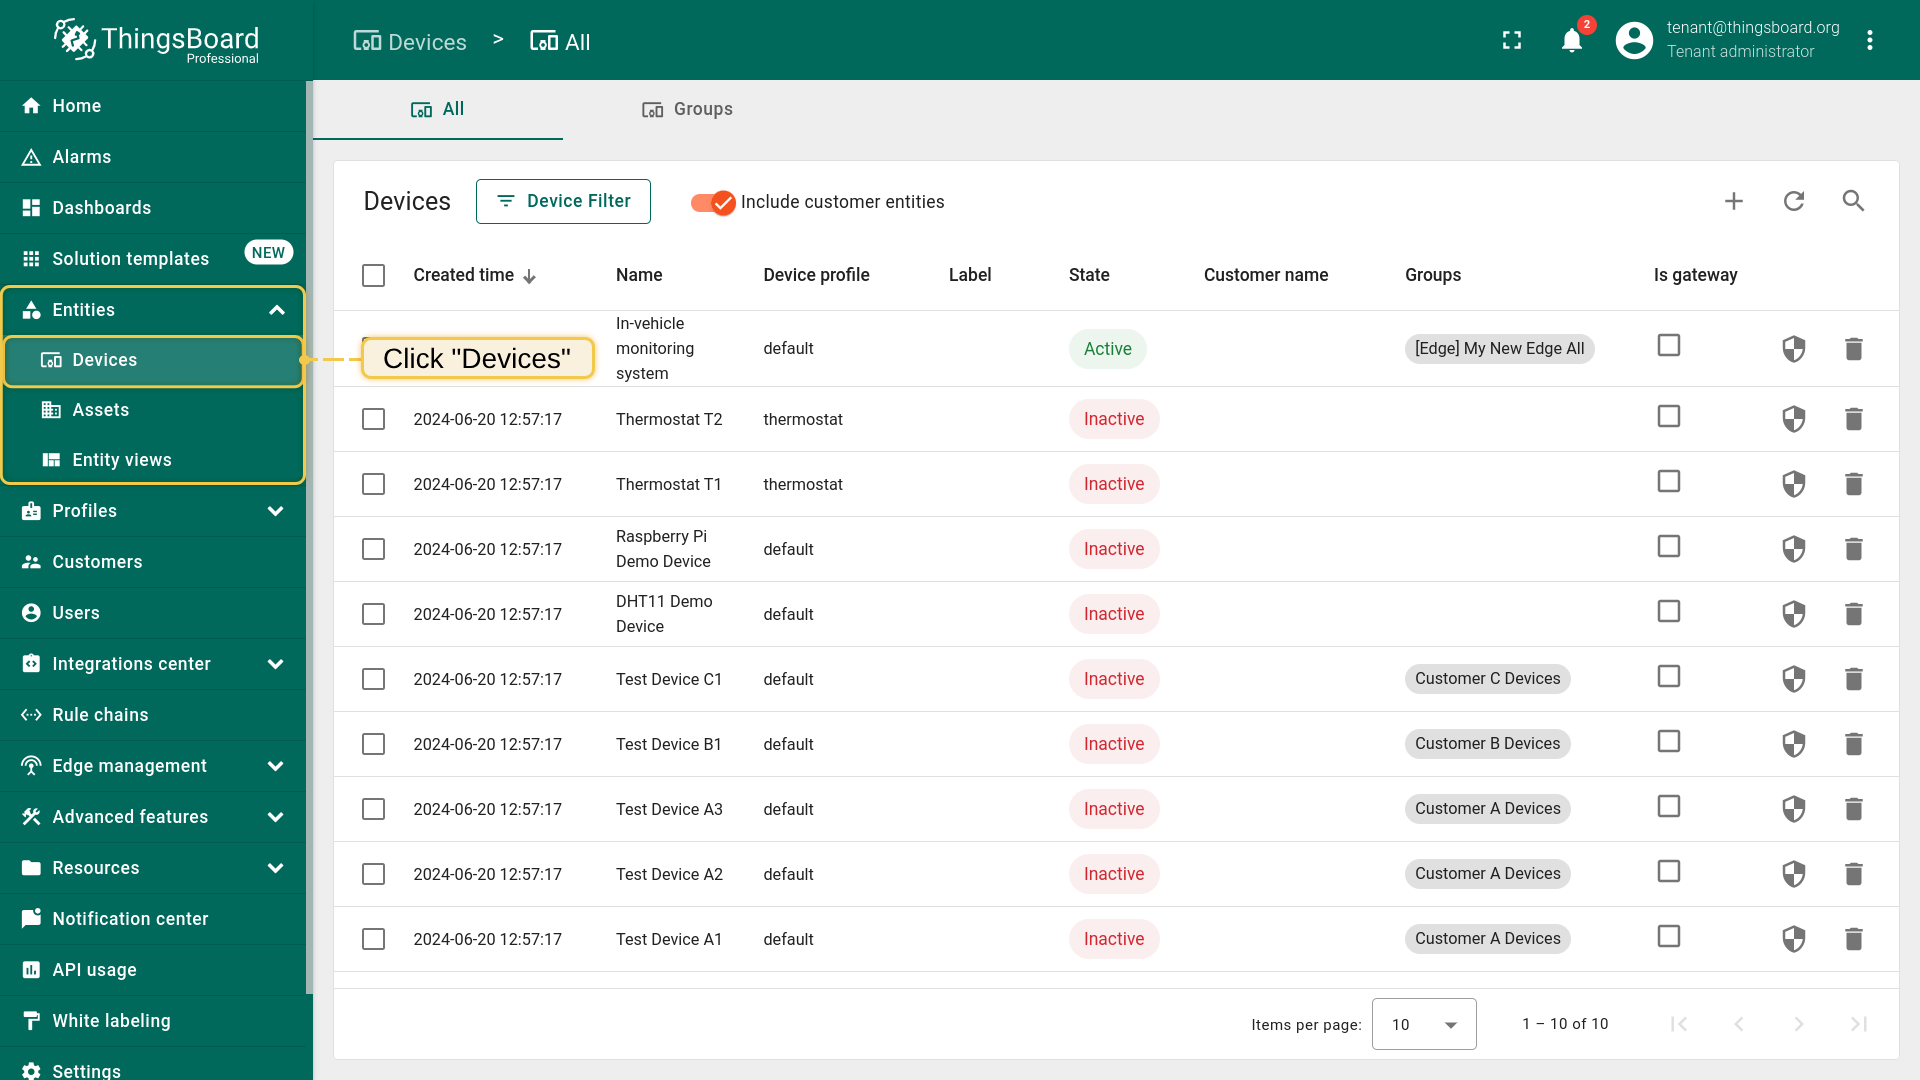
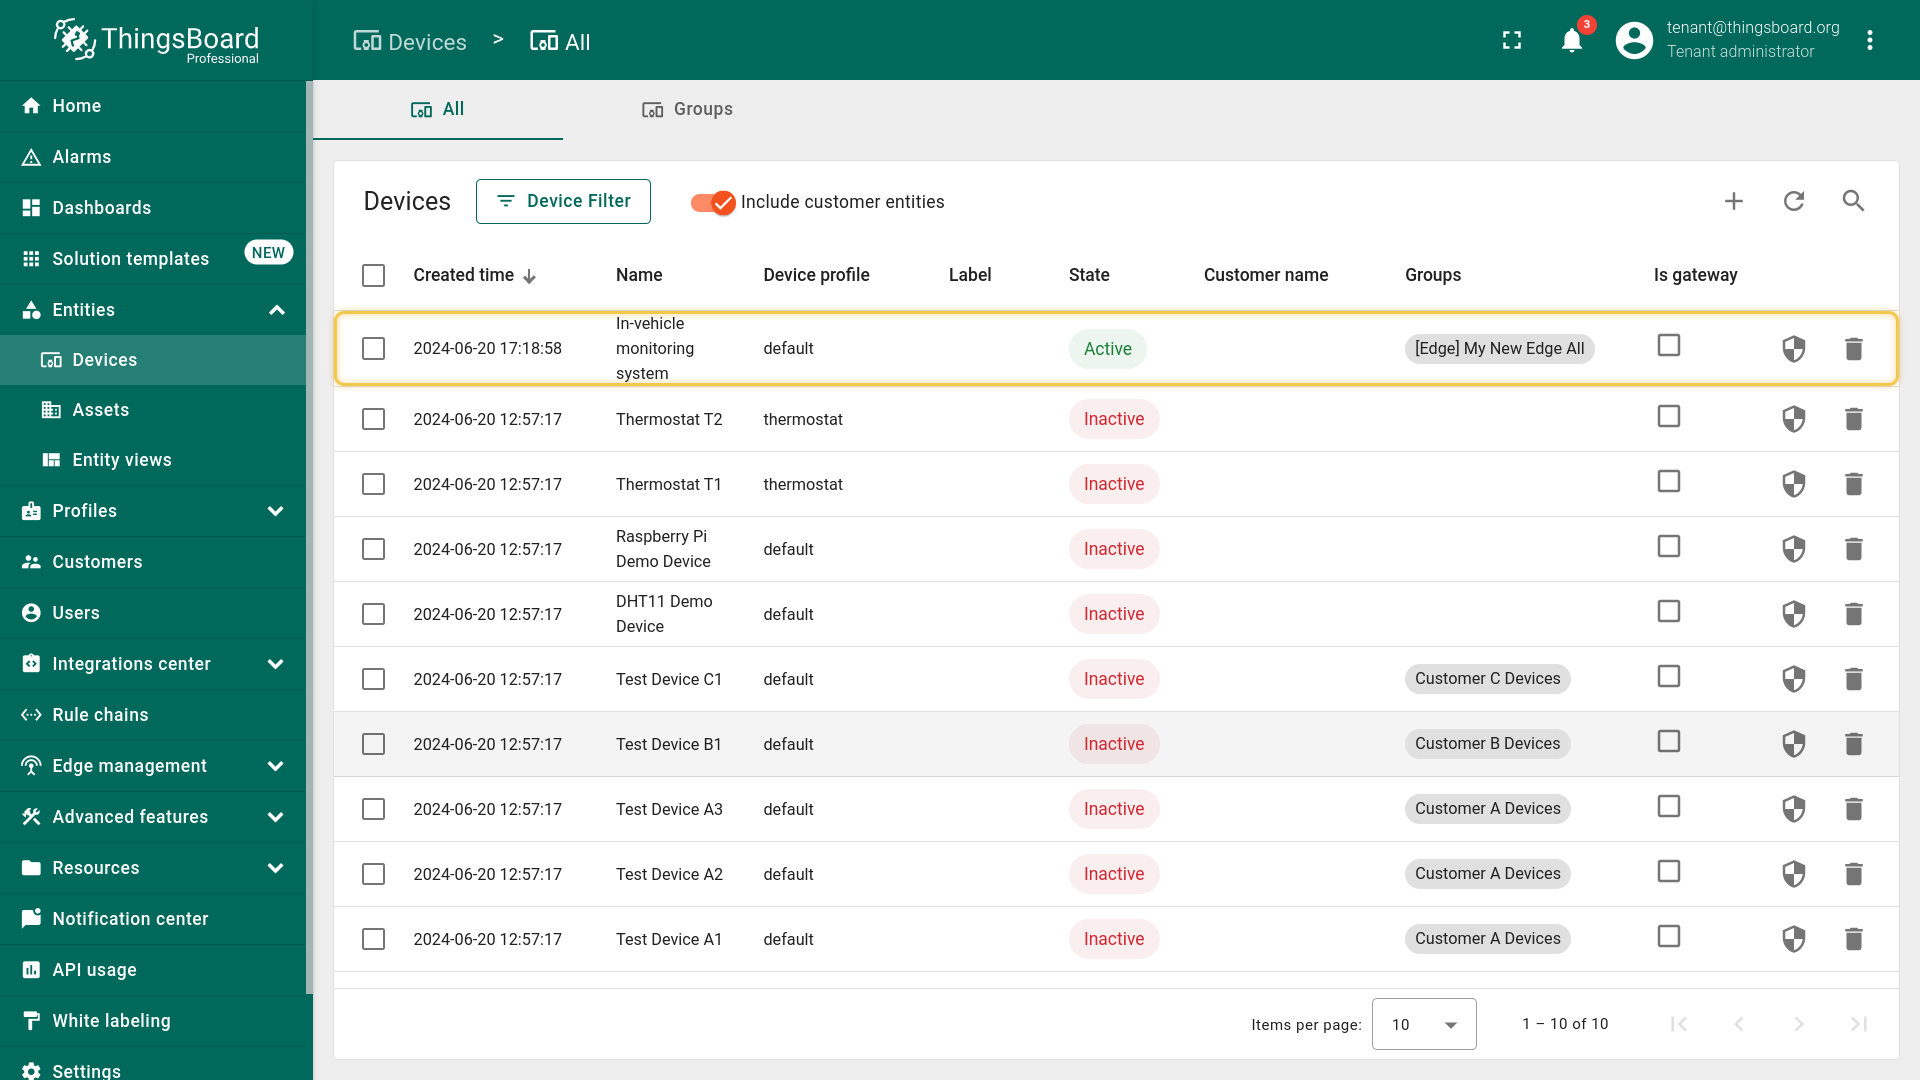
- Verify that your "In-vehicle monitoring system" device is listed in the devices table.

Please open ThingsBoard using the URL SERVER_URL:
- Log in to your ThingsBoard PE instance. Navigate to the "Devices" page.
- Verify that the "In-vehicle monitoring system" device is listed in the devices list.
Configure edge rule engine to push filtered data to the cloud
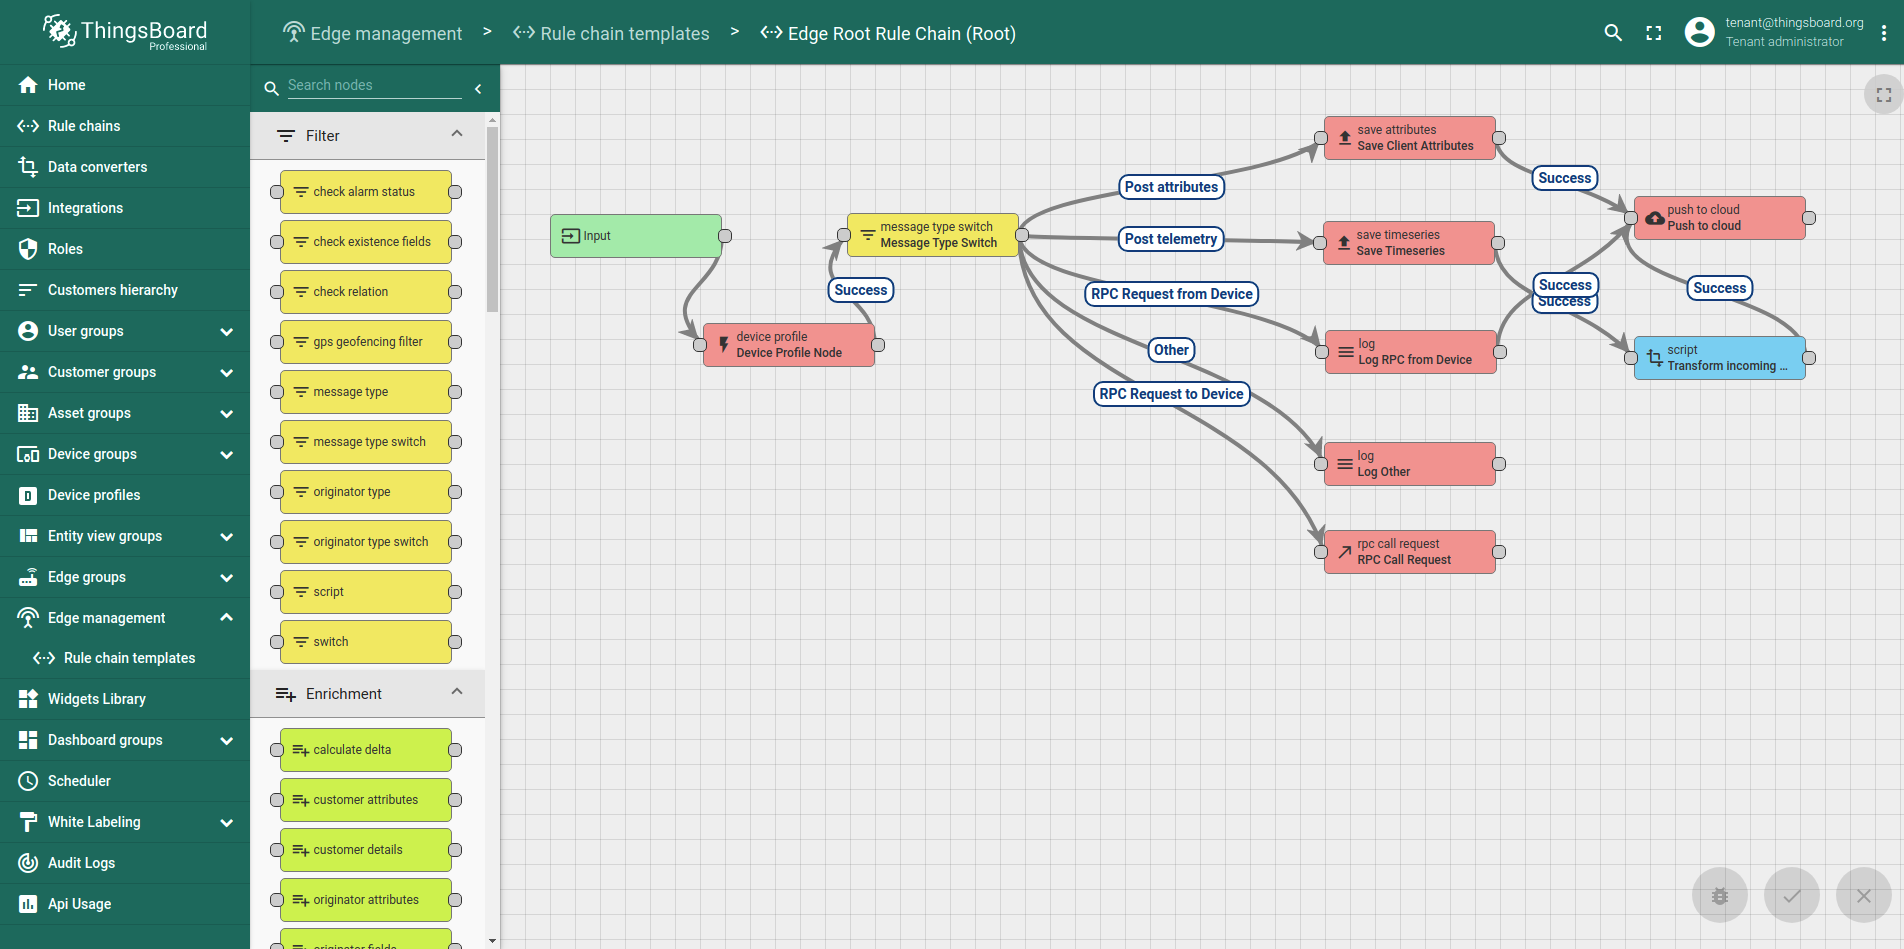
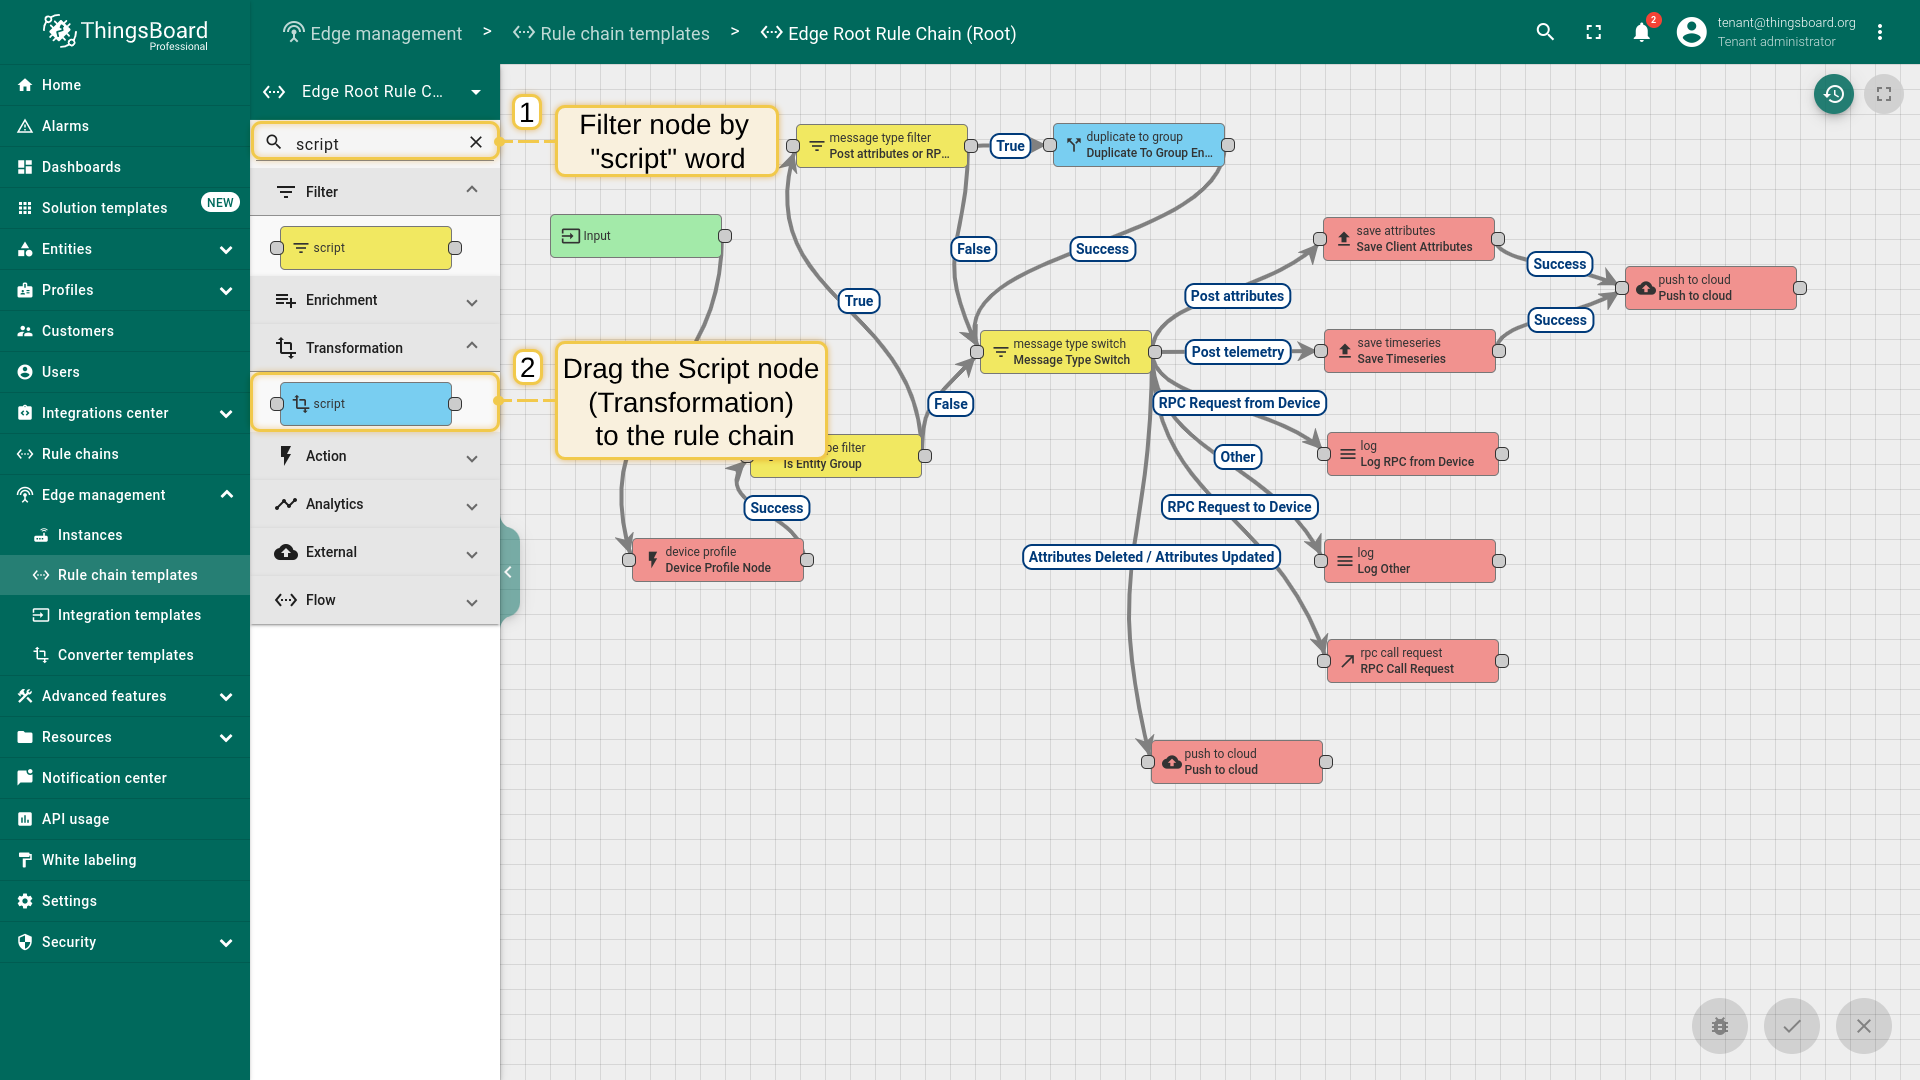
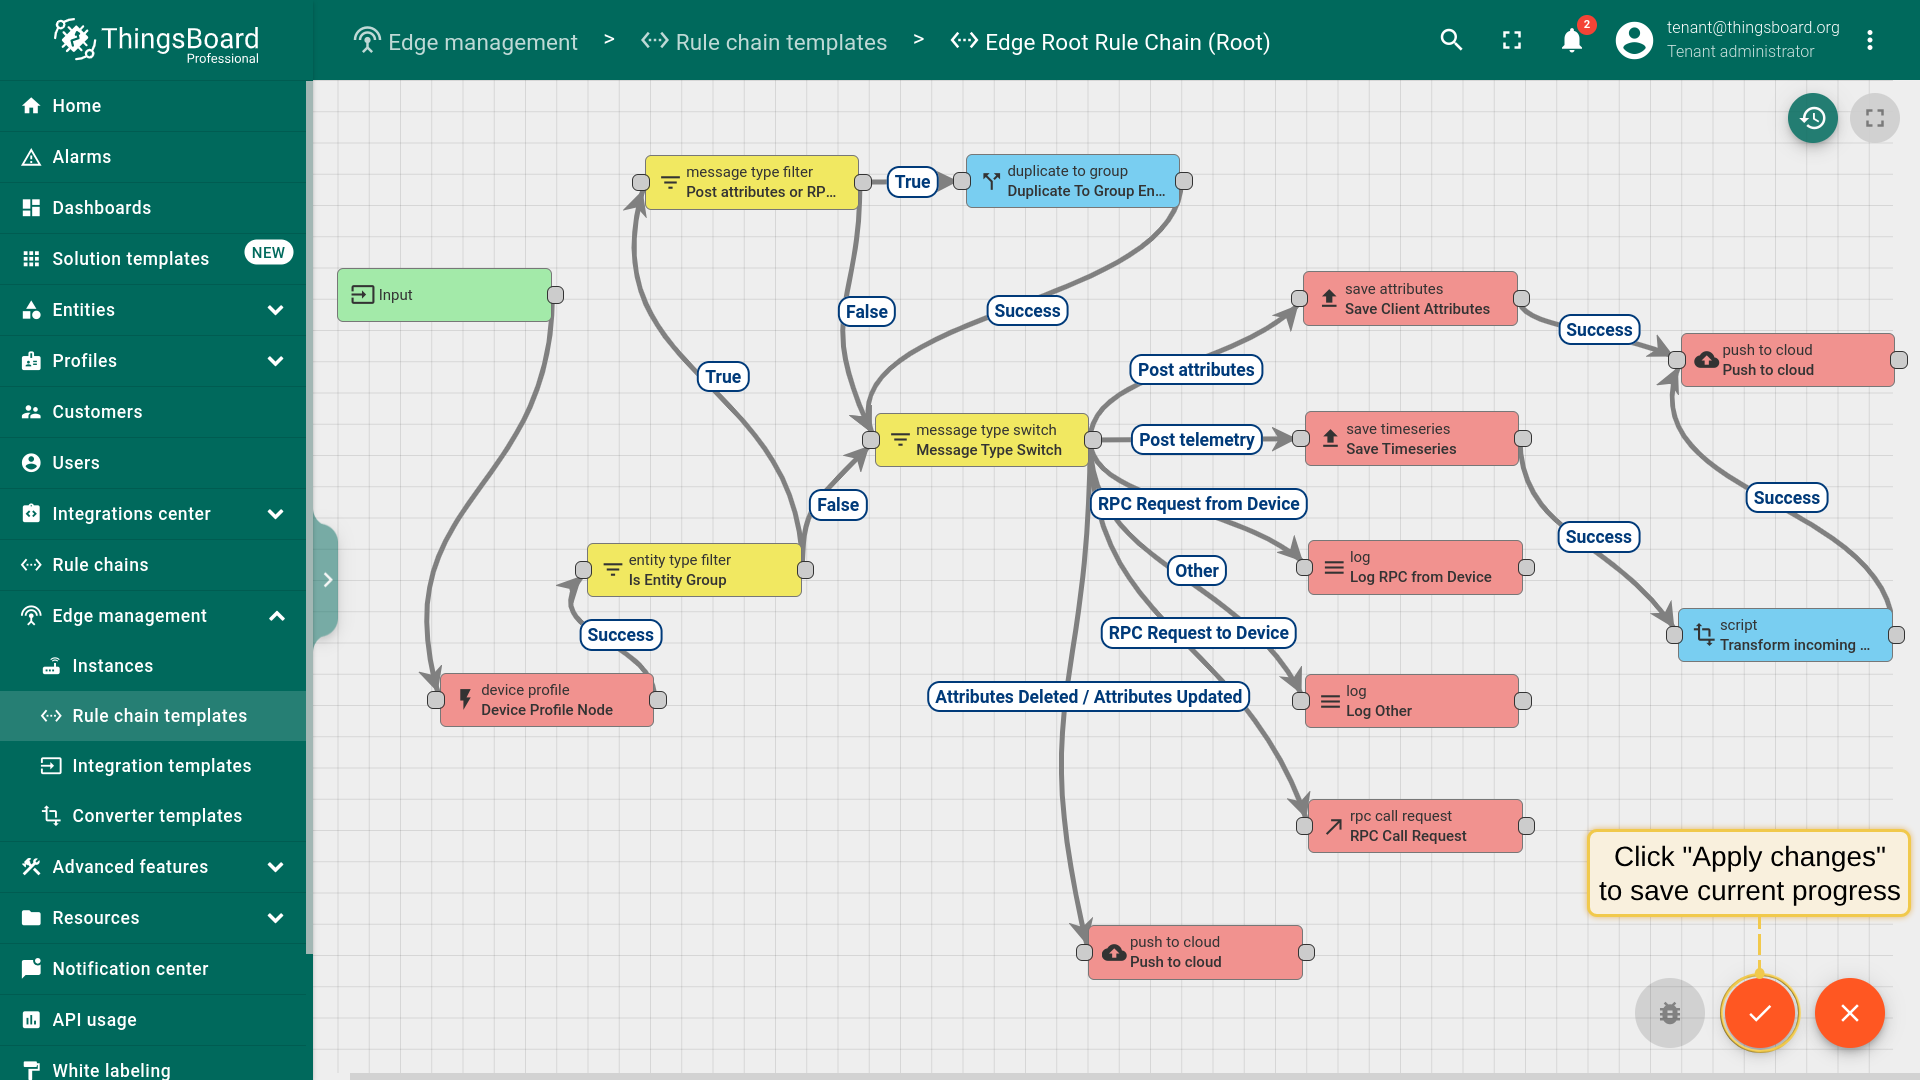
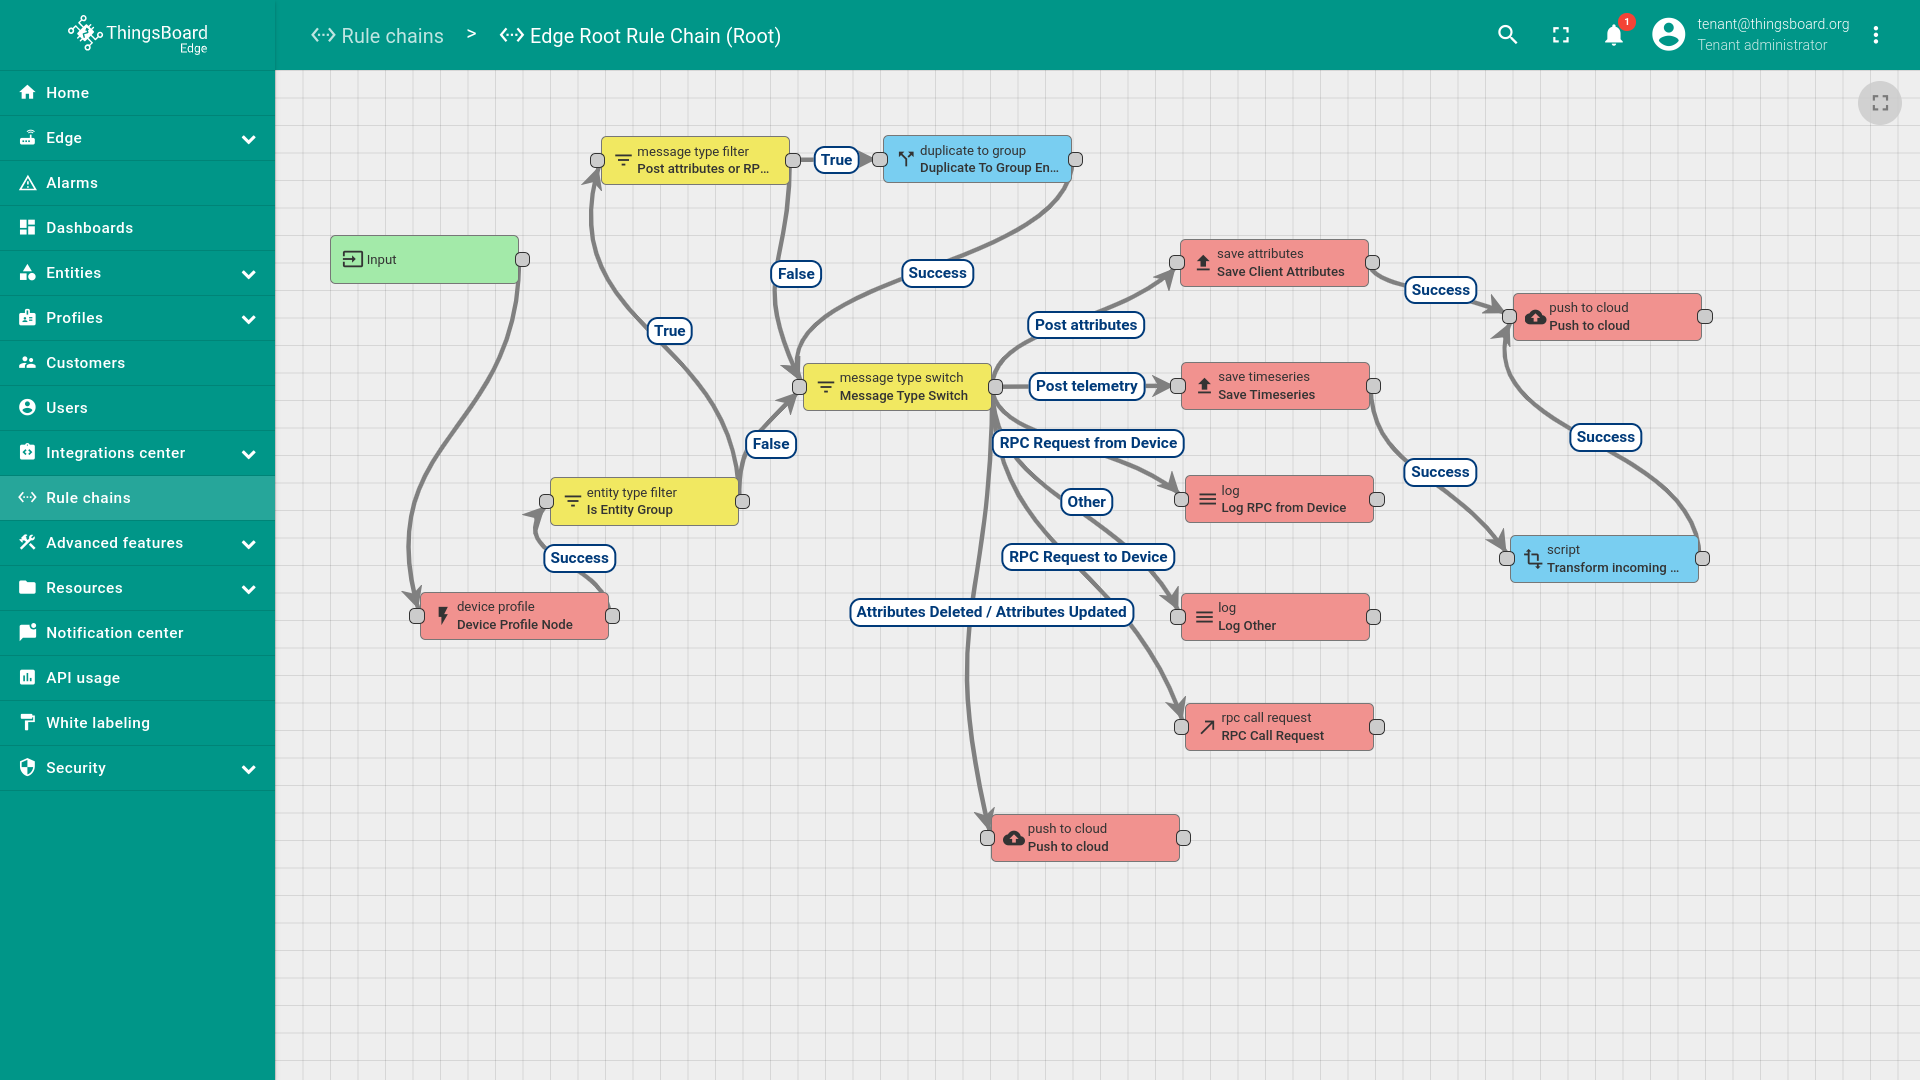
We will update “Edge Root Rule Chain” that will be saving on the edge 10 sensor readings. In the rule chain we add rule node that transforms incoming messages and pushes to the cloud message only with distance readings. Here is the final configuration of the edge root rule chain:
In the next steps, we will create a TBEL node to filter data. The TBEL script language node will create an empty object newMsg, add a property named “distance” with the corresponding value from the “In-vehicle monitoring system”, and then send the newMsg object as a new message.
1
2
3
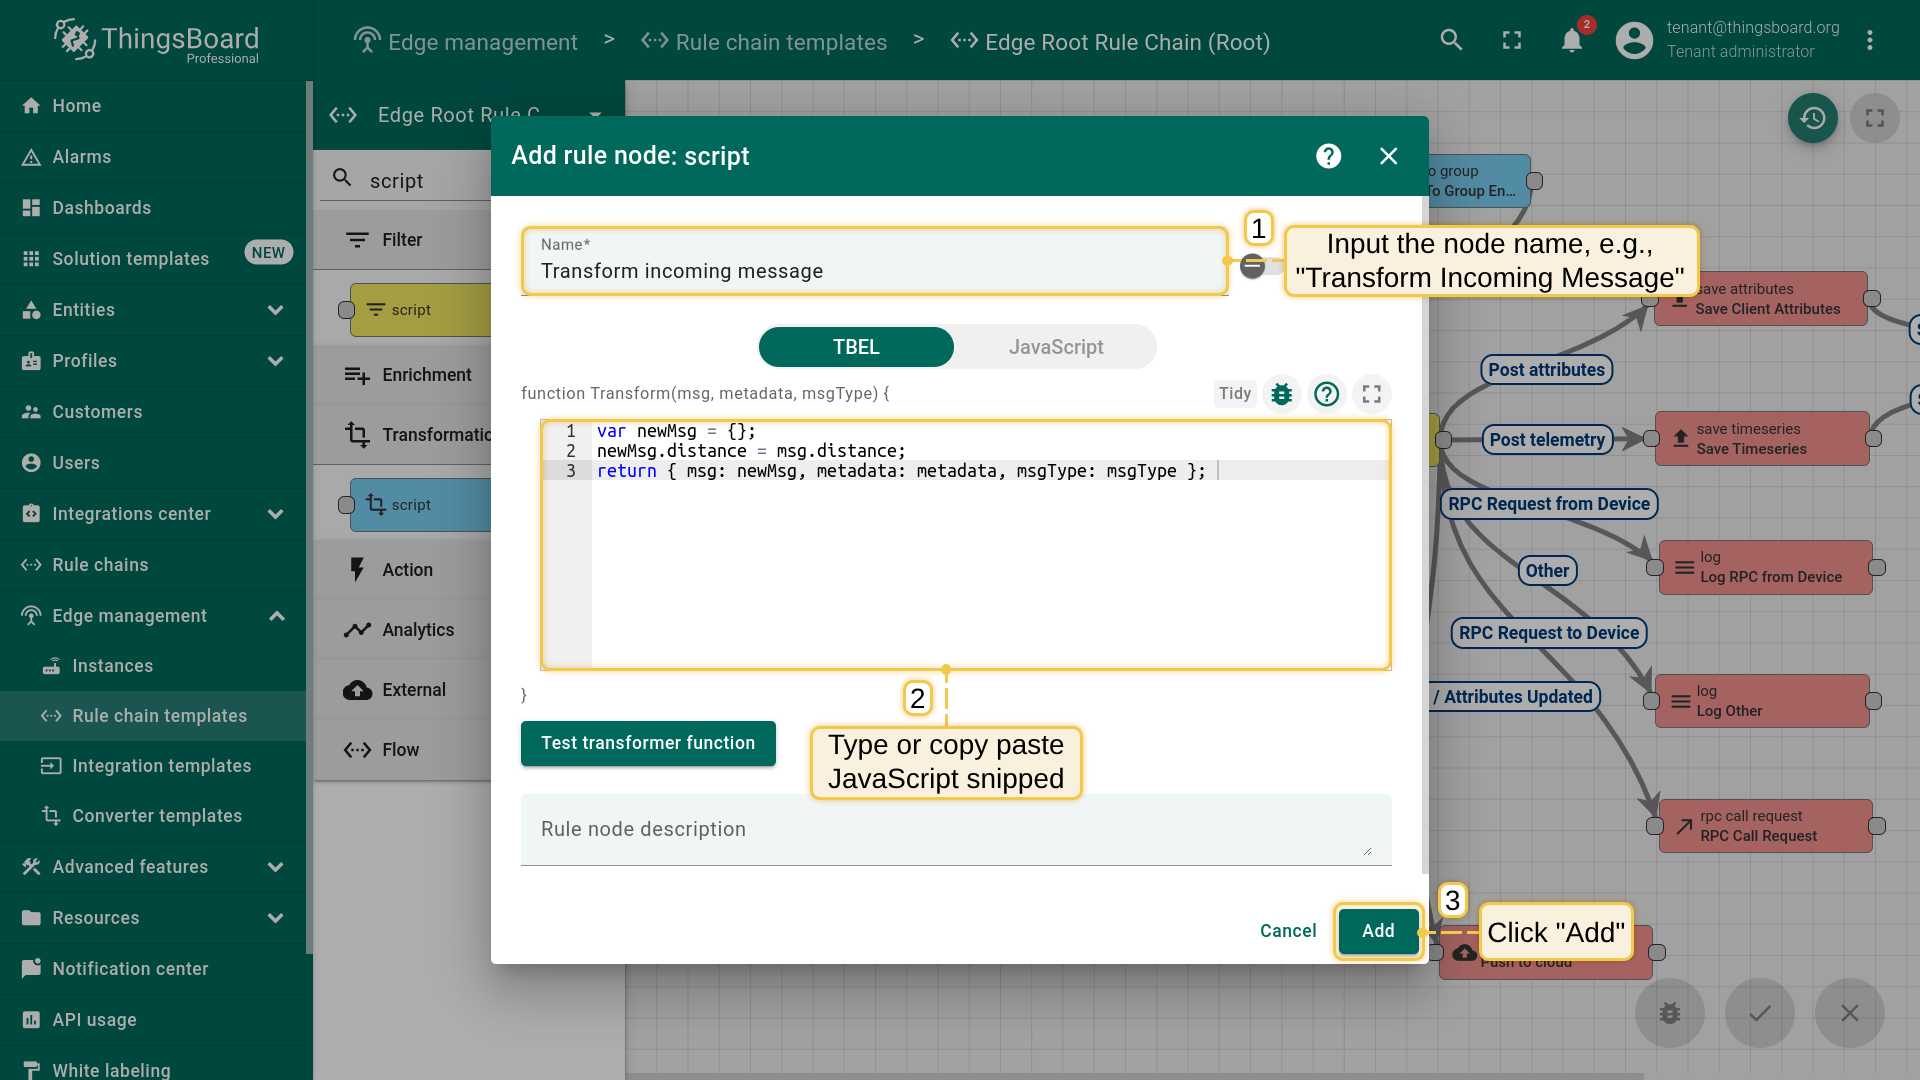
var newMsg = {};
newMsg.distance = msg.distance;
return { msg: newMsg, metadata: metadata, msgType: msgType };
Here are the steps to update the default Edge “Root Rule Chain” with the provided rule chain:
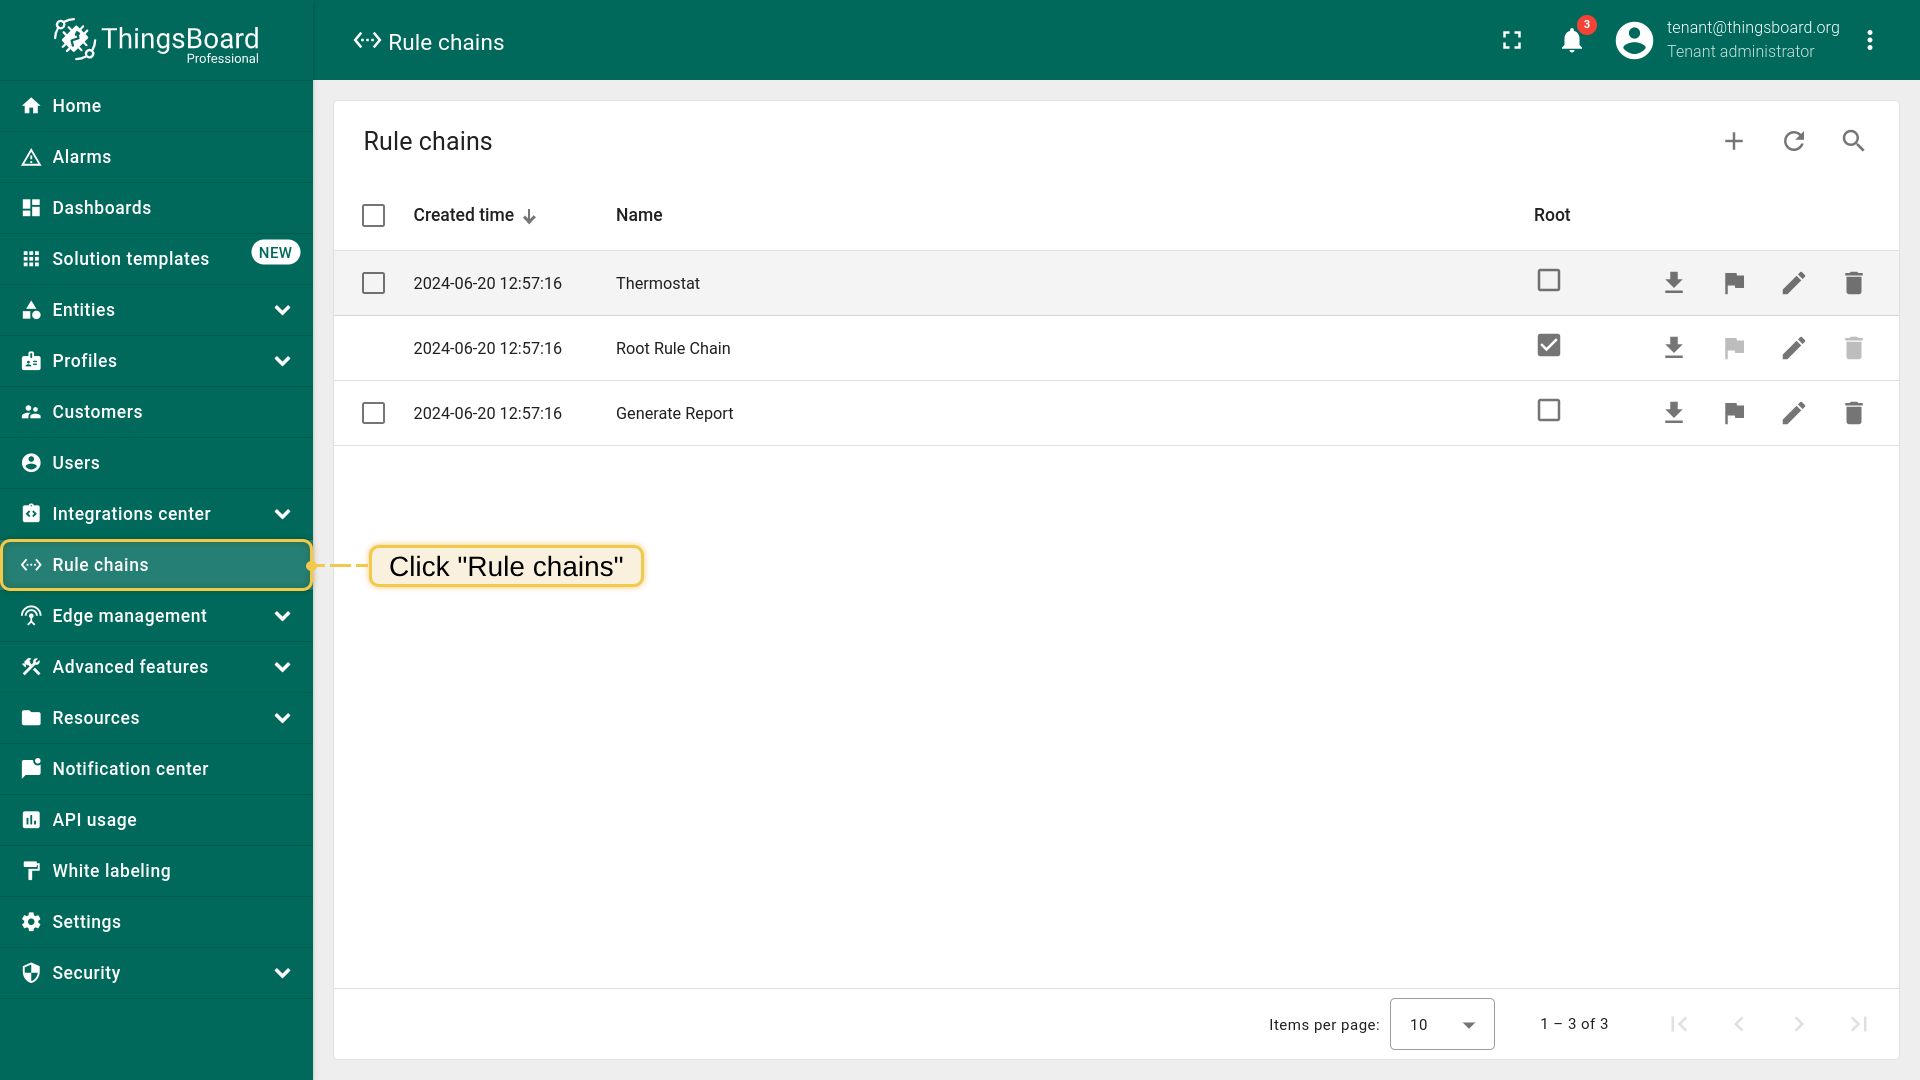
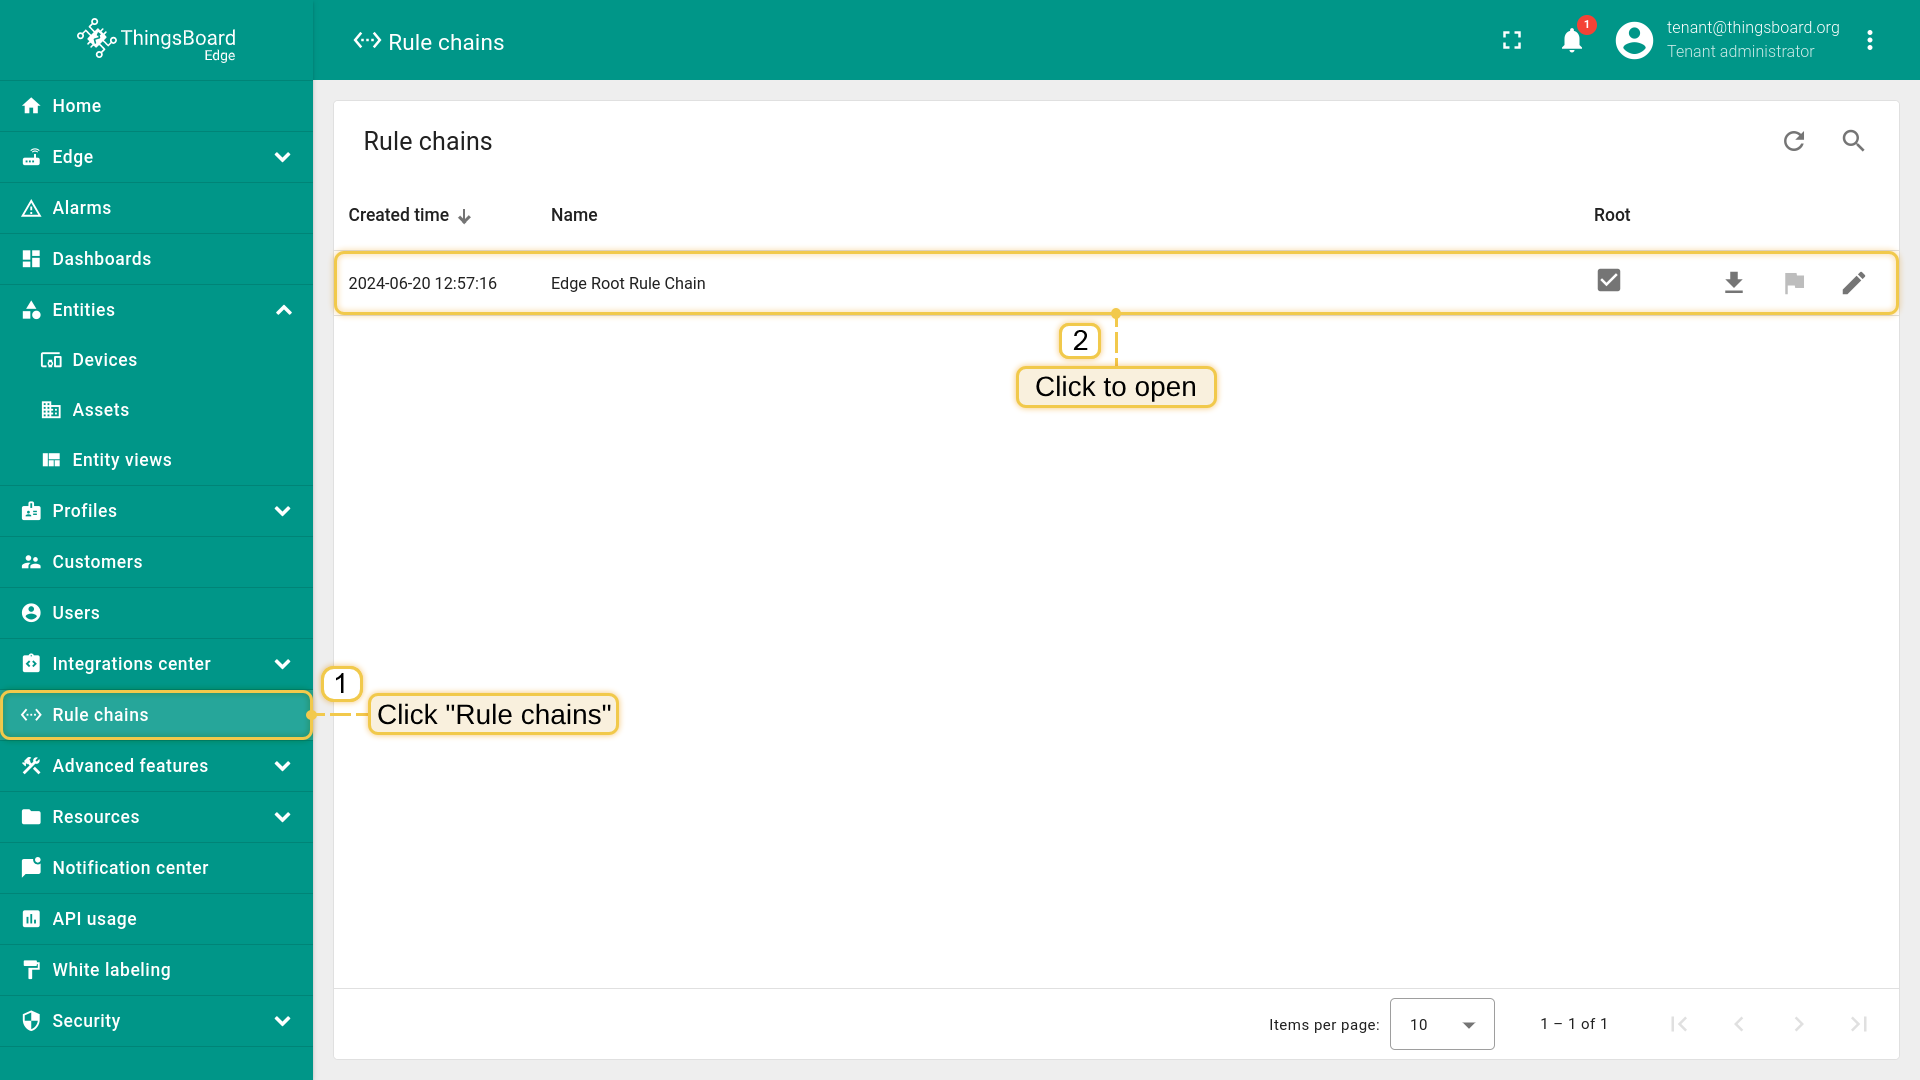
- Log in to your ThingsBoard PE instance and navigate to the "Rule chains" page.
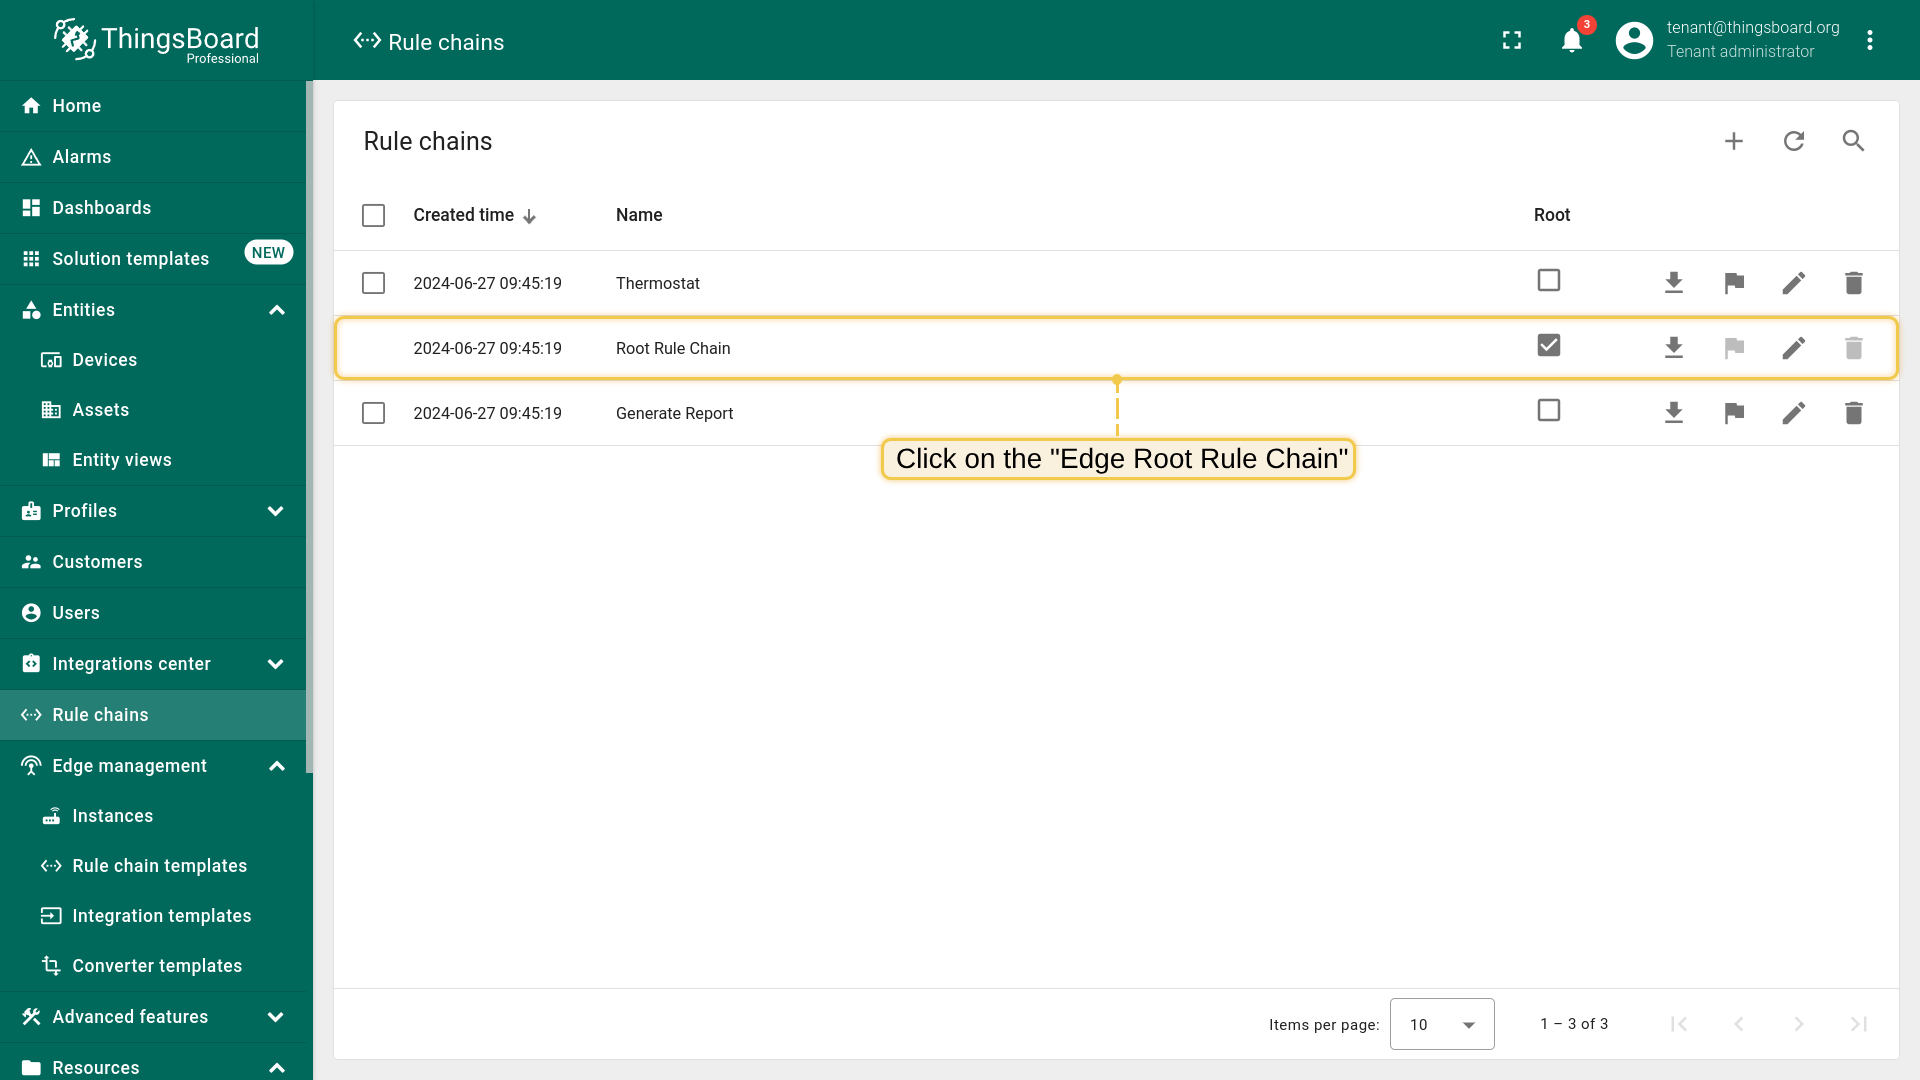
- Click on the "Edge Root Rule Chain" to enter edit mode.
- Search for the "script" node using the query "script". Drag the "Transformation" node into the rule chain.
- Enter a Name, e.g., "Transform incoming message", and paste the JavaScript code (from the snippet above) to process only the "distance" readings parameter. Click "Add" to proceed.
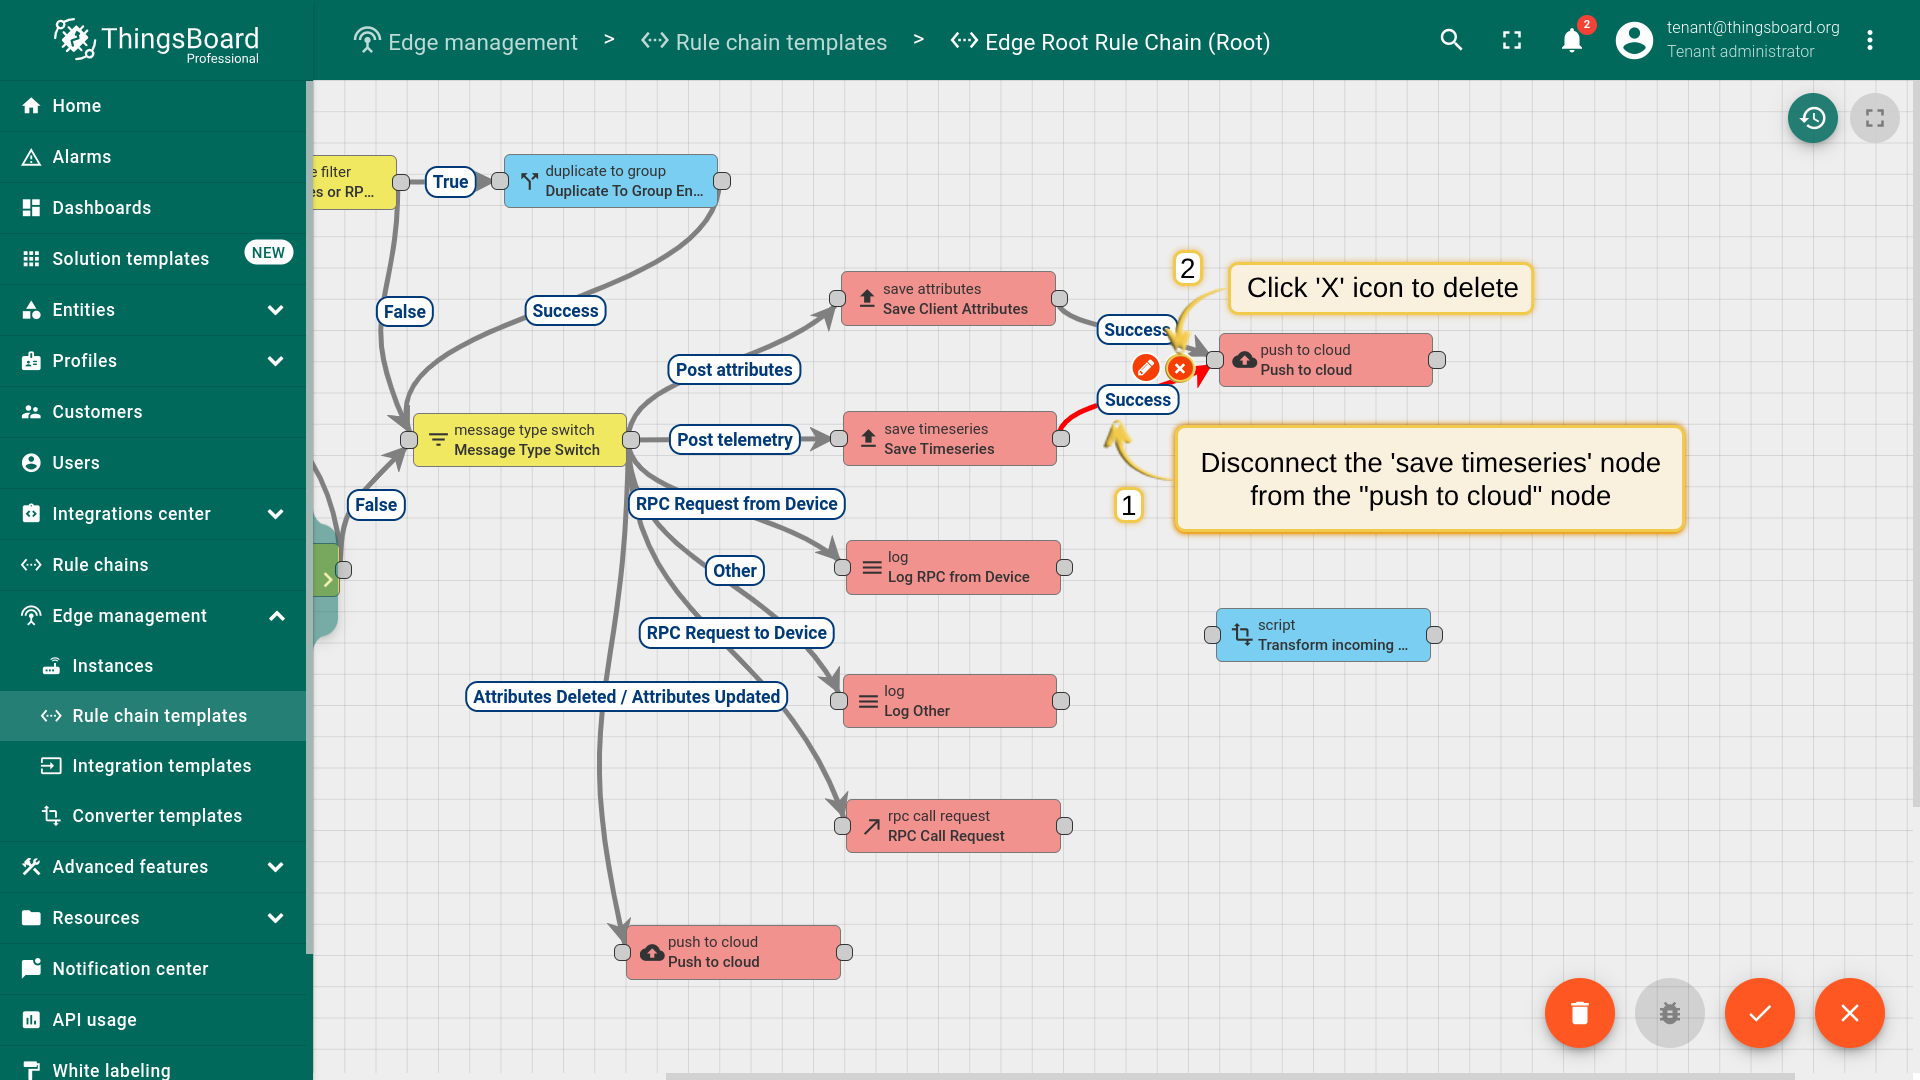
- Disconnect the "save time series" node from the "push to cloud" node.
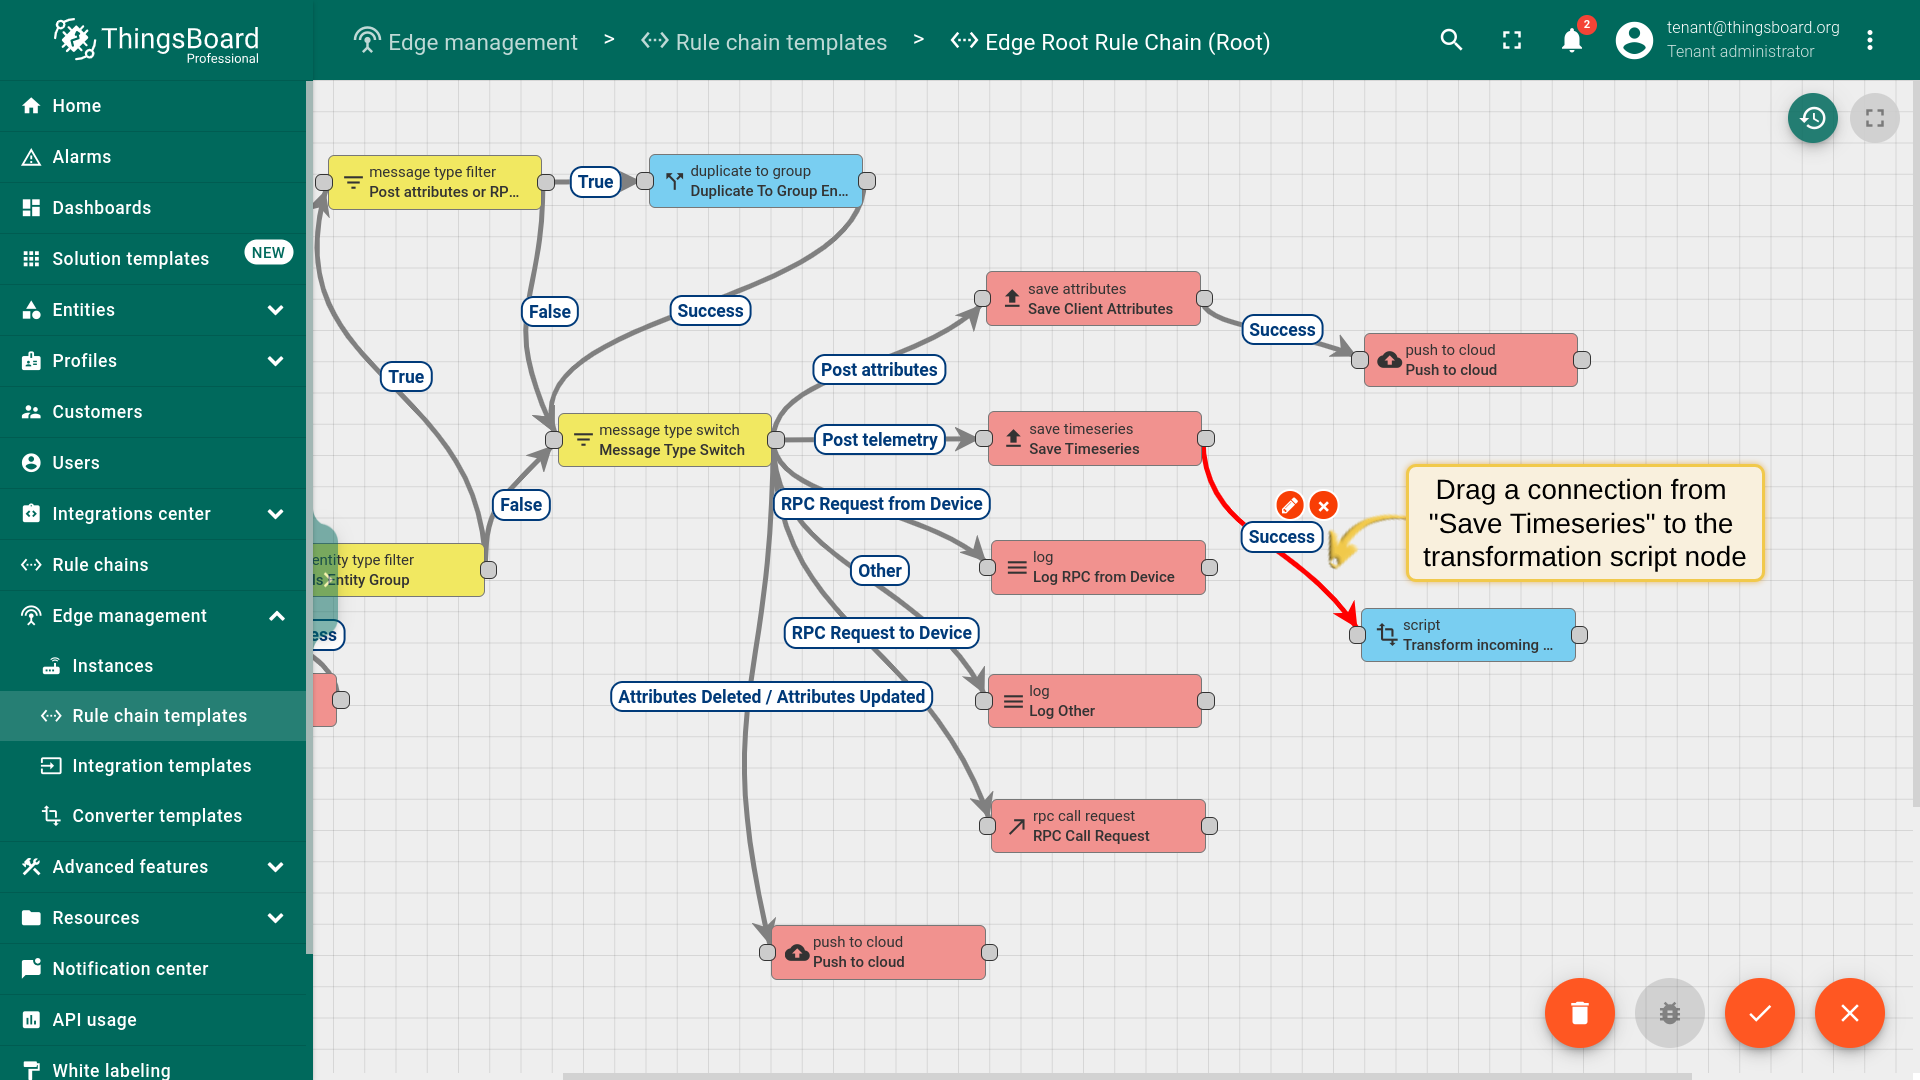
- Connect "save time series" node to the "Transform incoming message" node.
- Choose "Success" from the dropdown list, and click the "Add" button.
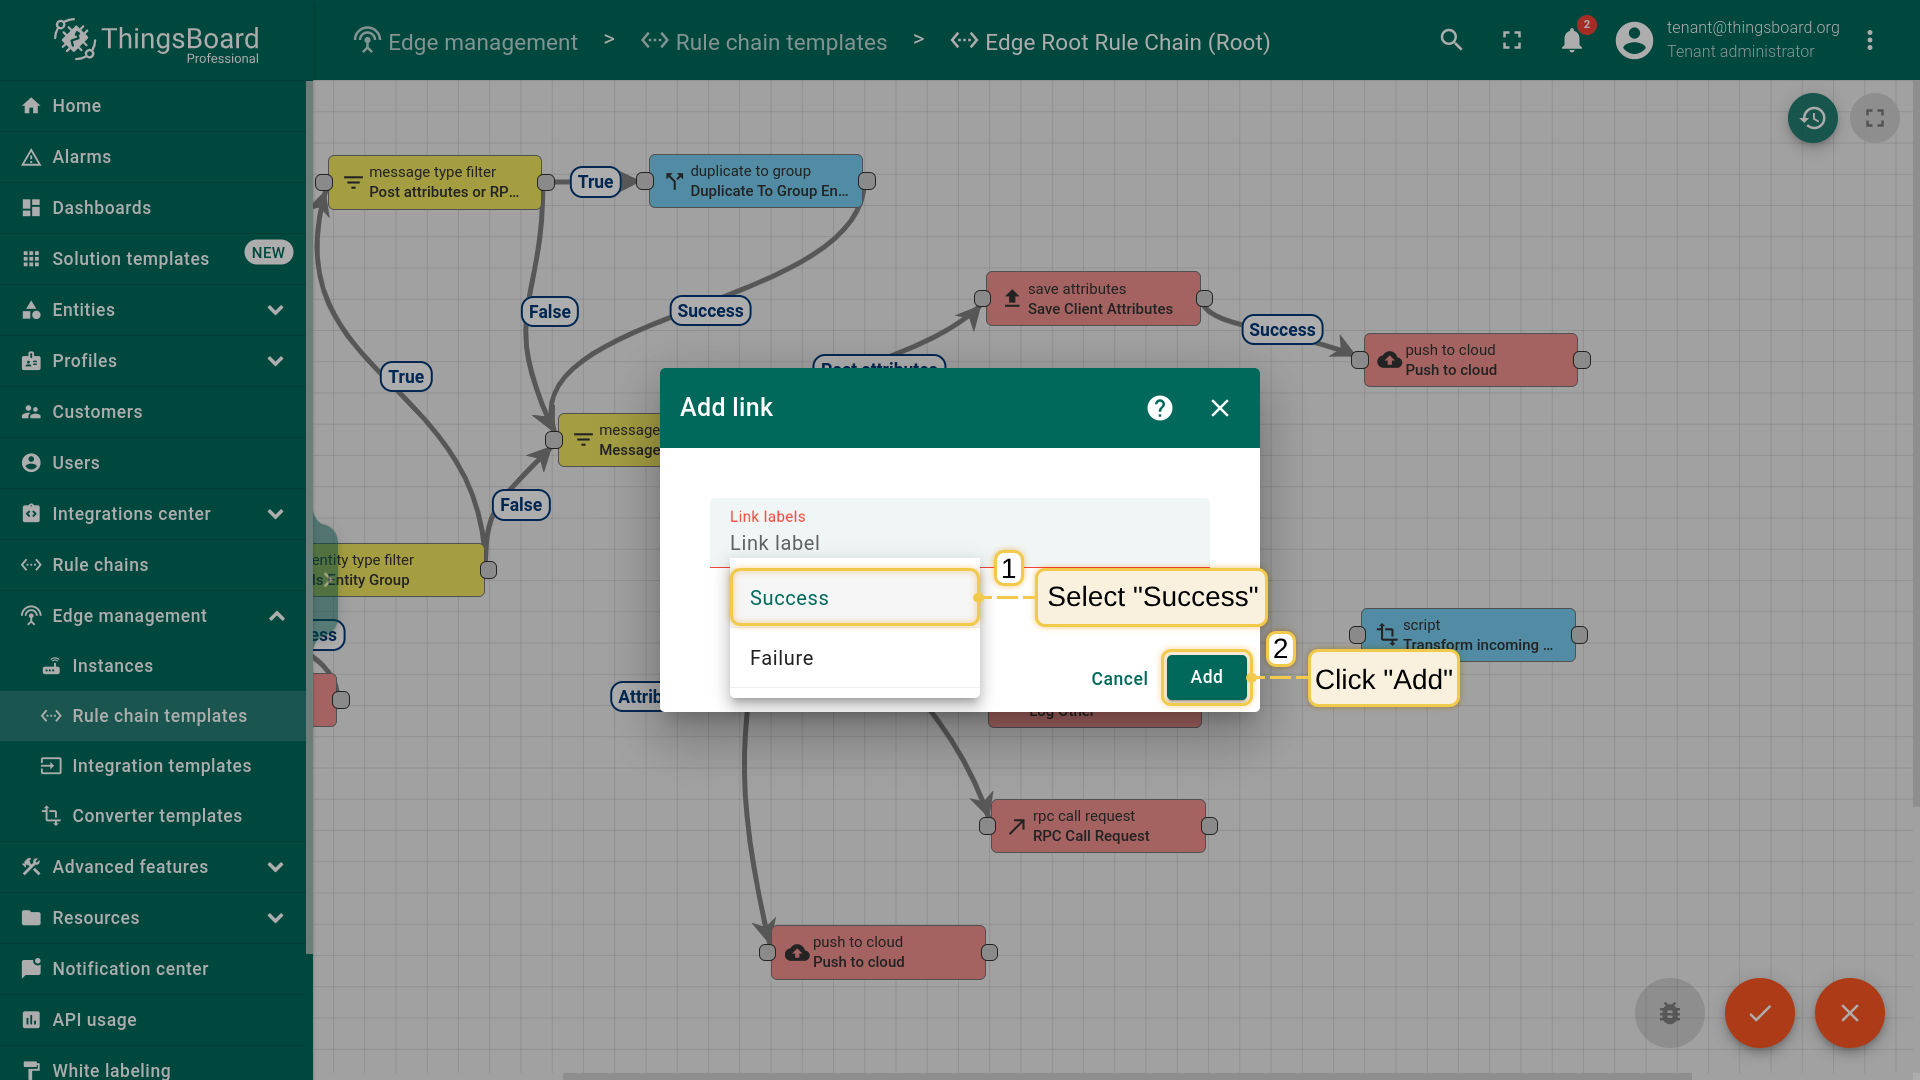
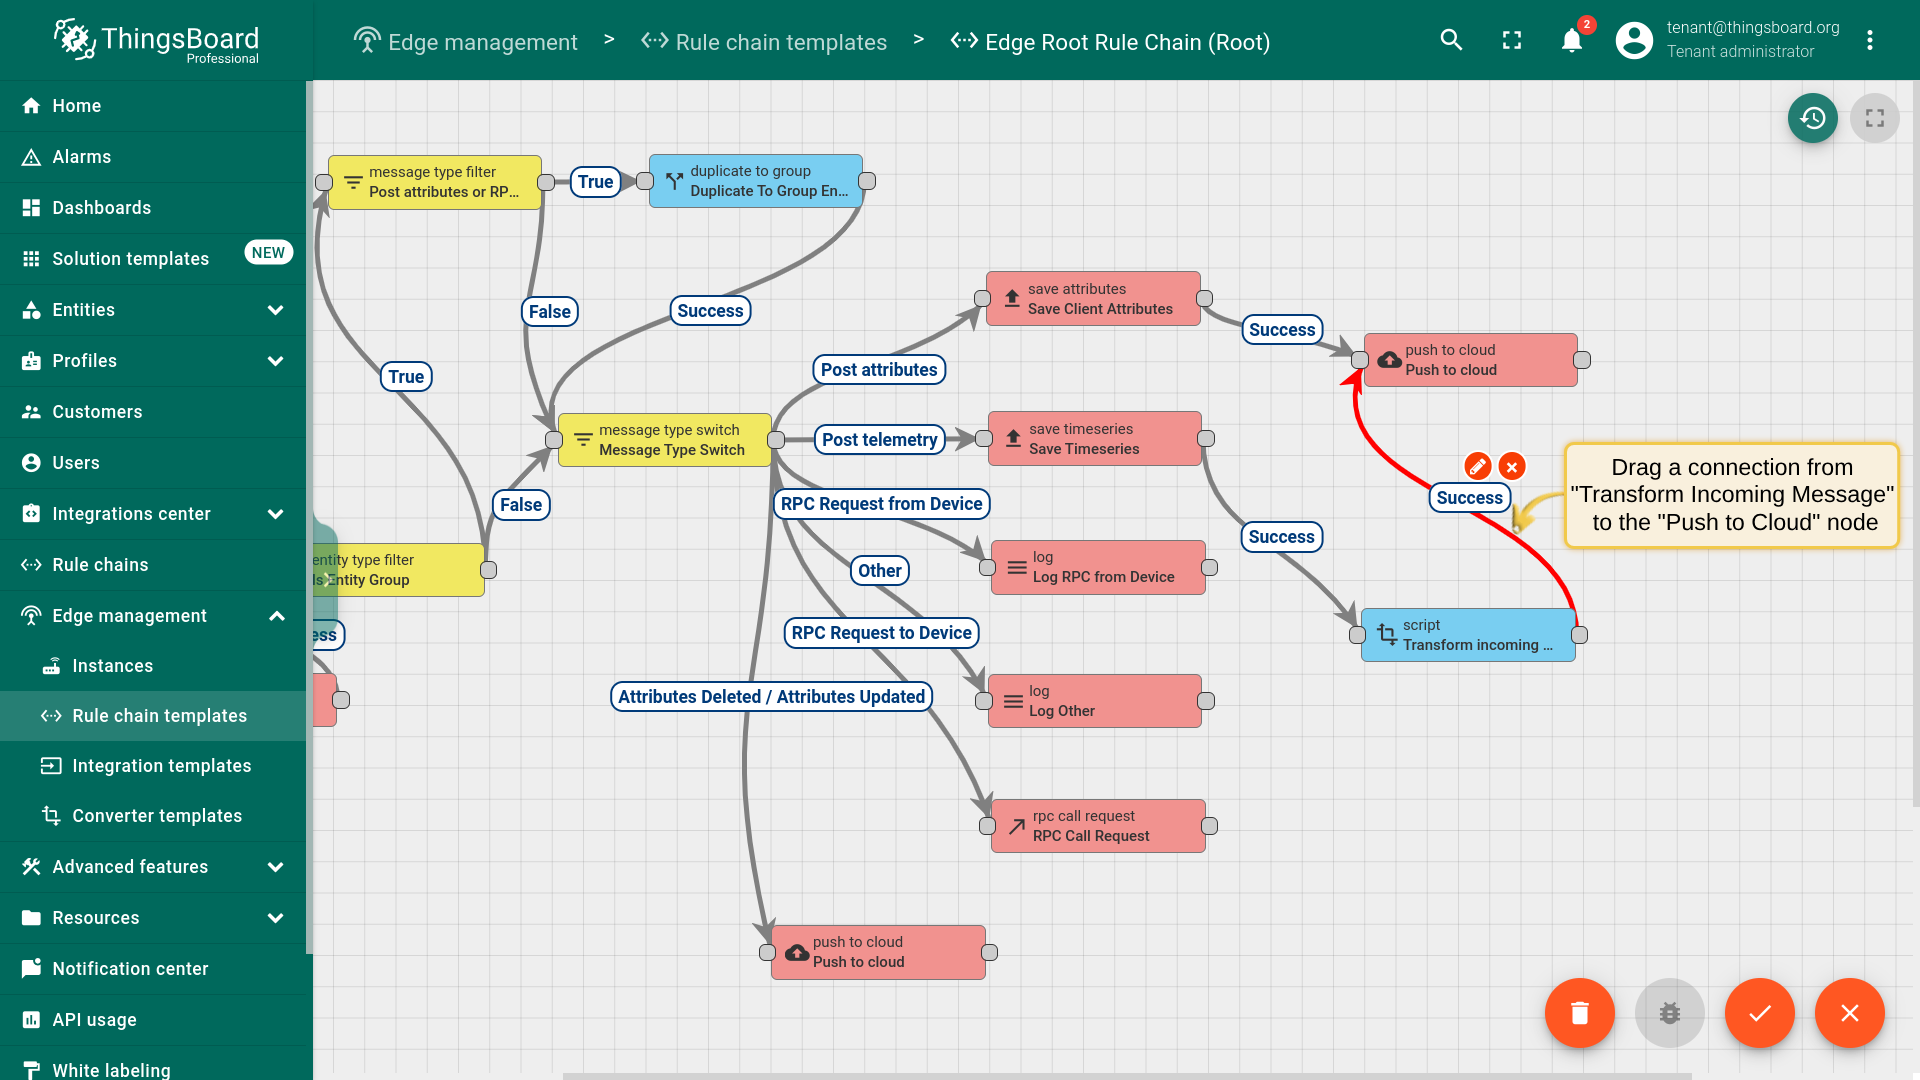
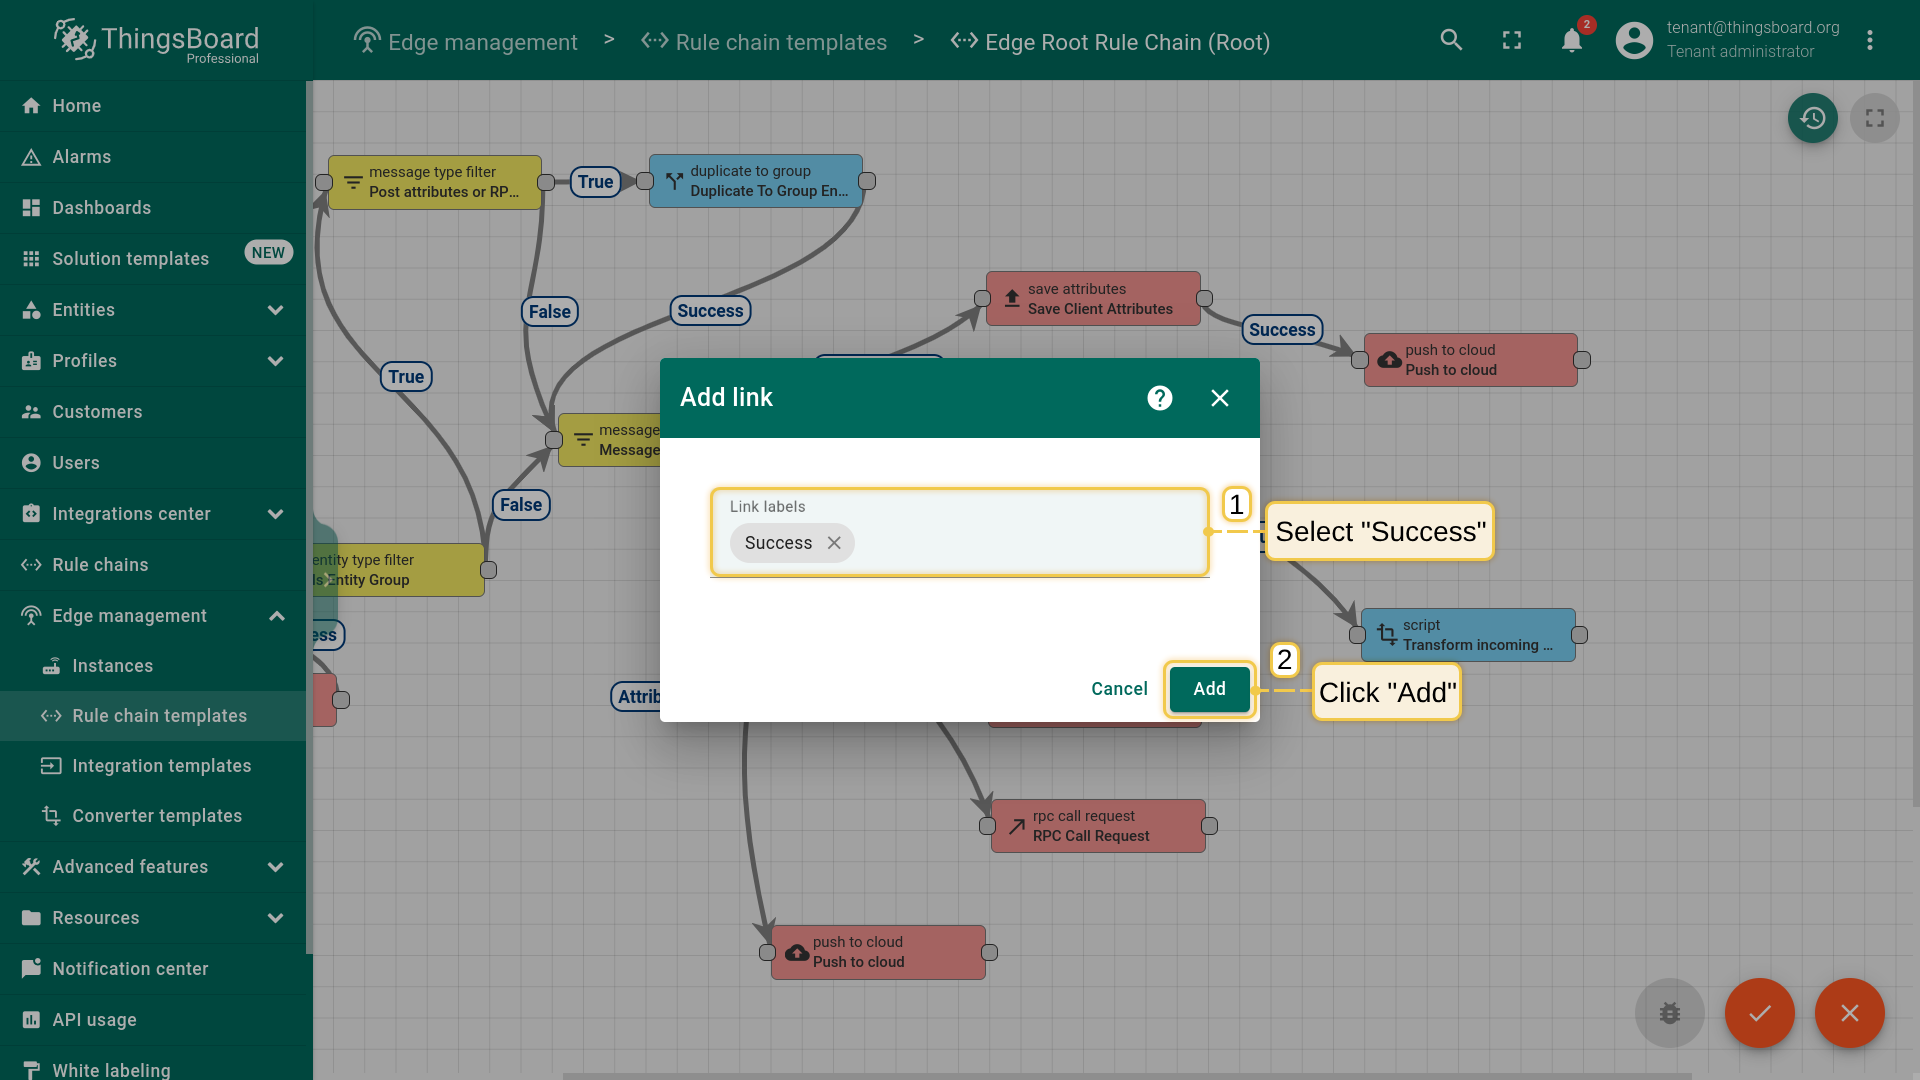
- Connect "Transform incoming message" to the "Push to cloud" node.
- Choose "Success" from the dropdown list, then click the "Add" button to establish the connection.
- Click on the "Apply changes" icon to save your current progress.
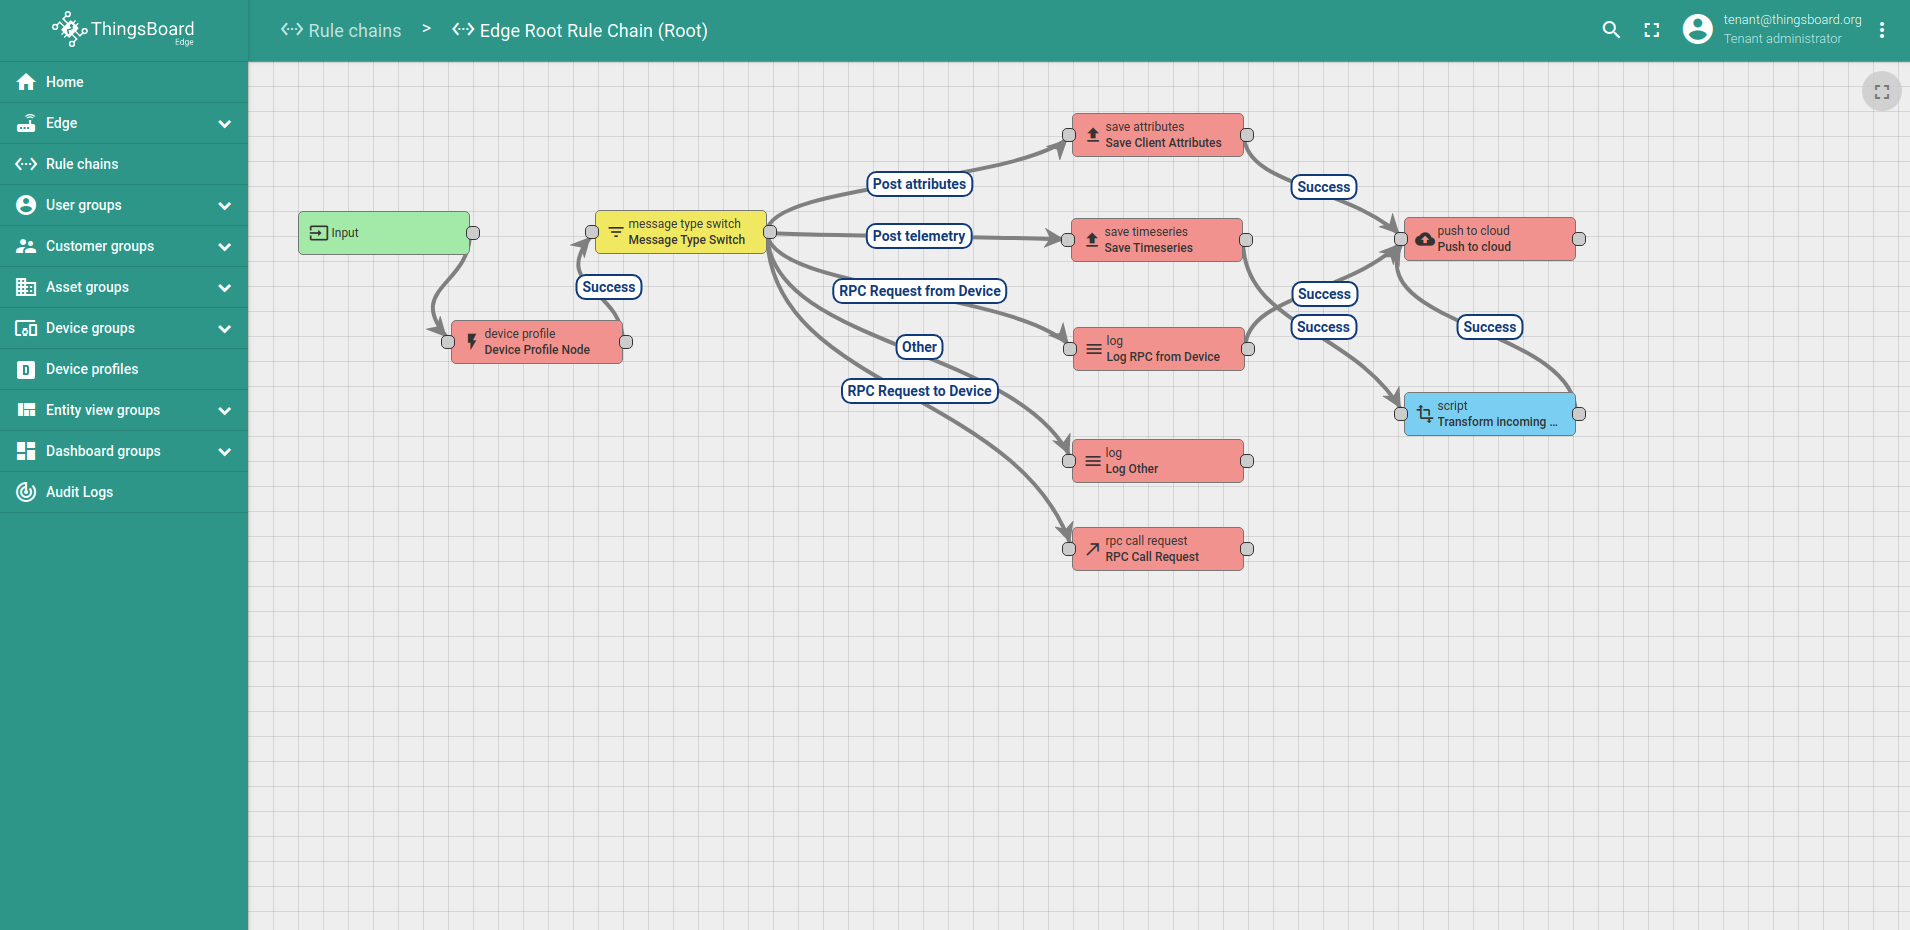
Now let’s open ThingsBoard Edge UI to see updated Root Rule Chain:
- Log in to your ThingsBoard Edge instance and navigate to the "Devices" page.
- Open the "Edge Root Rule Chain" to verify changes.
- You should see the same rule chain nodes configuration as on the cloud.
Connect device to edge and post telemetry
To connect “In-vehicle monitoring system” to the ThingsBoard Edge you need to get device credentials first. ThingsBoard supports different device credentials. We recommend to use default auto-generated credentials which is access token for this guide.
Please open ThingsBoard Edge UI using the URL: EDGE_URL.
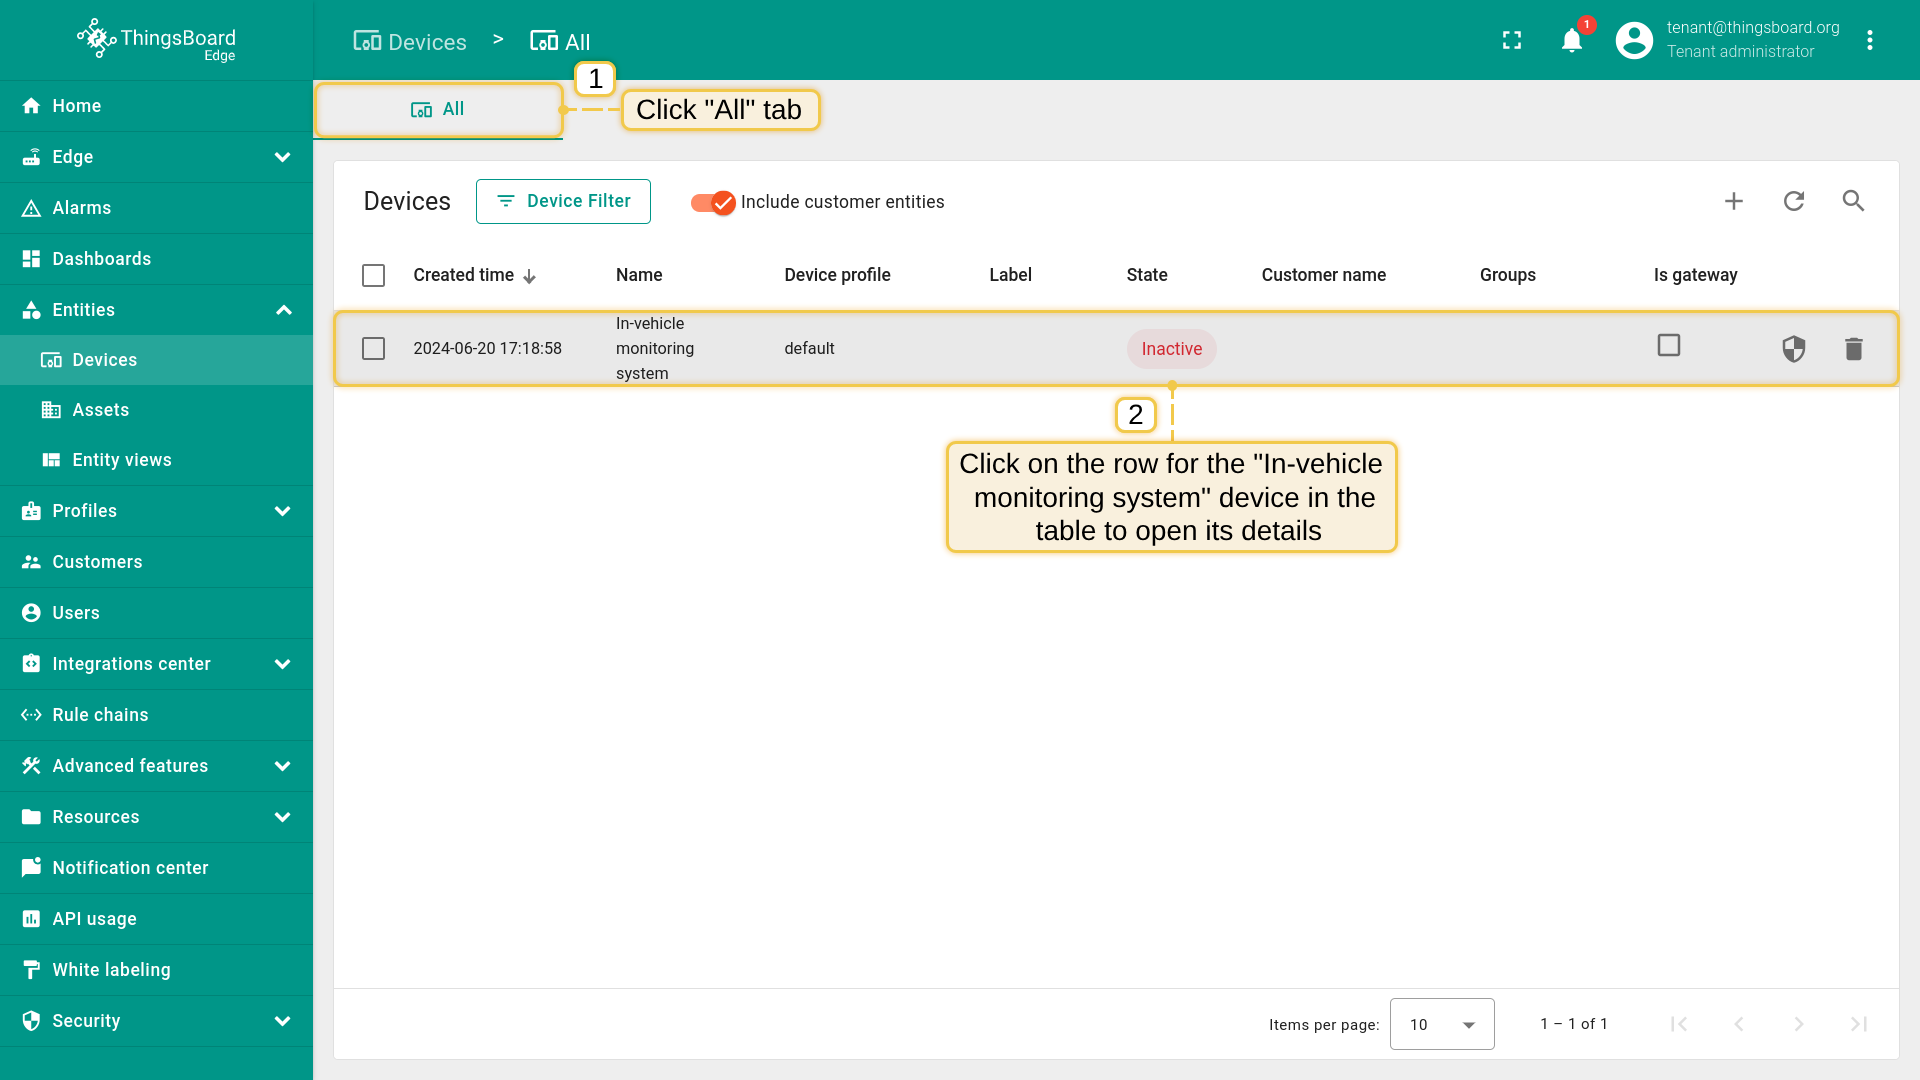
- Open the "Devices" page.
- Select the "All" tab, then click on the row that represents the "In-vehicle monitoring system" device in the table to open its details.
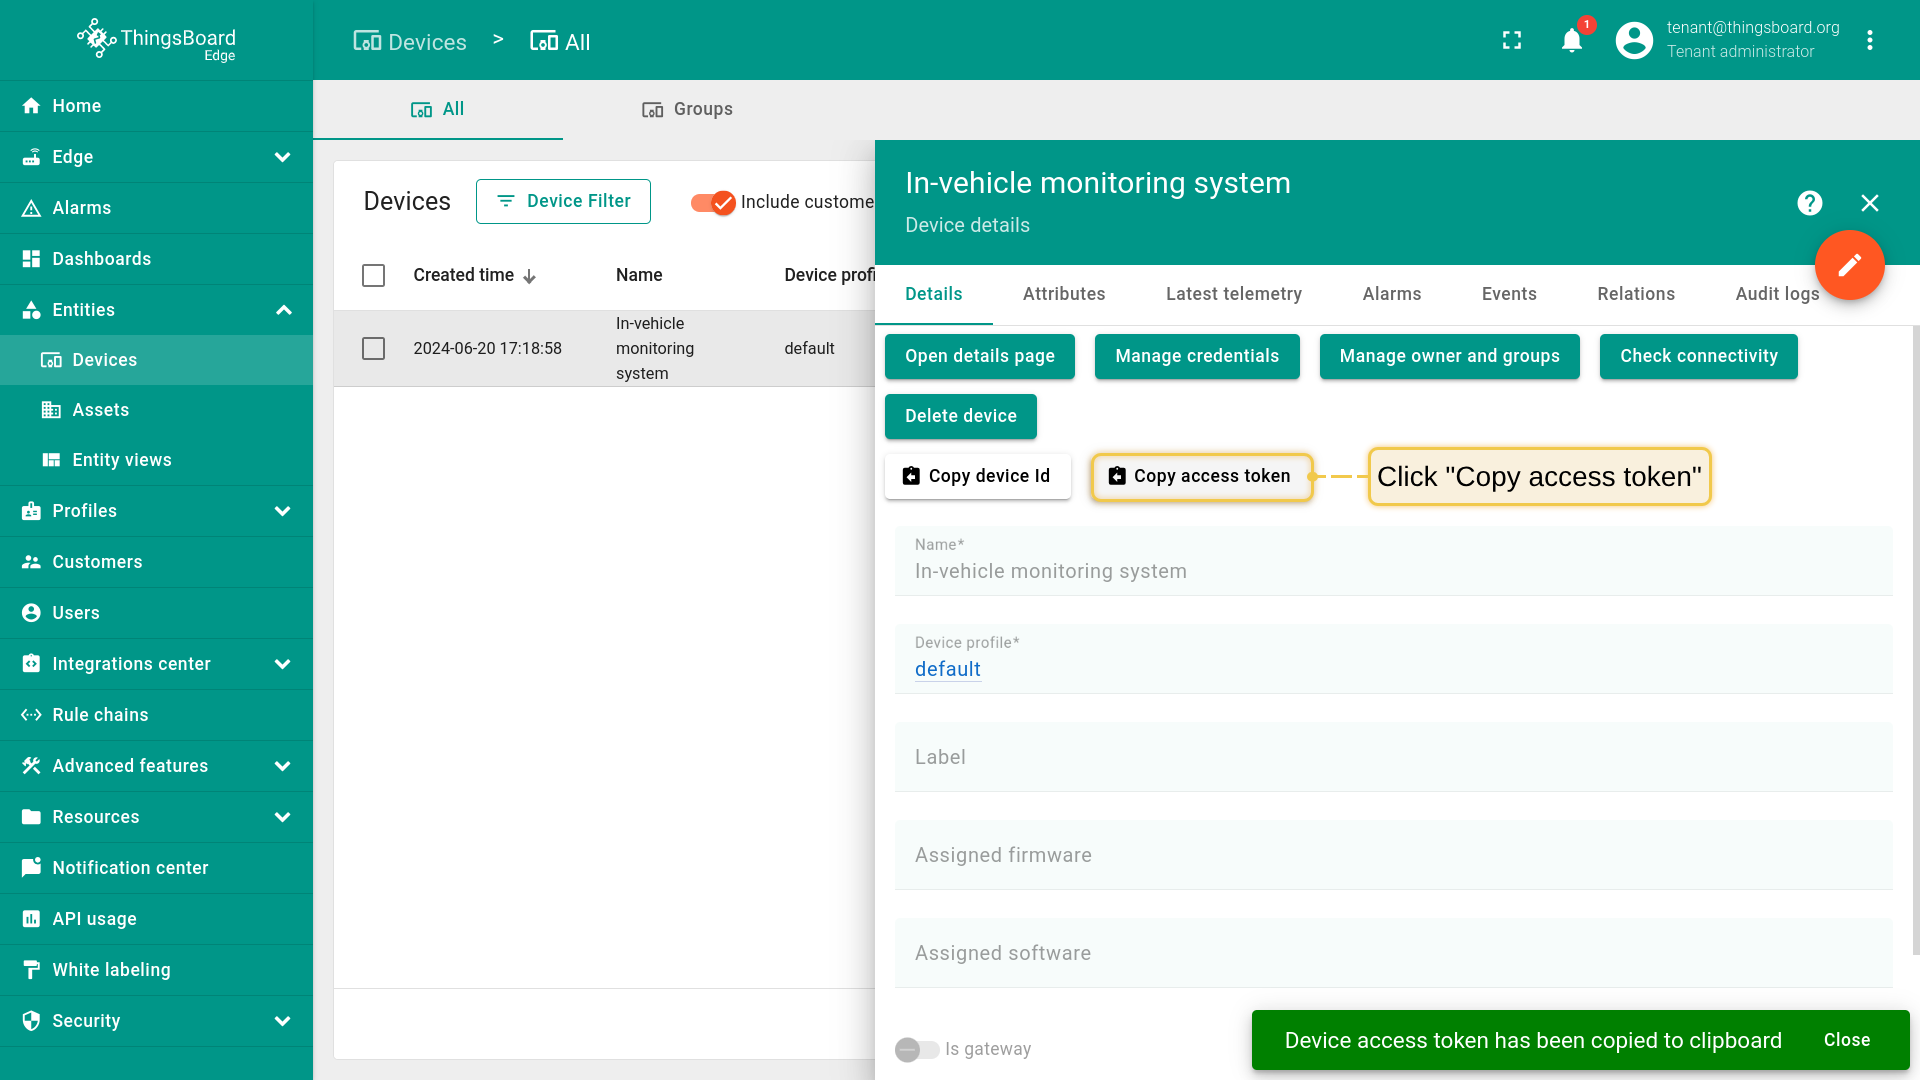
- Click on the "Copy access token" (token will be copied to your clipboard).
We will use simple commands to generate random telemetry for the device “In-vehicle monitoring system” and publish to the ThingsBoard Edge by the MQTT protocol.
Please download following script to your local folder:
Before running the scripts, please modify mqtt-generator.py as follows:
-
Replace YOUR_ACCESS_TOKEN with the access token of the “In-vehicle monitoring system” device copied from the previous steps.
-
Replace YOUR_TB_EDGE_HOST with your ThingsBoard Edge host address. For example, localhost.
-
Replace YOUR_TB_EDGE_MQTT_PORT with your ThingsBoard Edge MQTT port number. For example, 11883 or 1883.
Open the terminal and install the MQTT Python library using the following command:
1
sudo pip install paho-mqtt
Navigate to the directory containing your Python script and launch the application with the following command:
1
python mqtt-generator.py
Open the ThingsBoard Edge UI and verify that the device successfully receives telemetry:
- Open the "Devices" page in your ThingsBoard Edge instance.
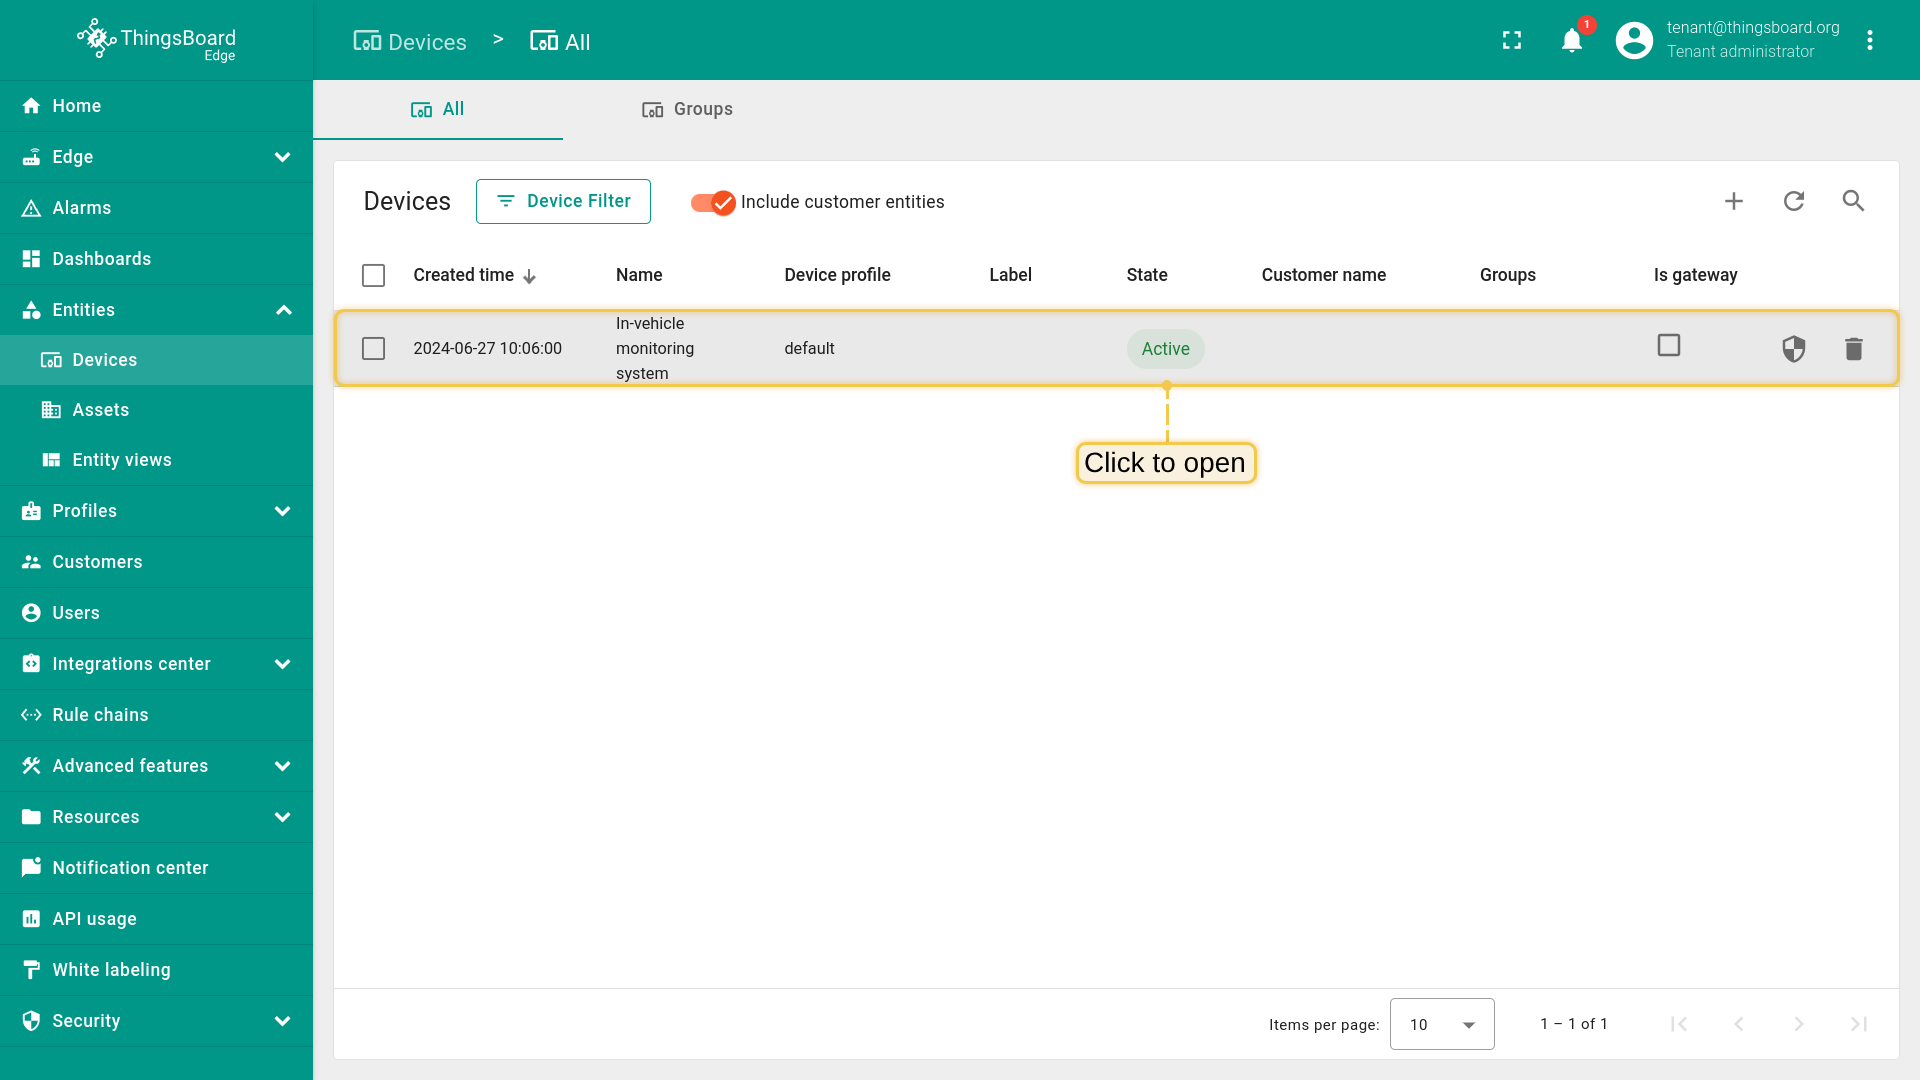
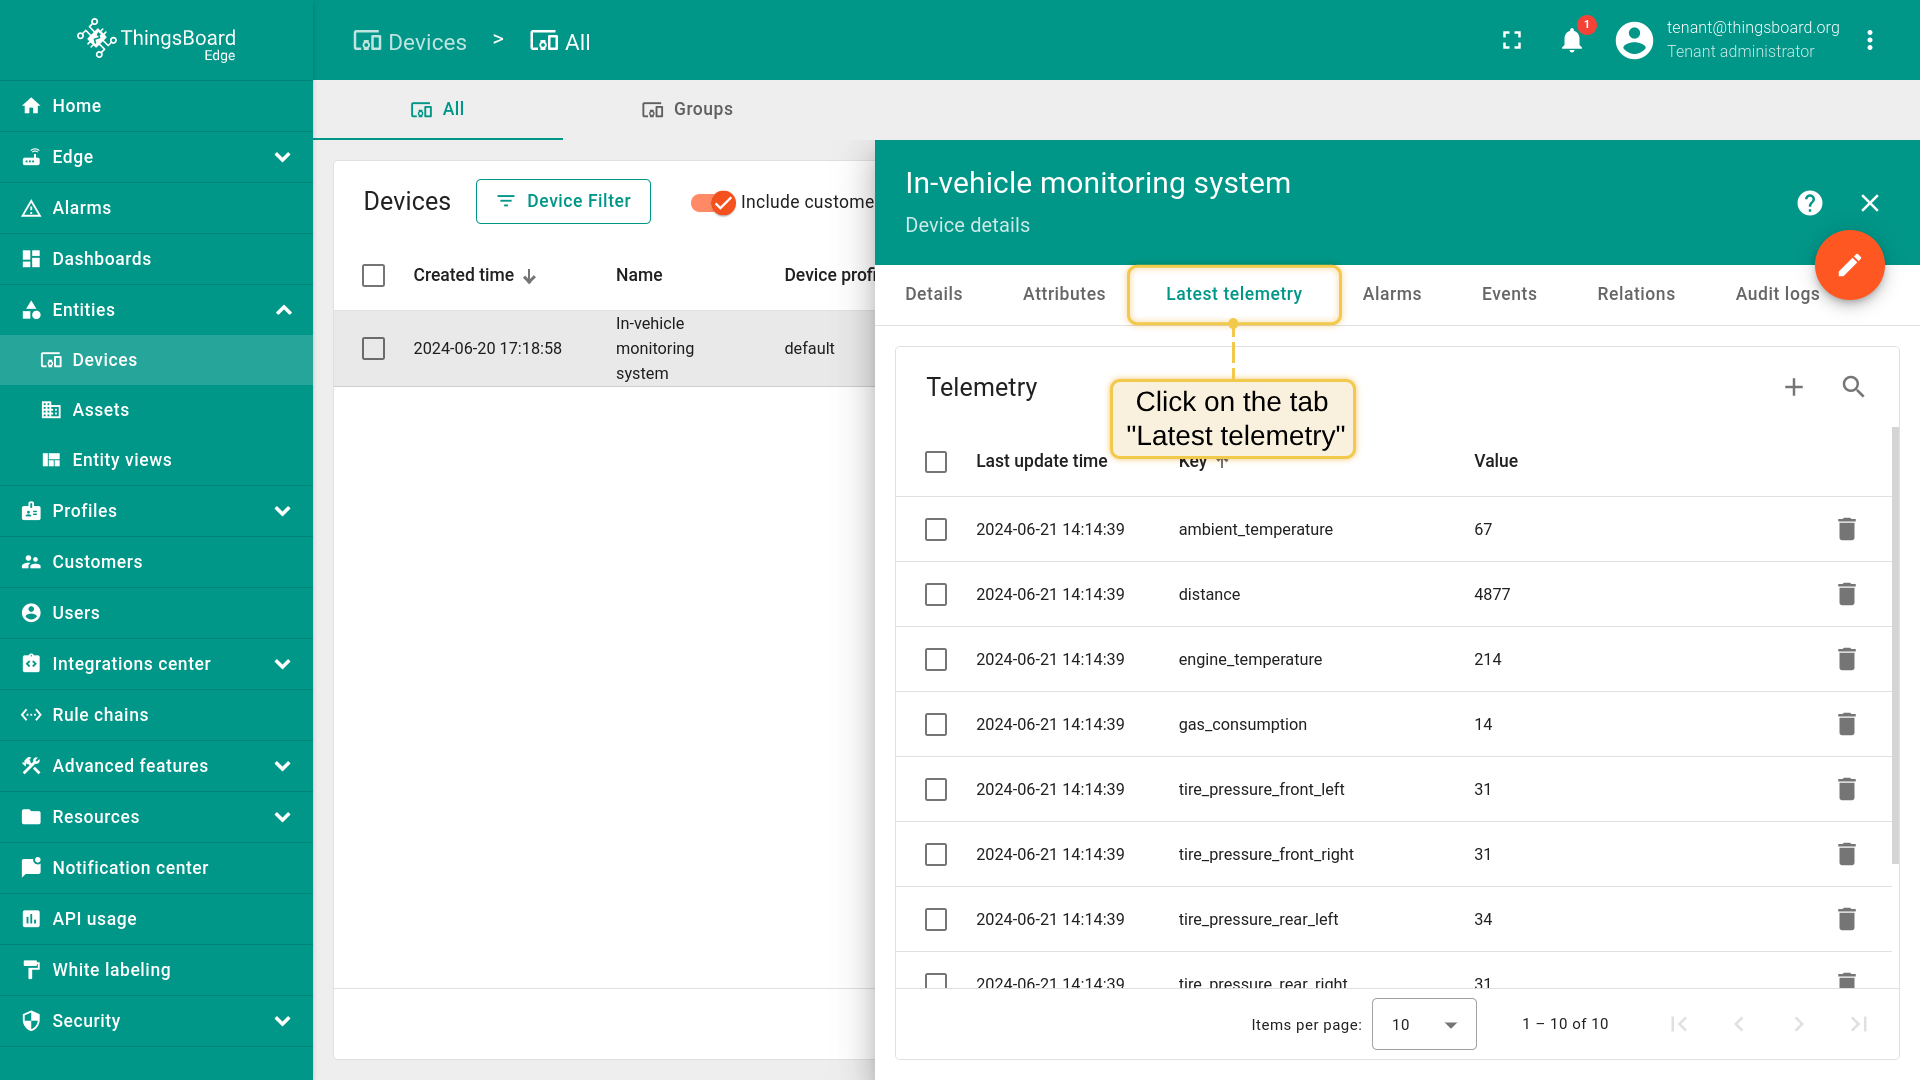
- Click on the row corresponding to the "In-vehicle monitoring system" device in the table to view its details.
- Switch to the "Latest telemetry" tab to monitor the telemetry data generated by the Python script in real-time
Open ThingsBoard UI and verify that edge successfully pushes data to the cloud:
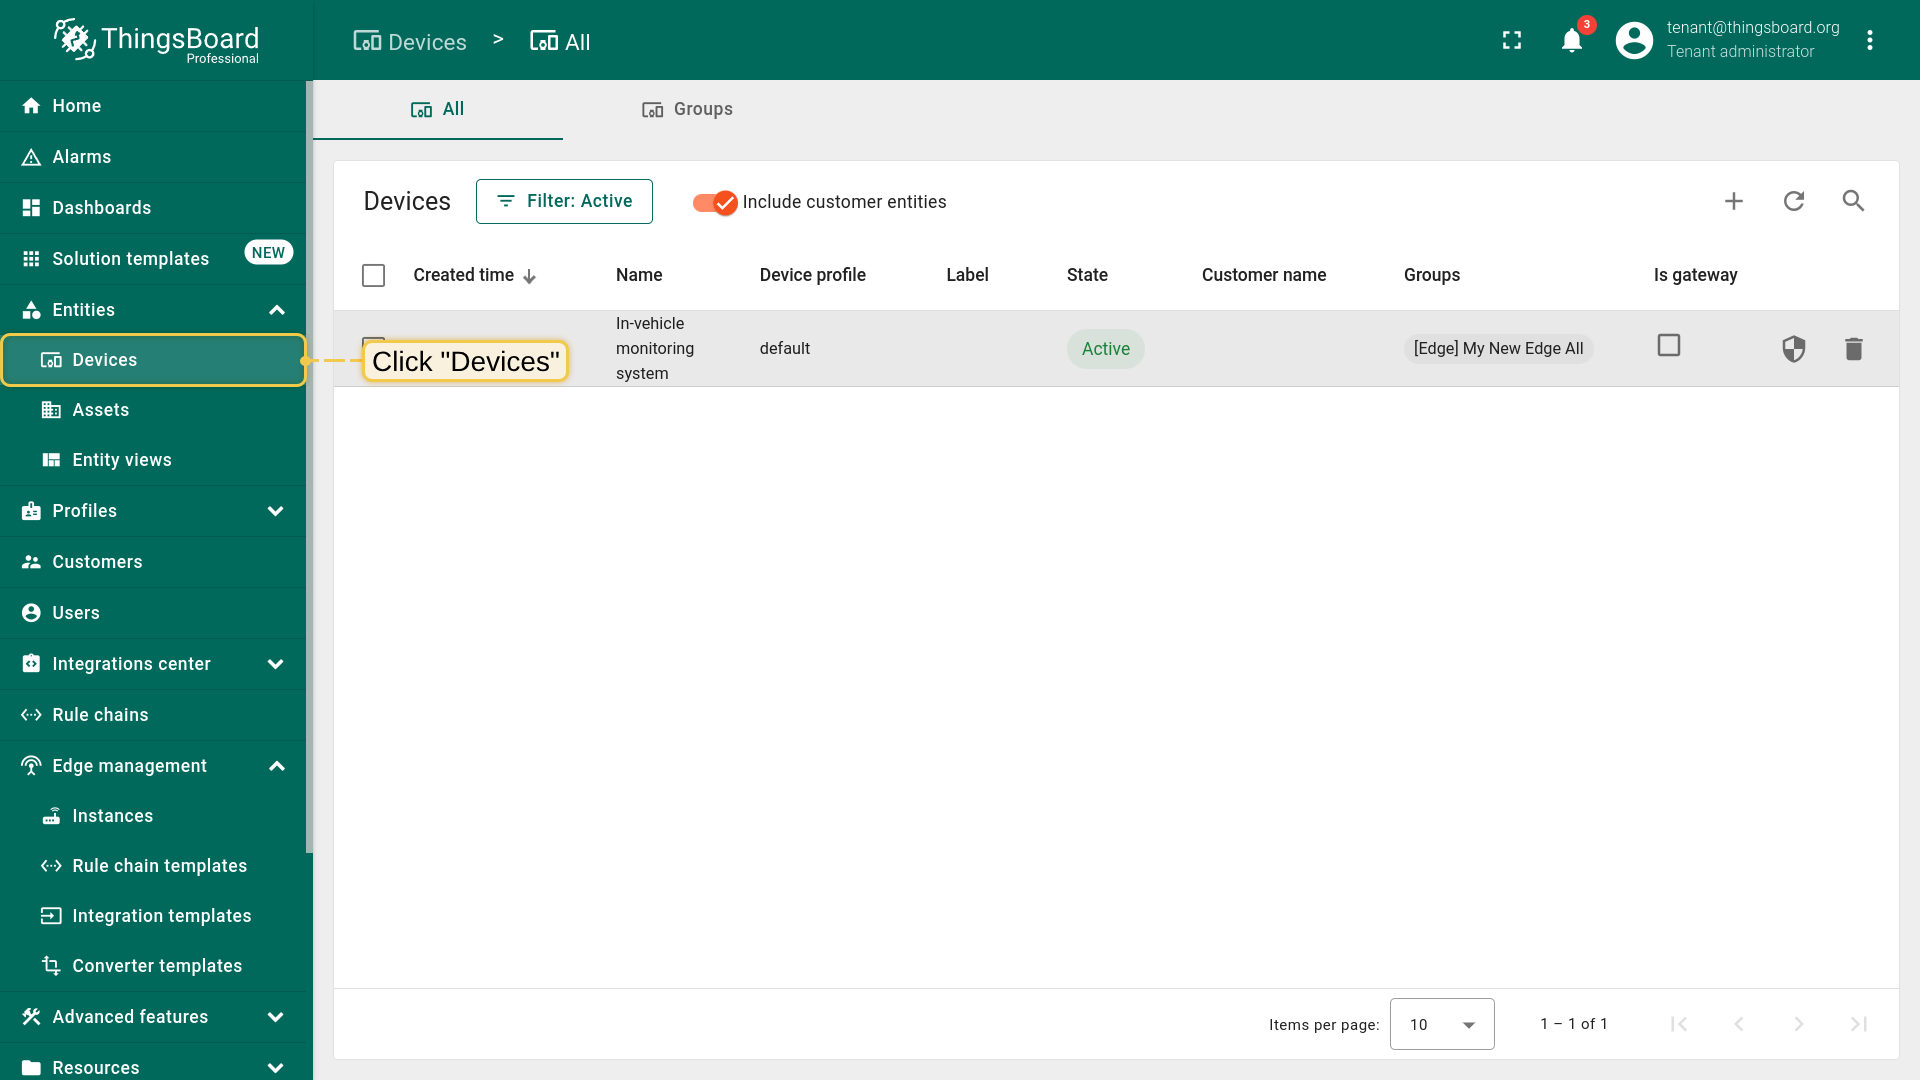
- Log in to your ThingsBoard PE instance. Then navigate to the "Devices" page.
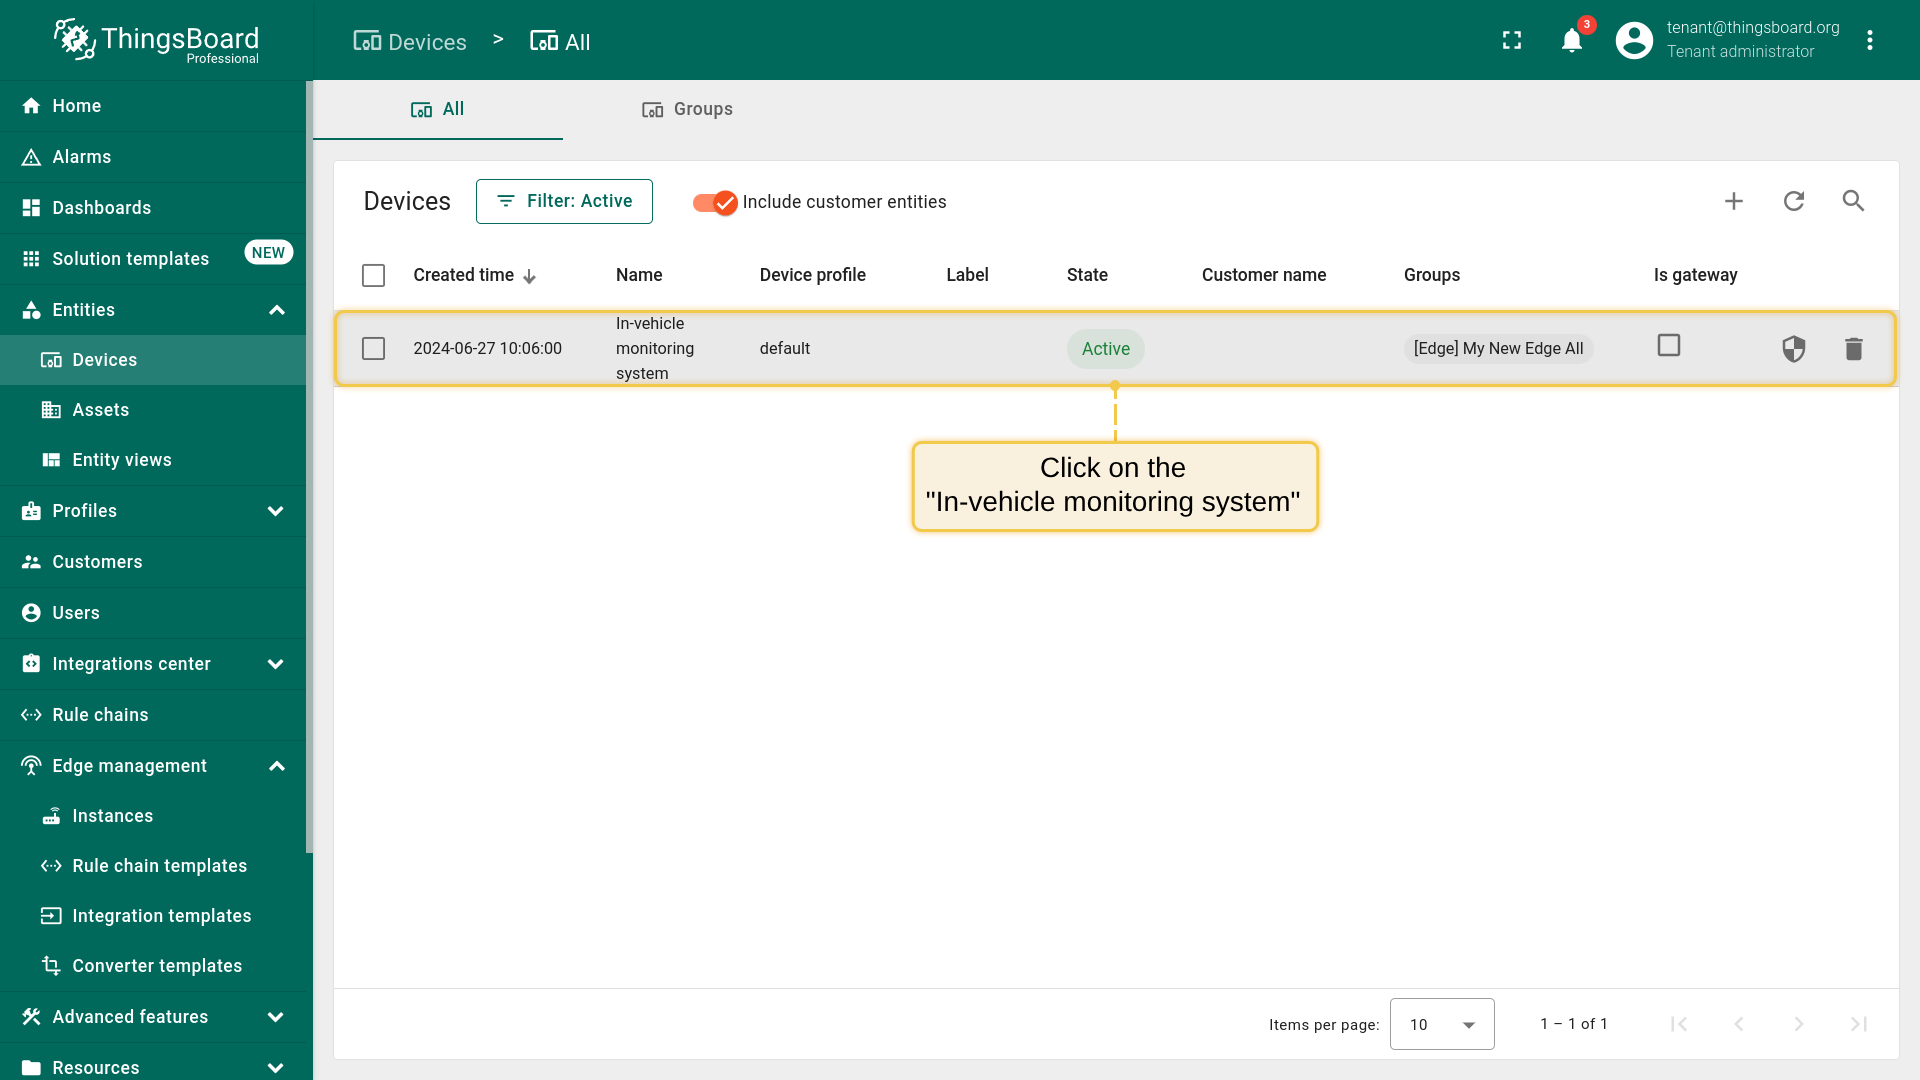
- Click on the "In-vehicle monitoring system" row to open the device details.
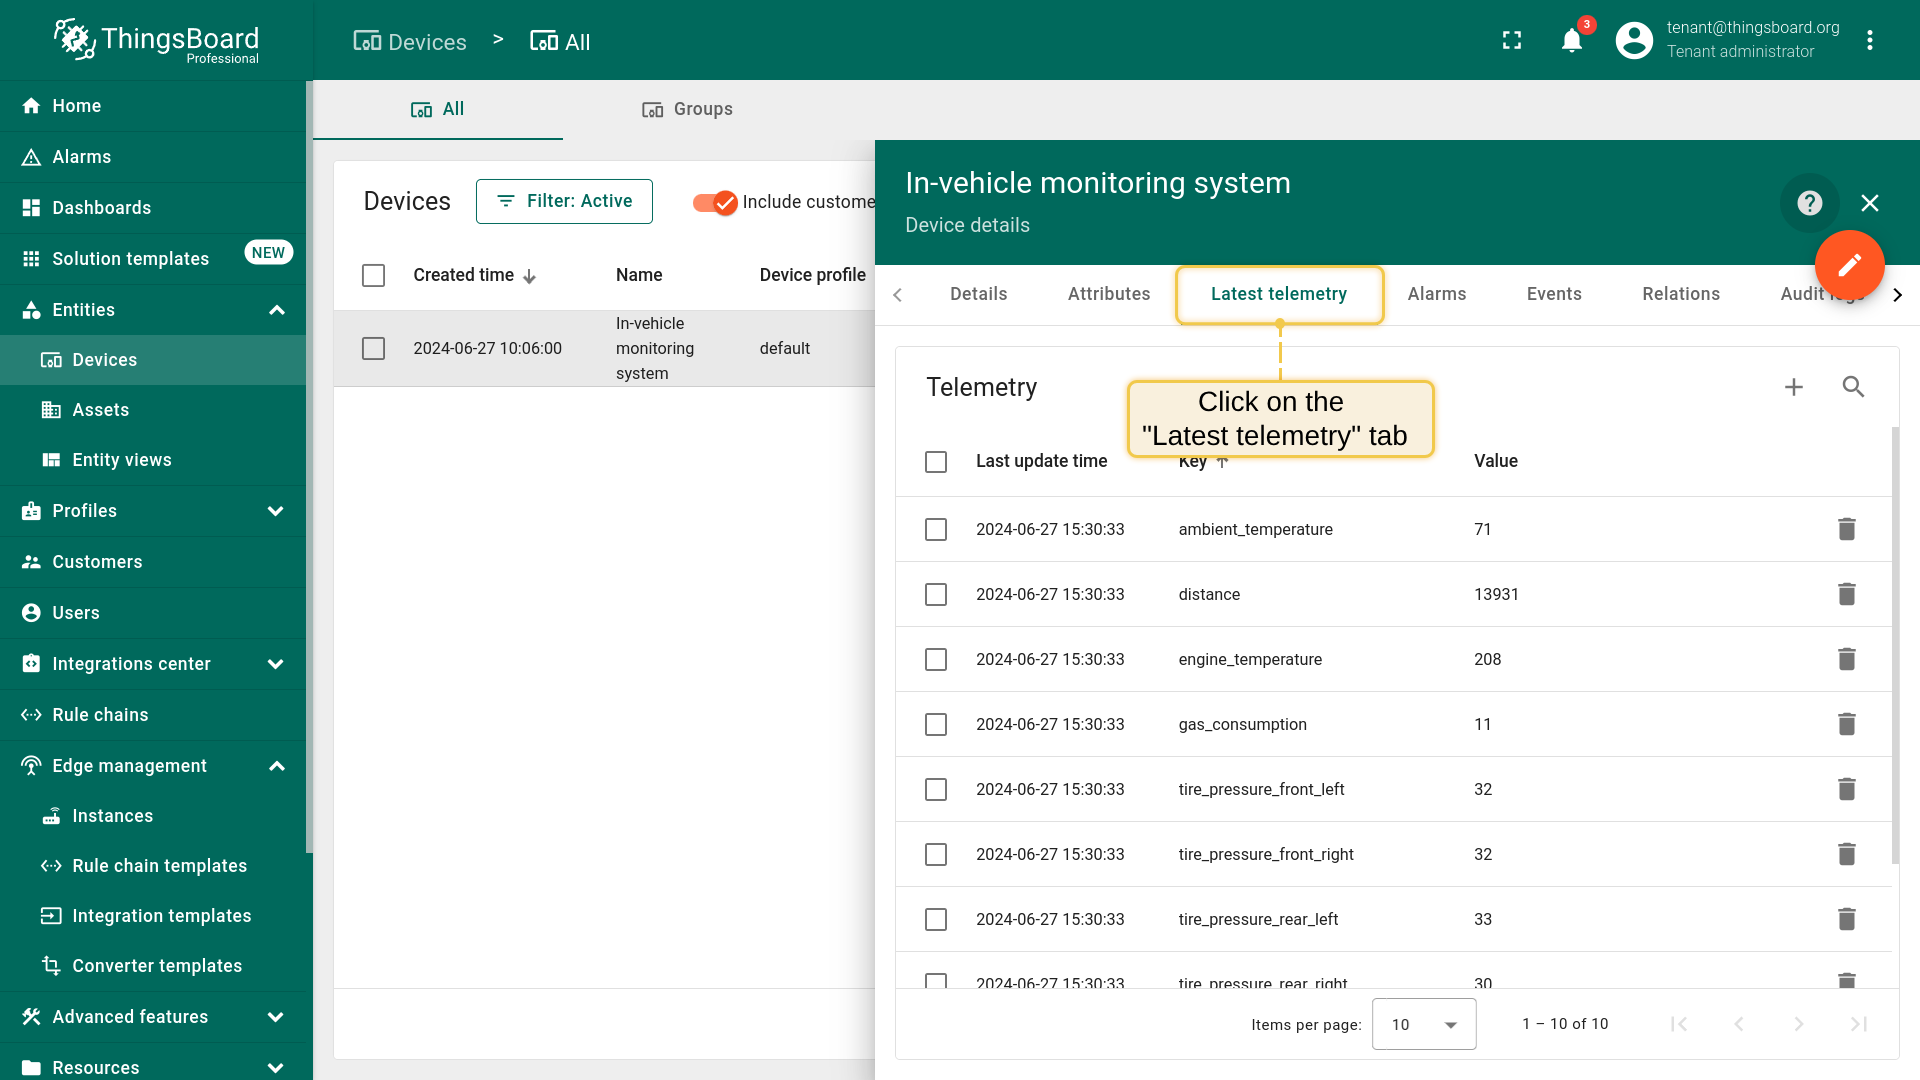
- Click on the "Latest telemetry" tab, to verify that "distance readings" are pushed successfully from the edge to the cloud.
Create dashboard
In the following steps, we will create a dashboard that displays both the total miles traveled and the remaining miles until the next oil change for the vehicle.
Please open ThingsBoard to create a new dashboard:
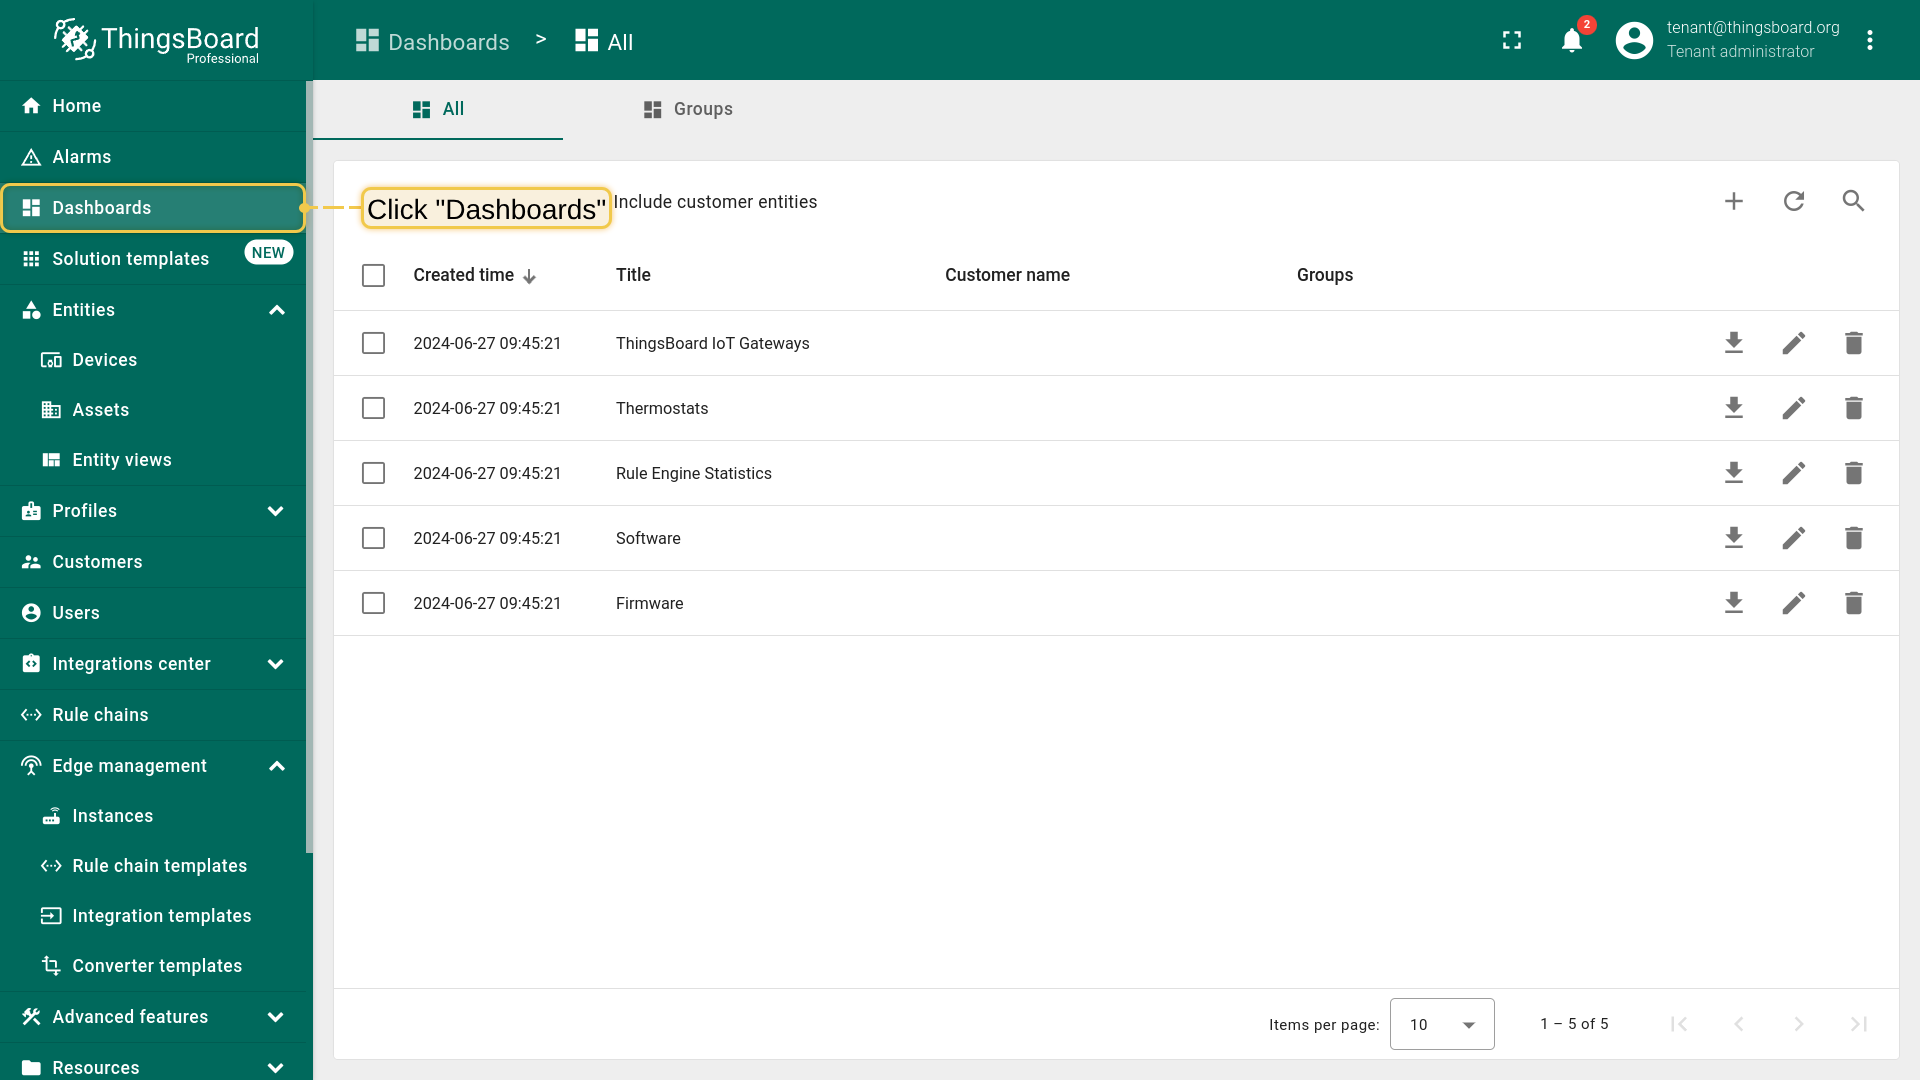
- Log in to your ThingsBoard PE instance. Navigate to "Dashboards" page.
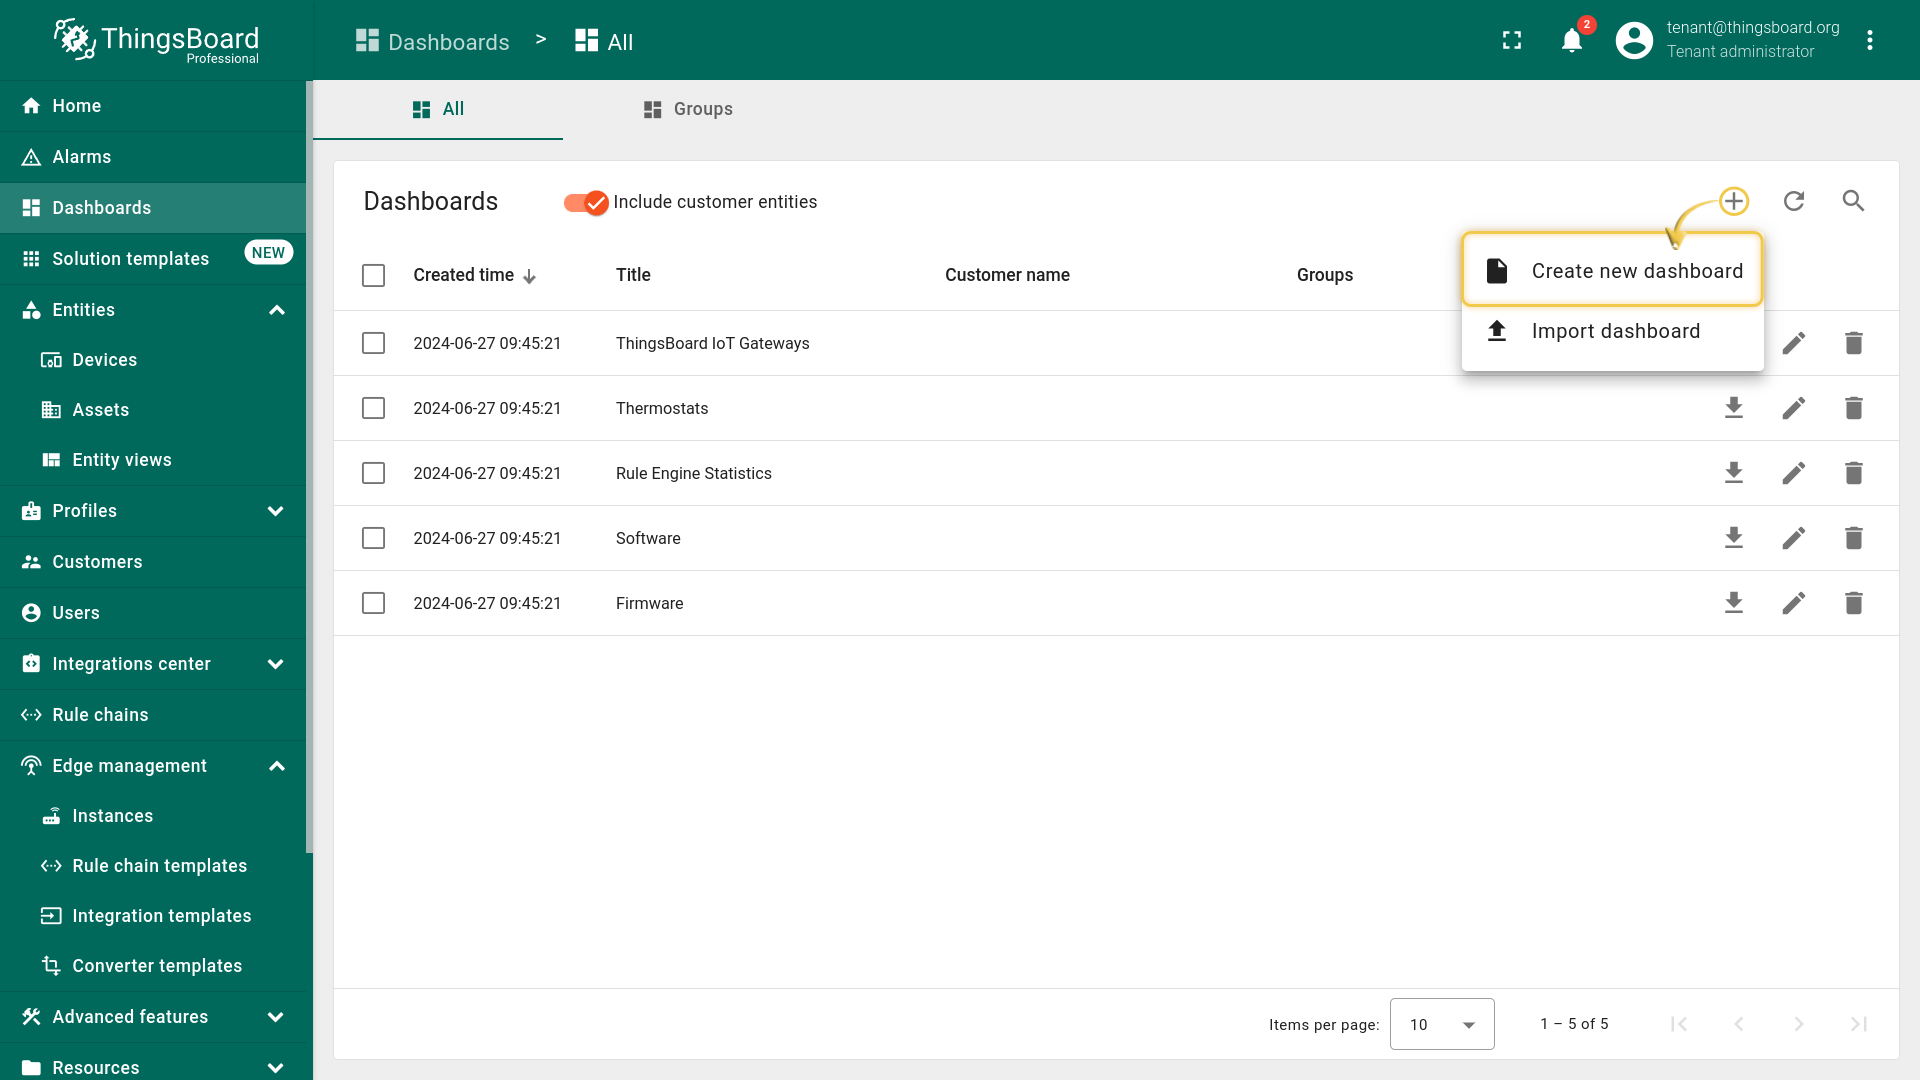
- Click on the ("+") icon, then select "Create new dashboard"
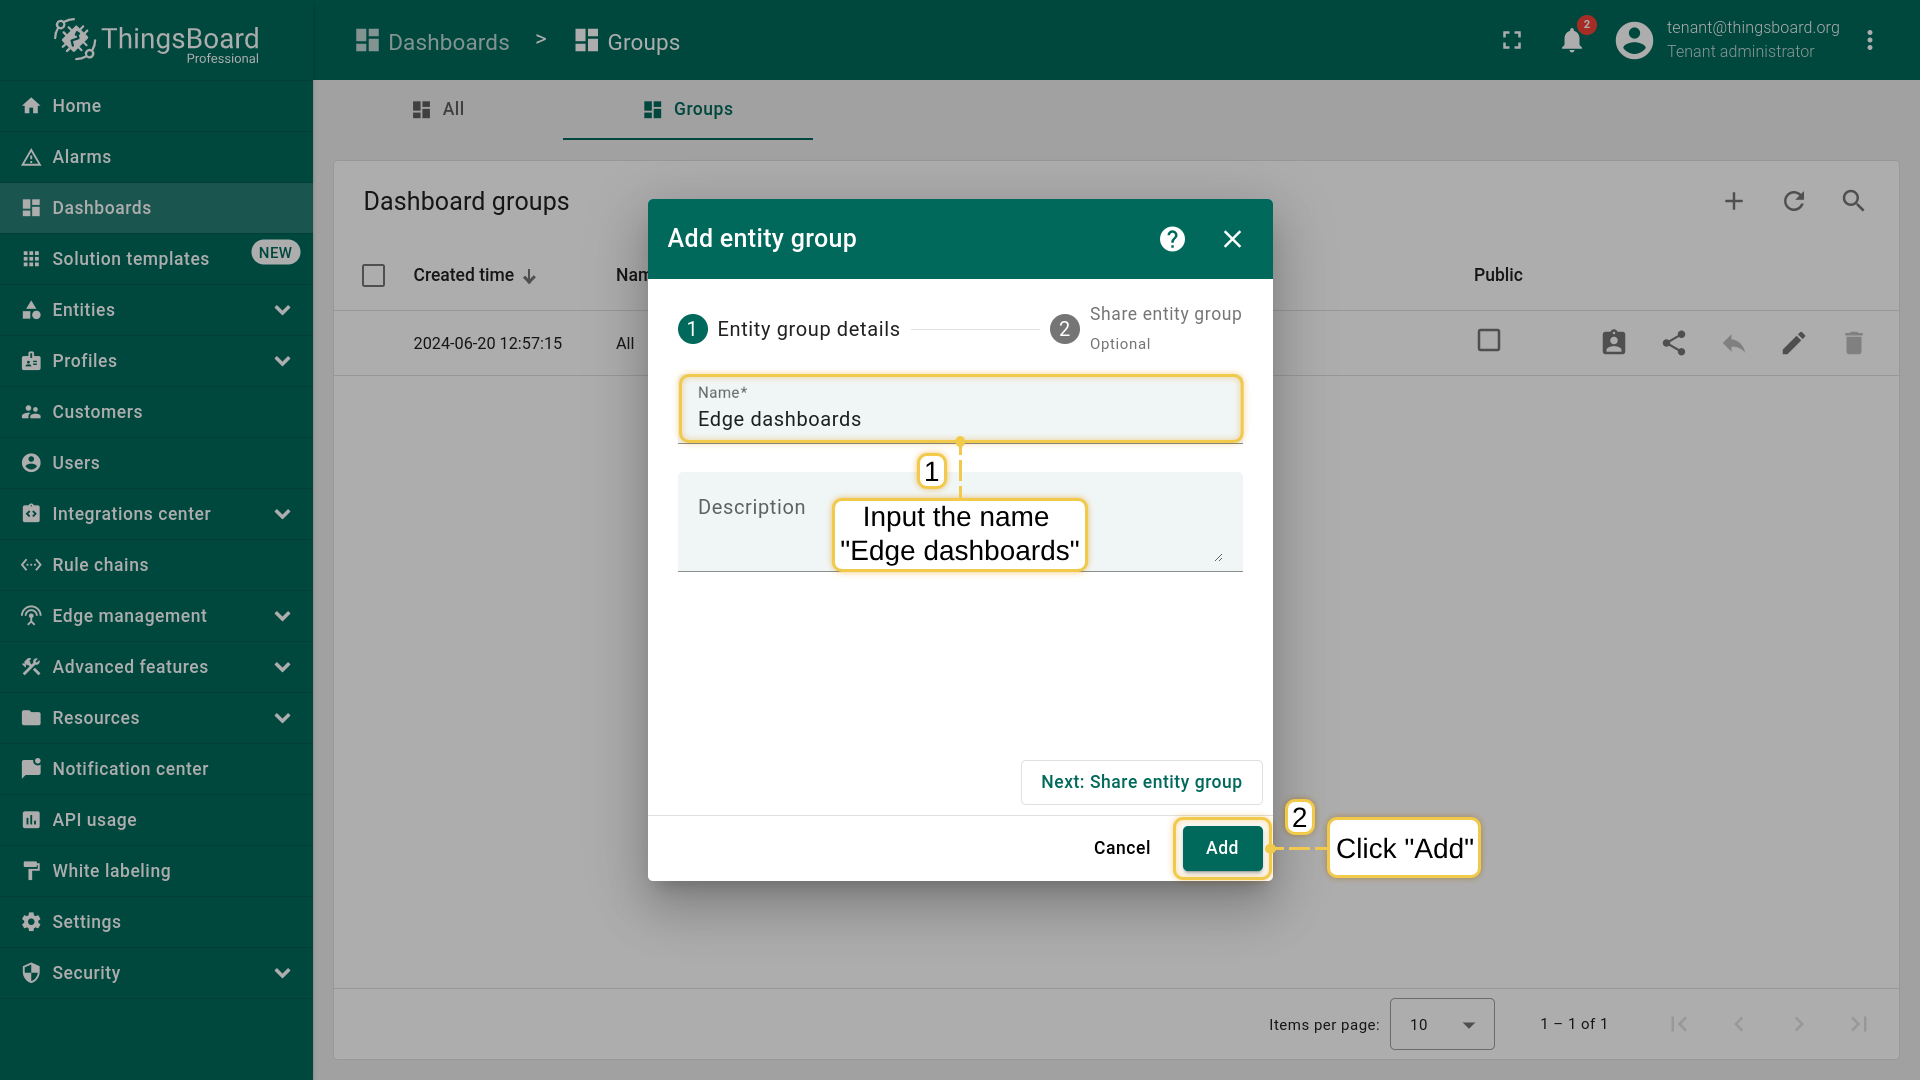
- Input the Name for the new dashboard, e.g., "Edge dashboards", then click the "Add" button.
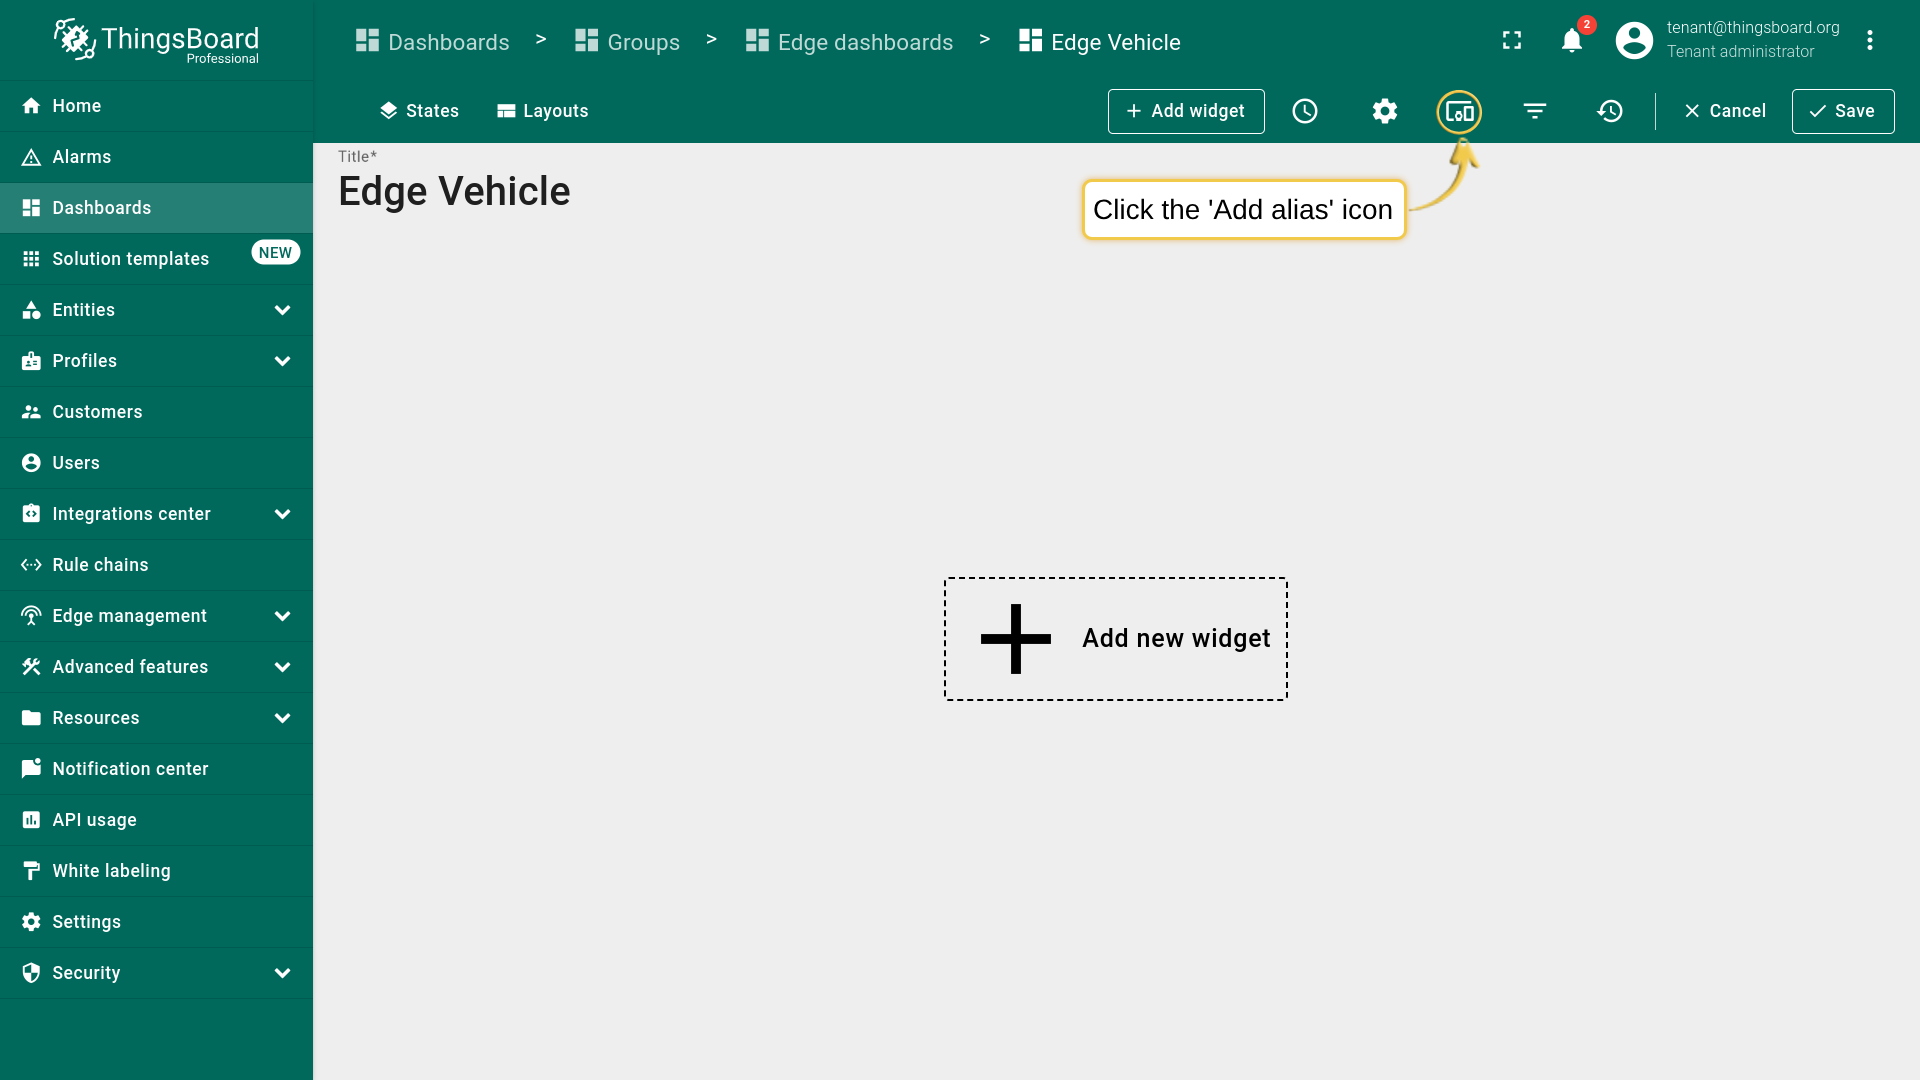
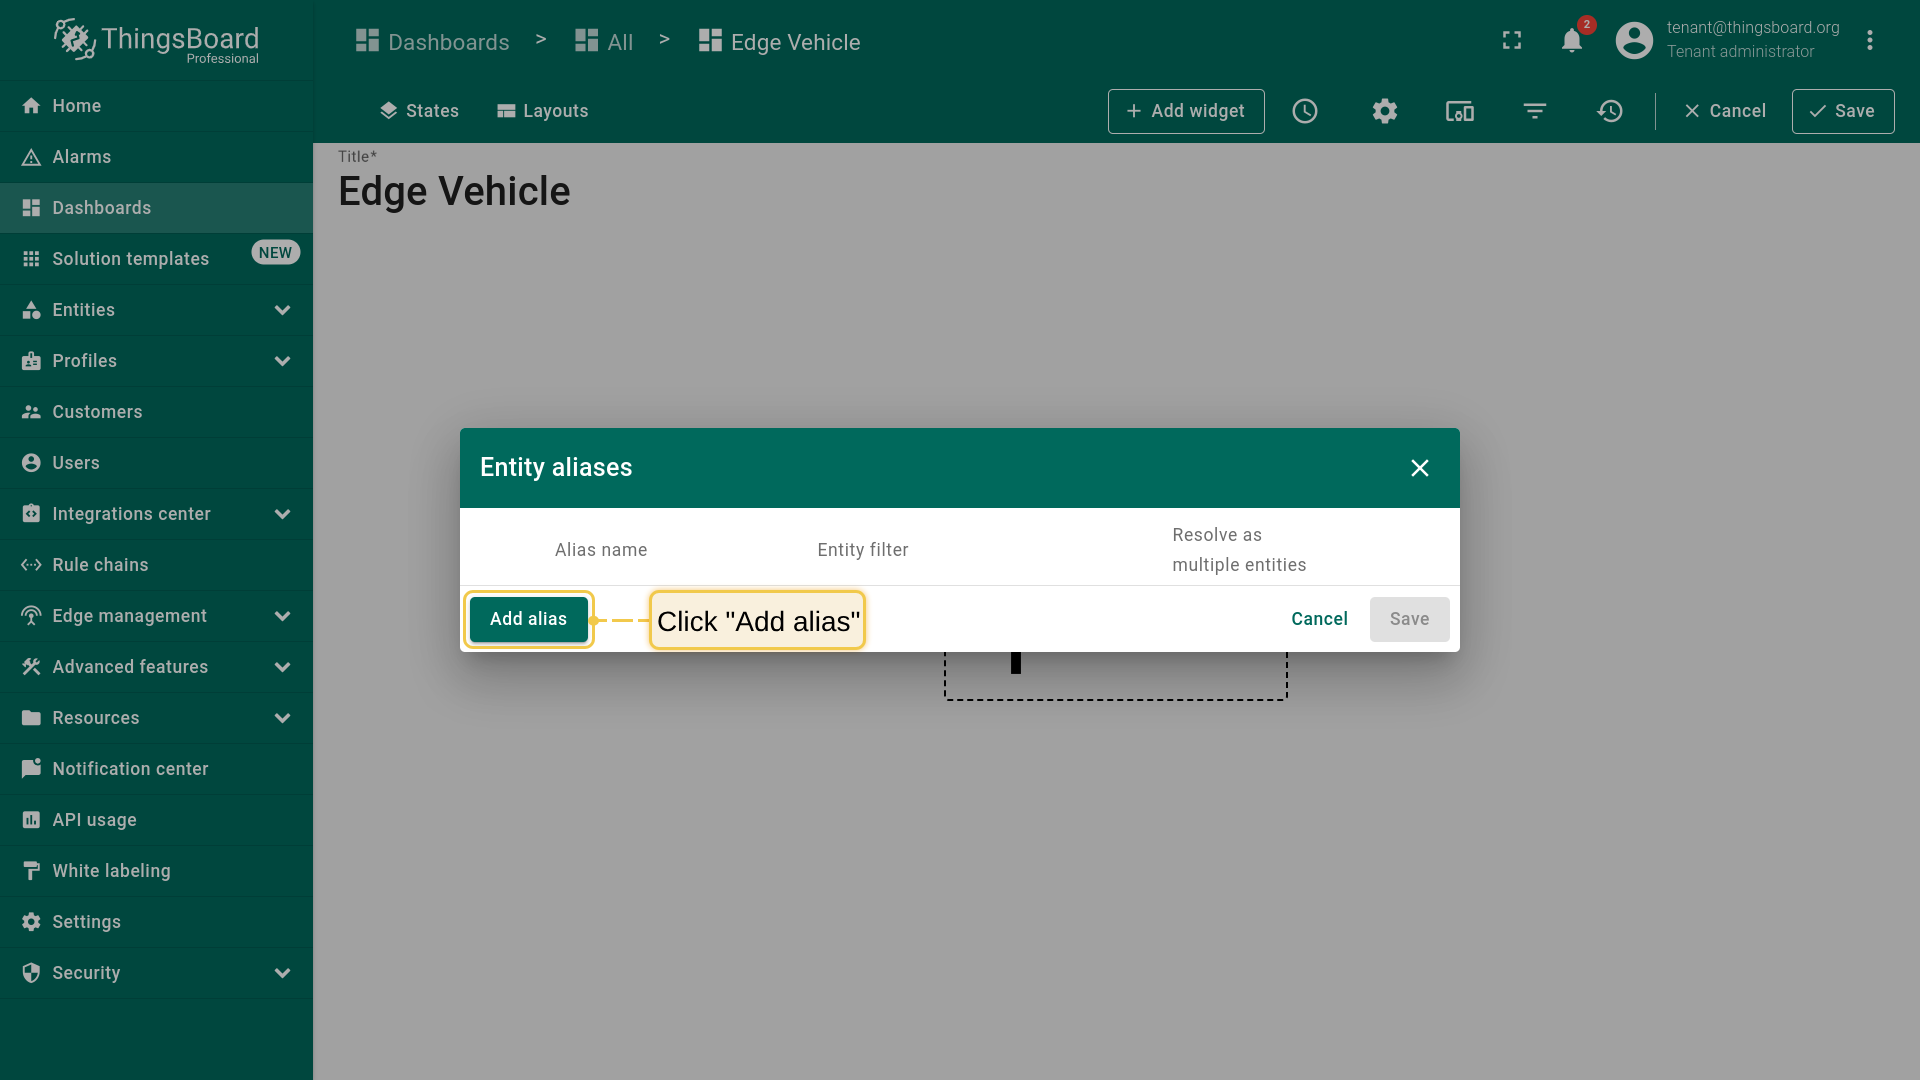
- Click on the "Add alias" icon.
- Click on the "Add alias" button.
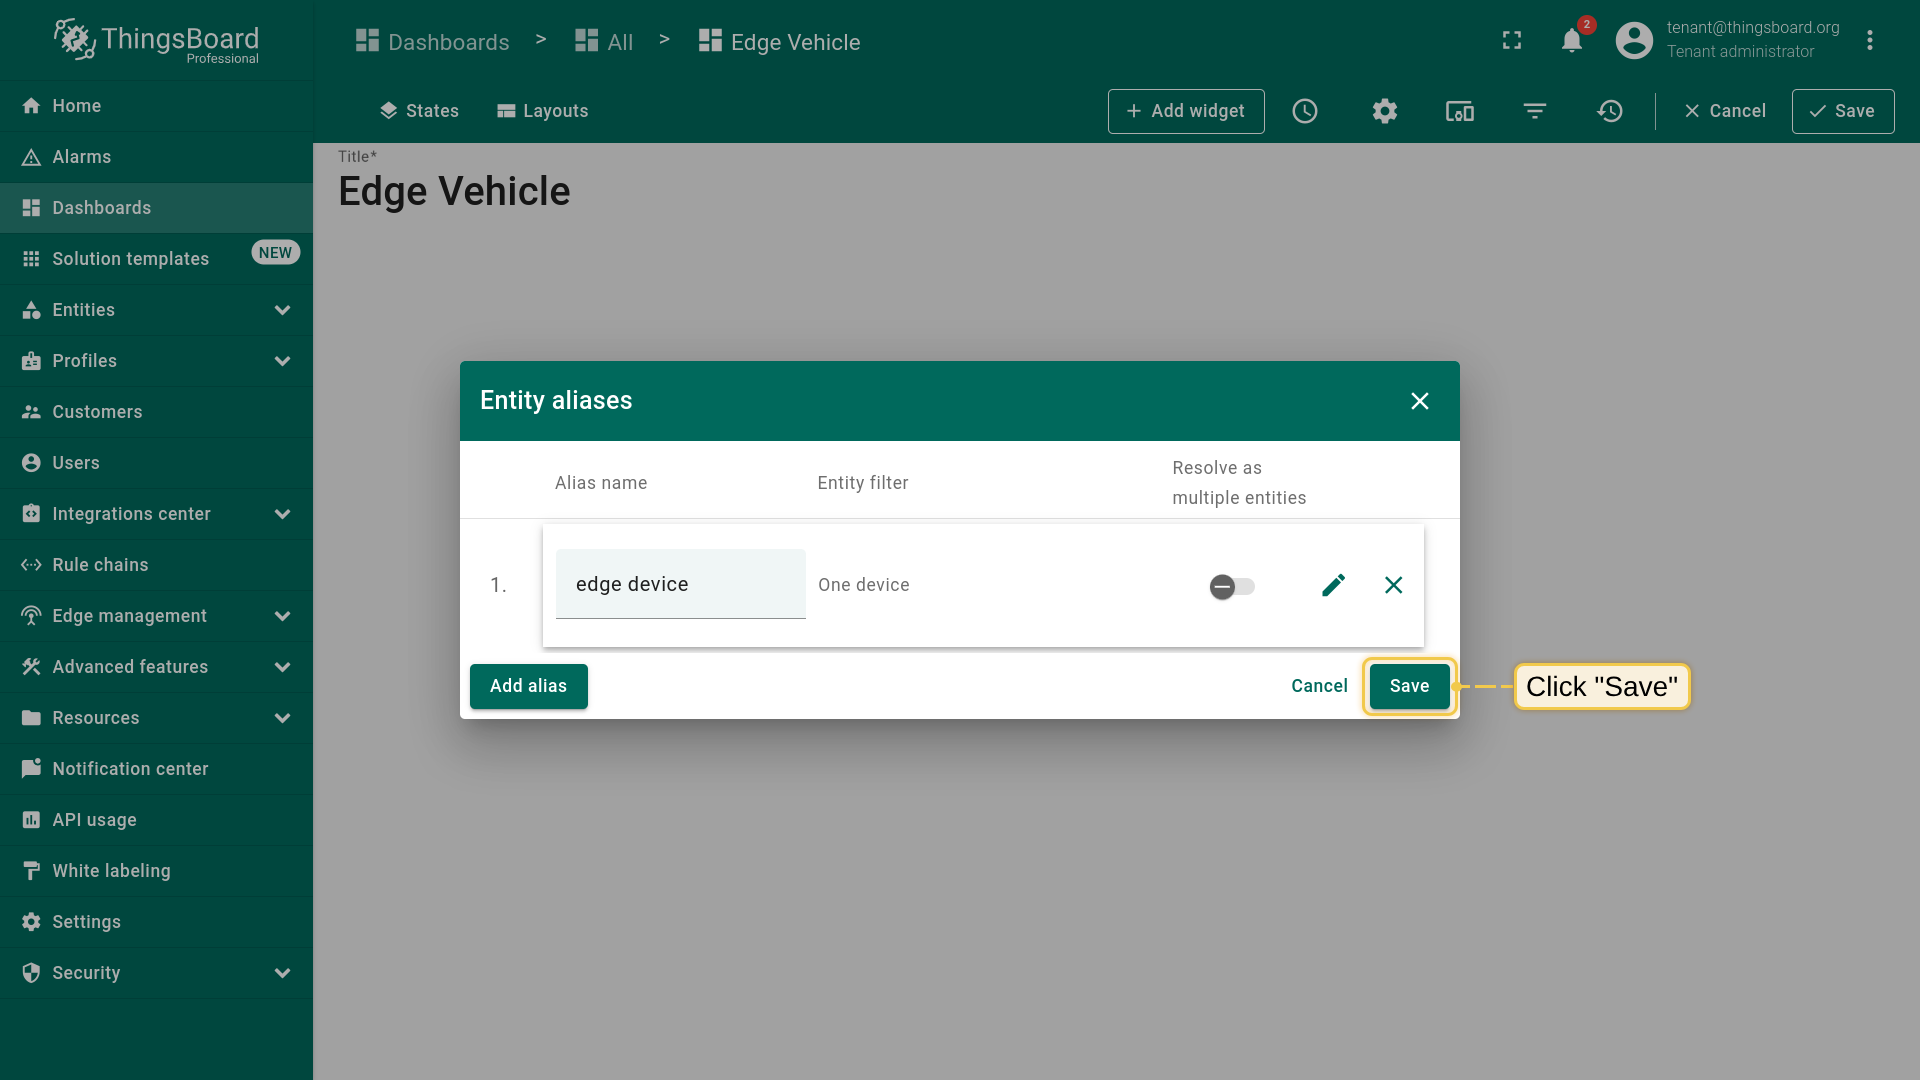
- Input Alias name "edge device". Select Filter type "Single entity", type "Device", and Device "In-vehicle monitoring system". Then click on the "Add" button.
- Click on the "Save" button.
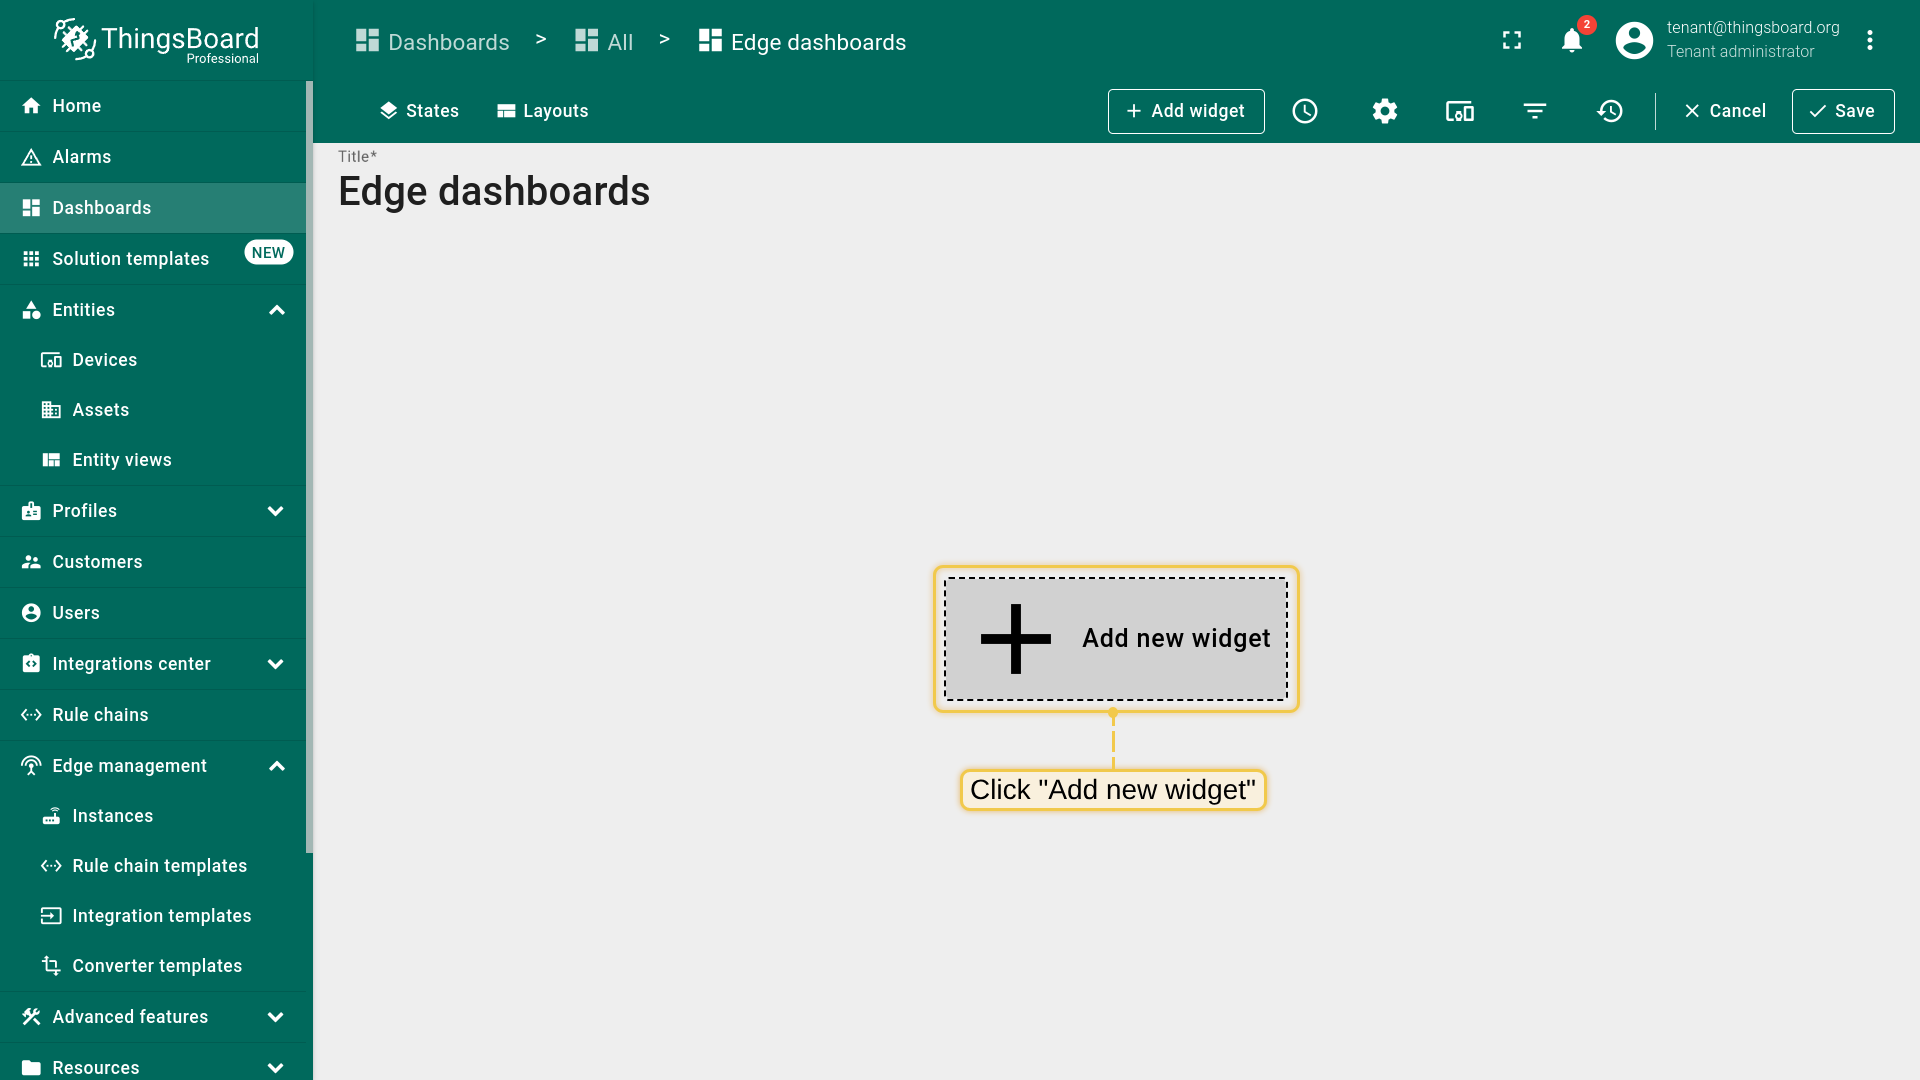
- Click on the "Add new widget".
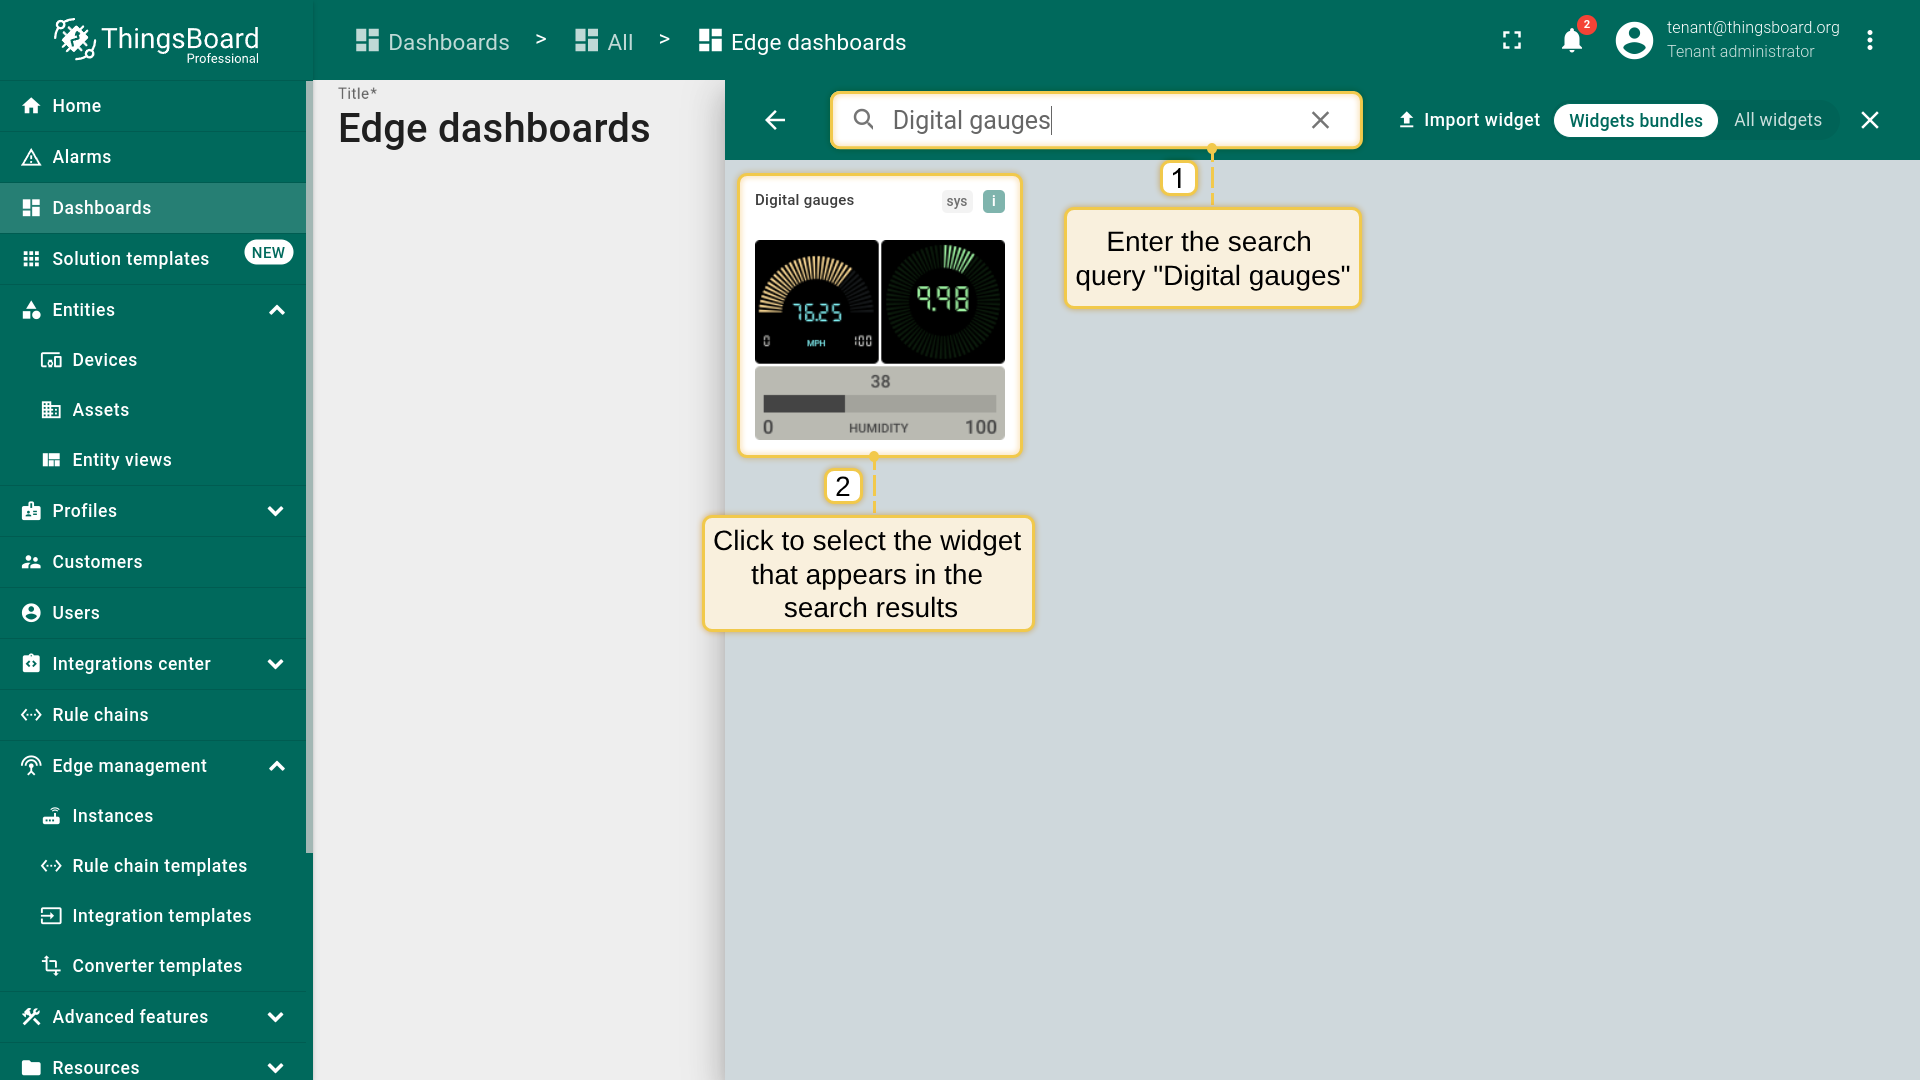
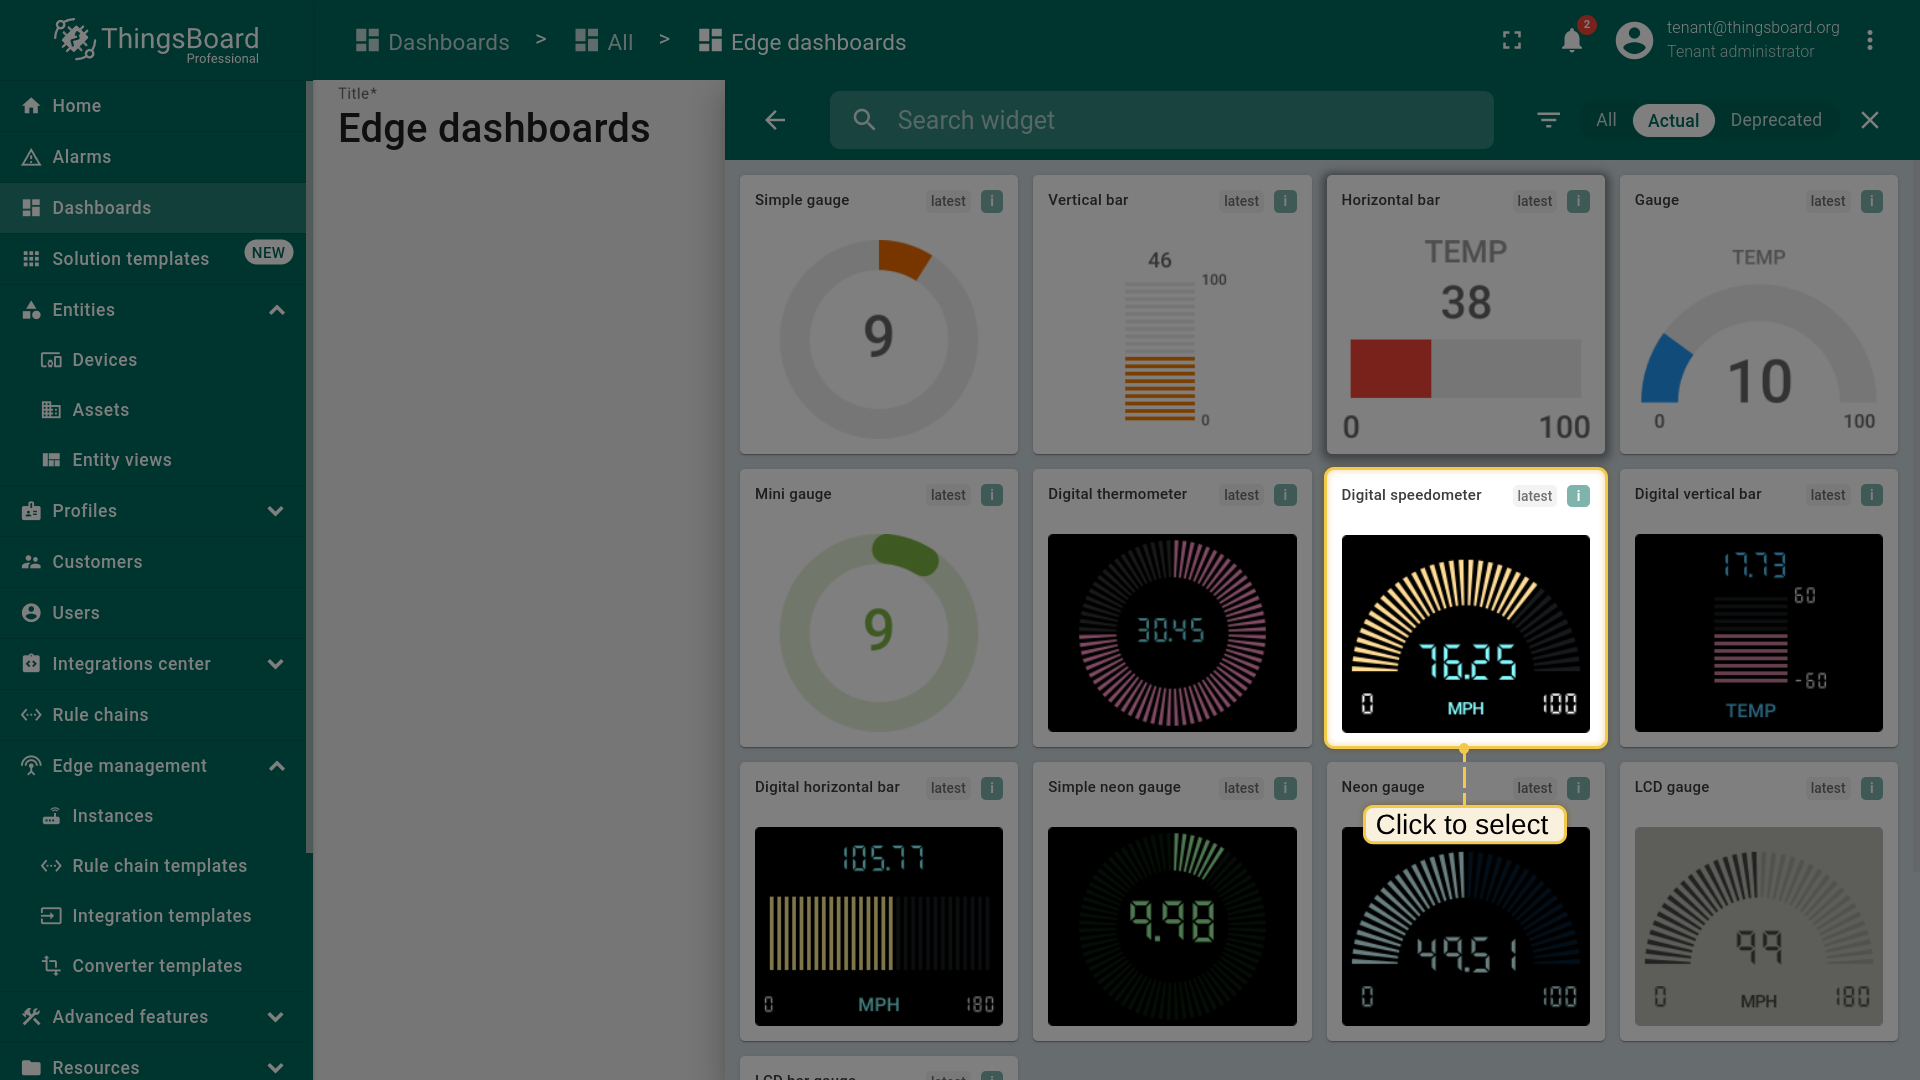
- Enter the search query "Digital gauges", then click to select the widget from the search results.
- Click on the widget shown in the screenshot, or choose another one according to your preference.
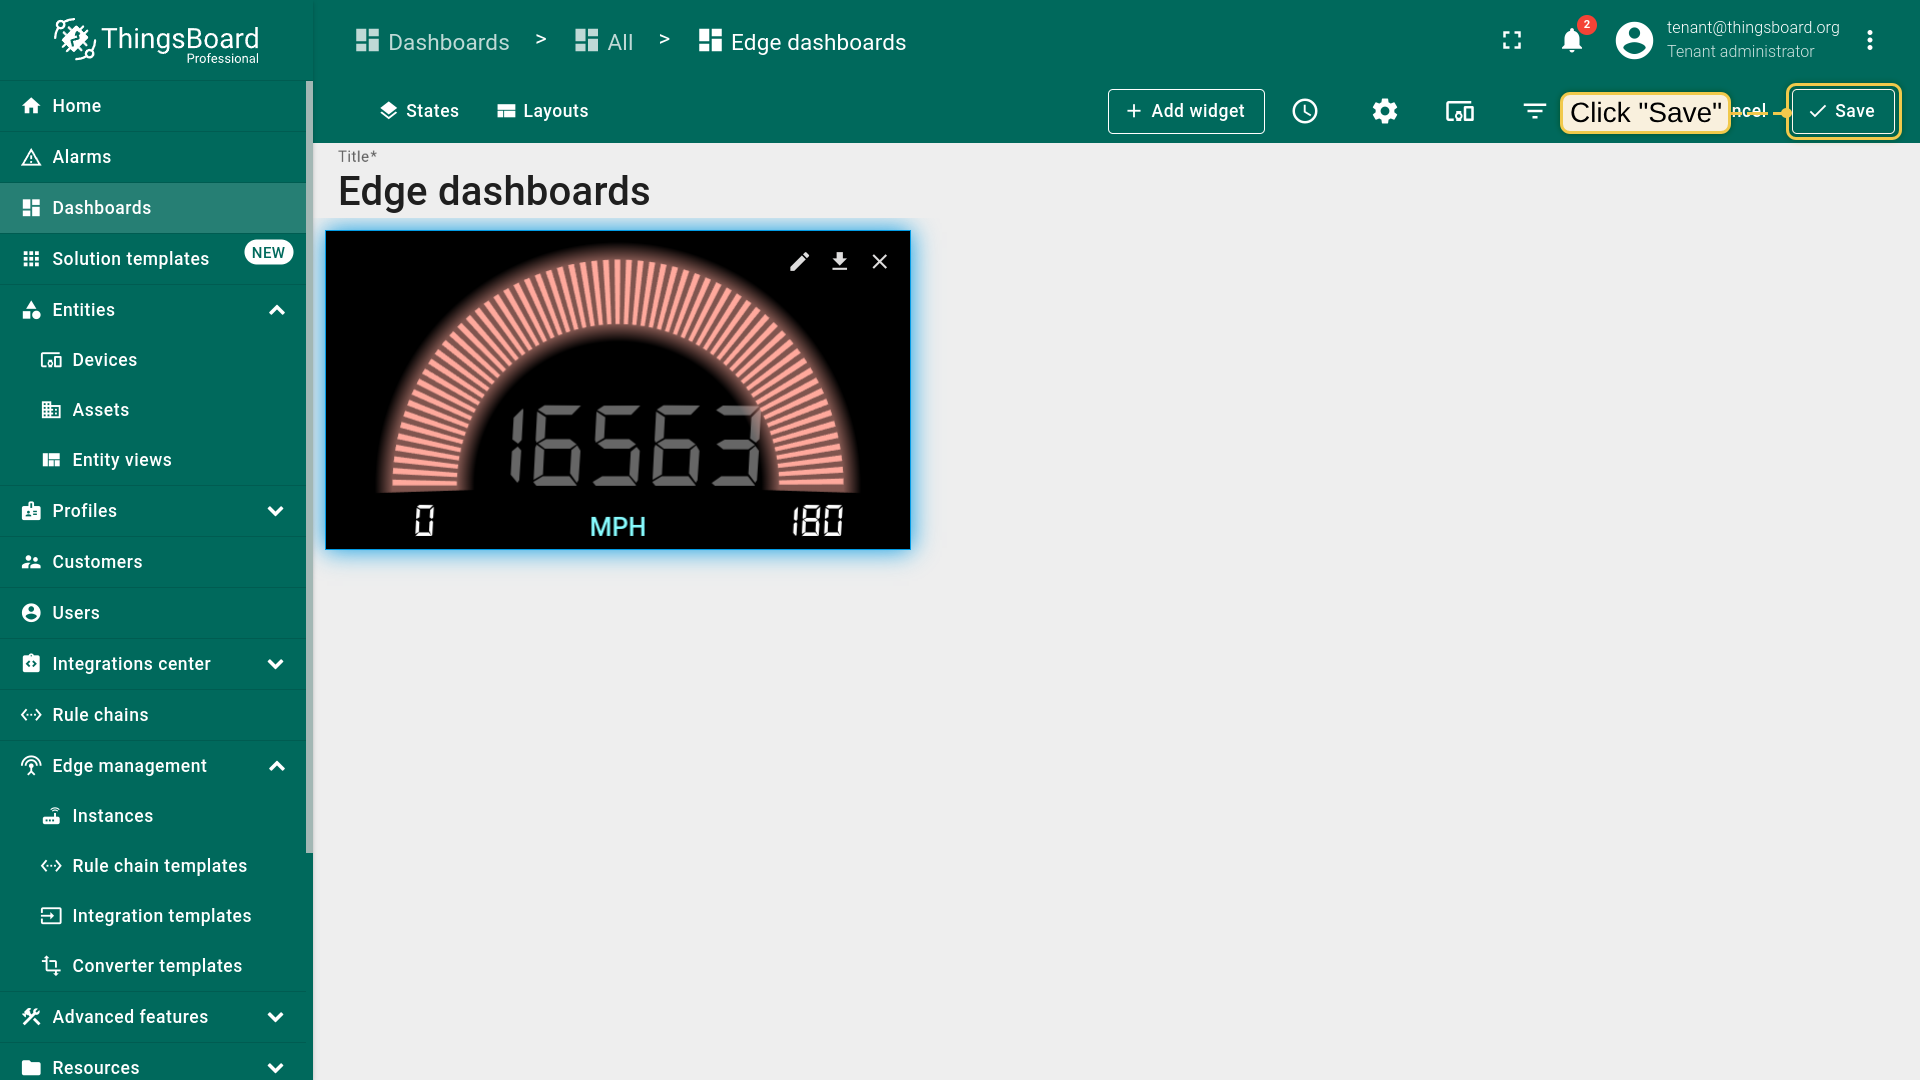
- Click on the "Save button".
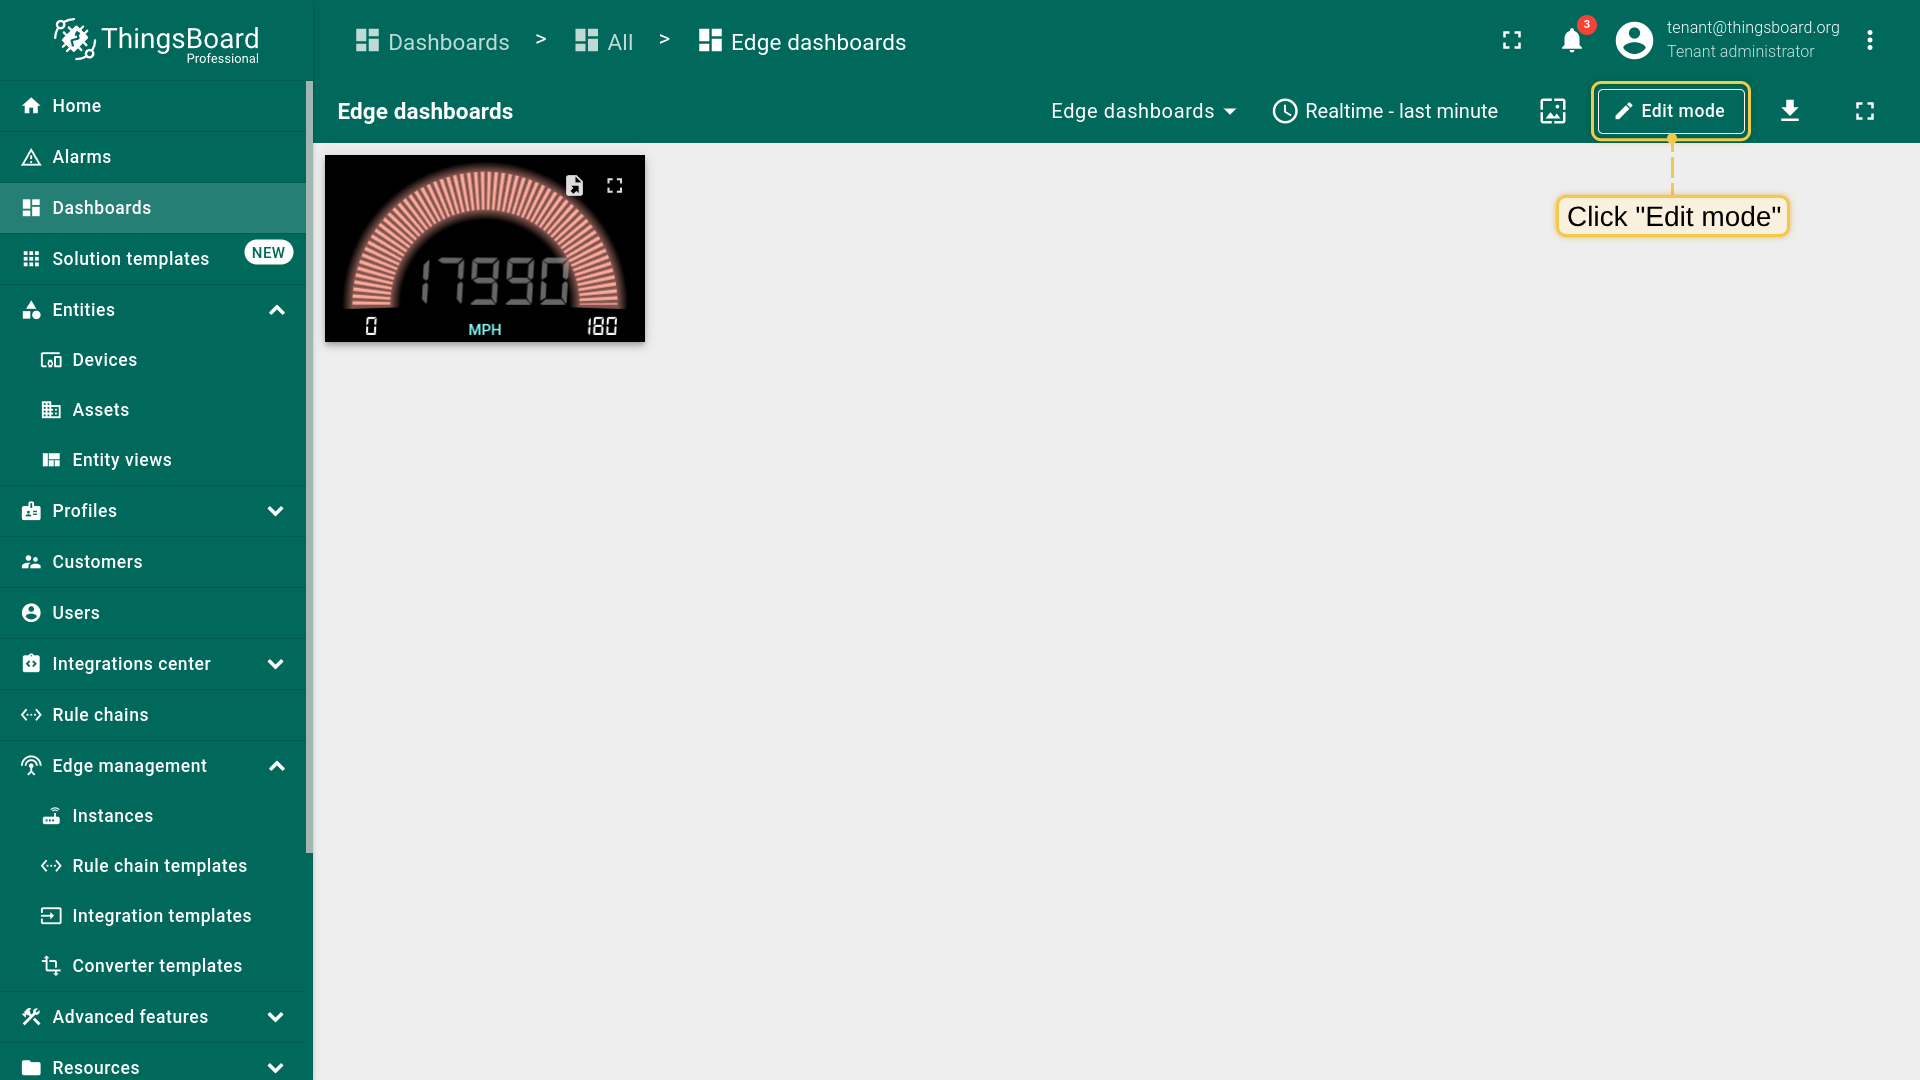
- Click on the "Edit mode" button.
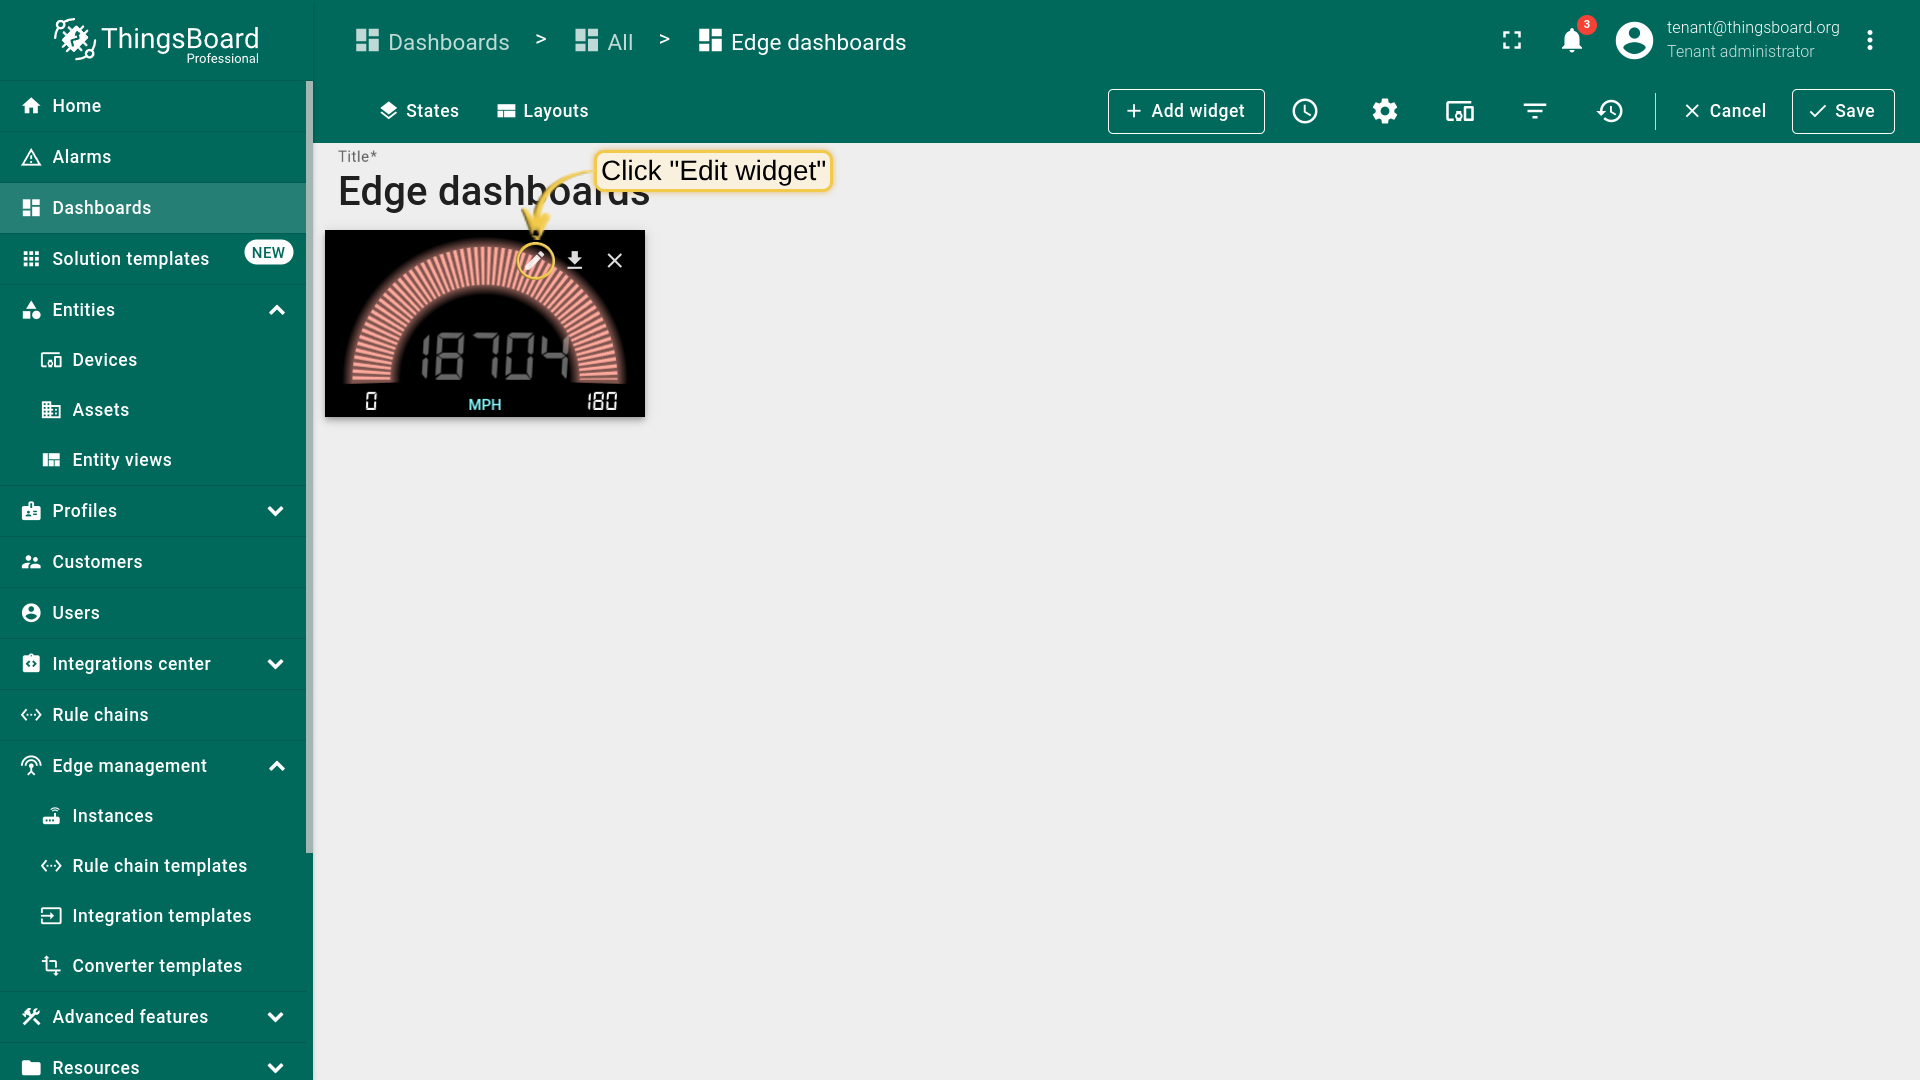
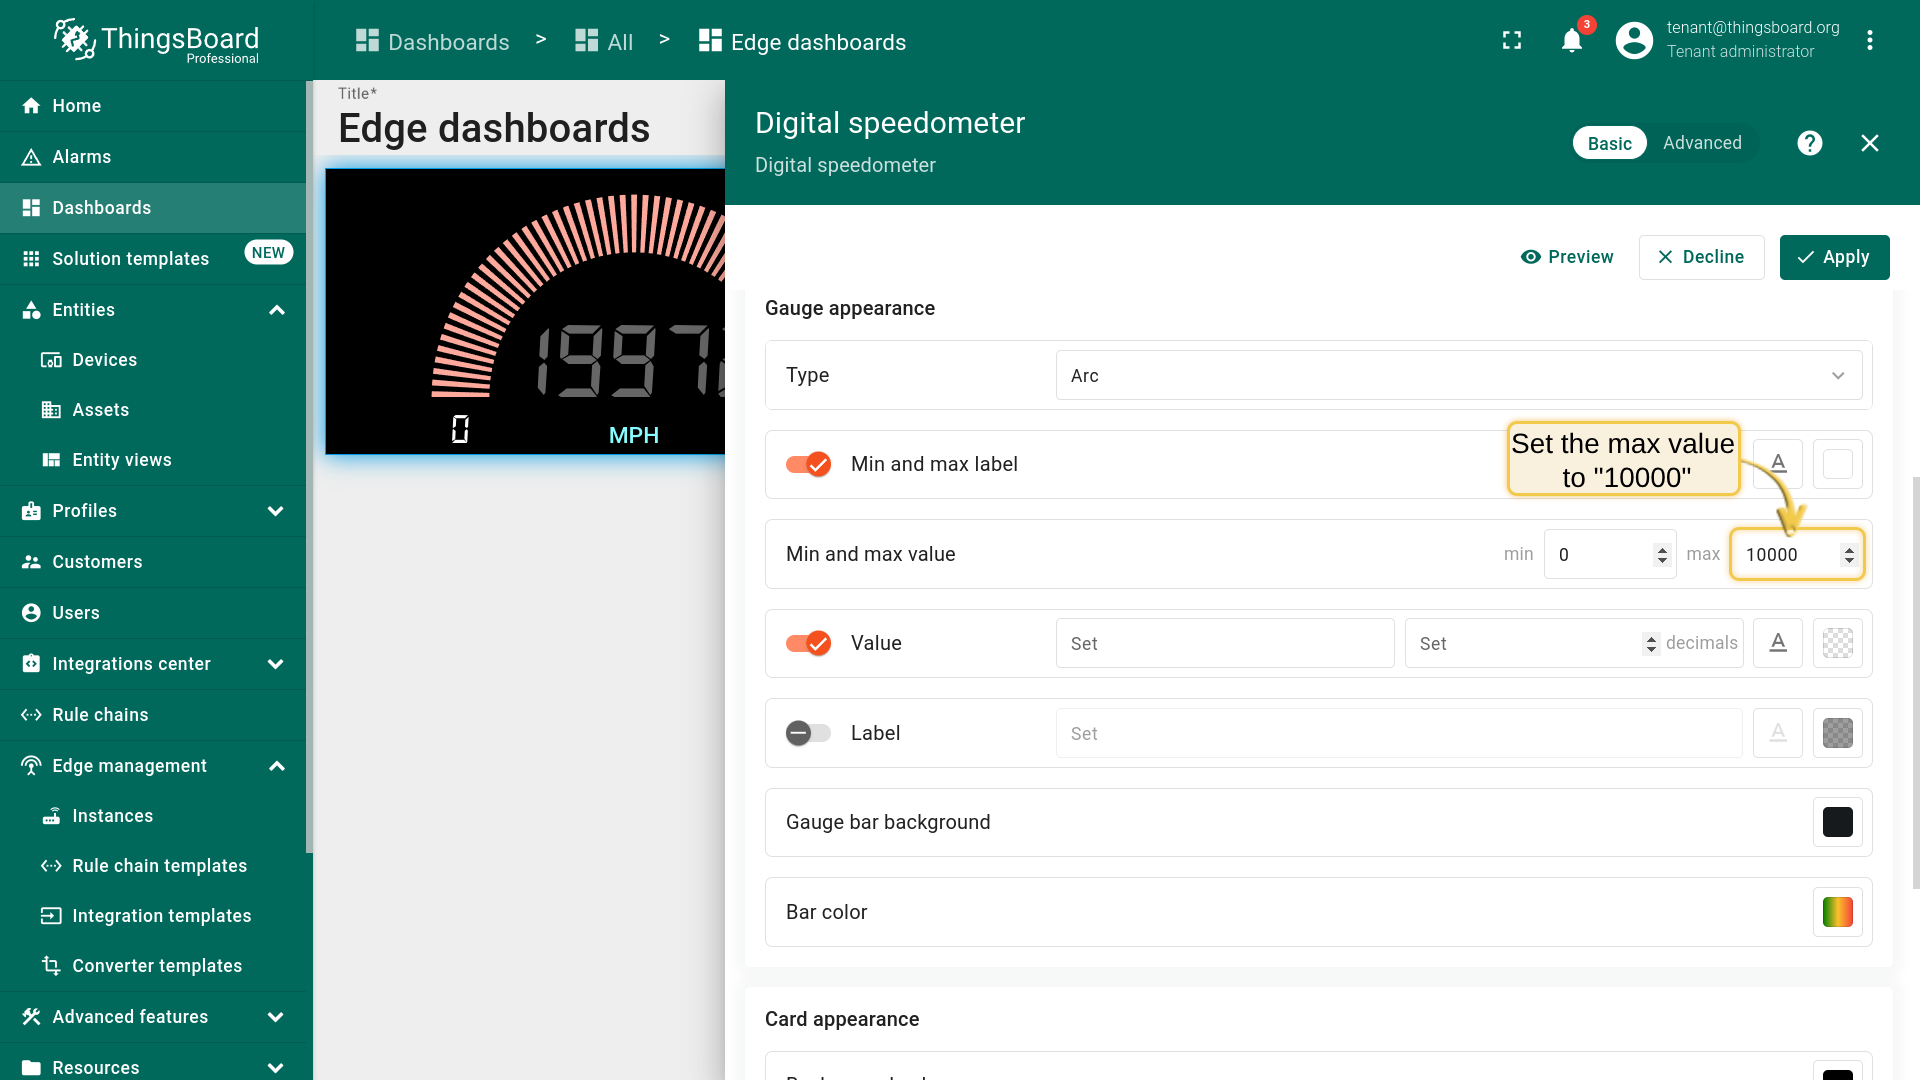
- Click on the "Edit widget" icon.
- Set max value to "10000".
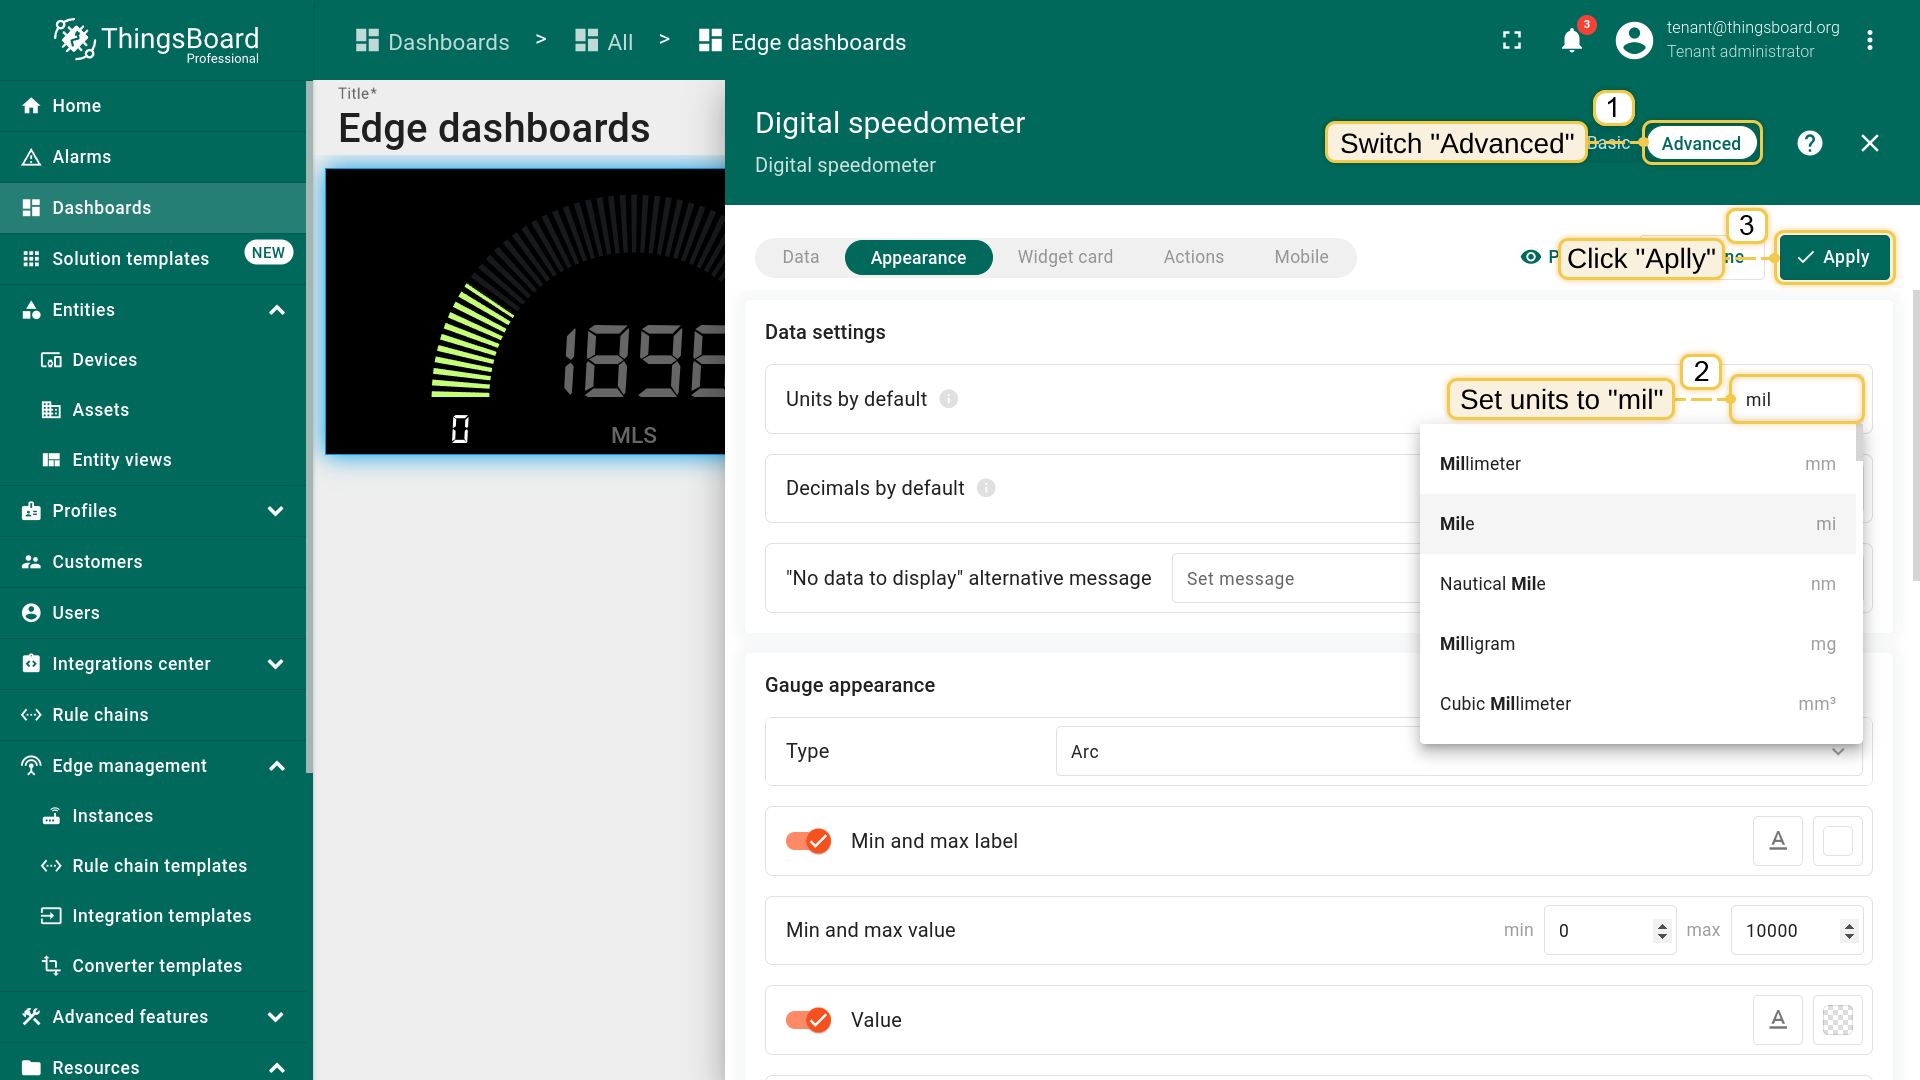
- Switch to the "Advanced" tab, set the units to "mil", and click the "Apply" button.
- You have successfully created and configured the dashboard.

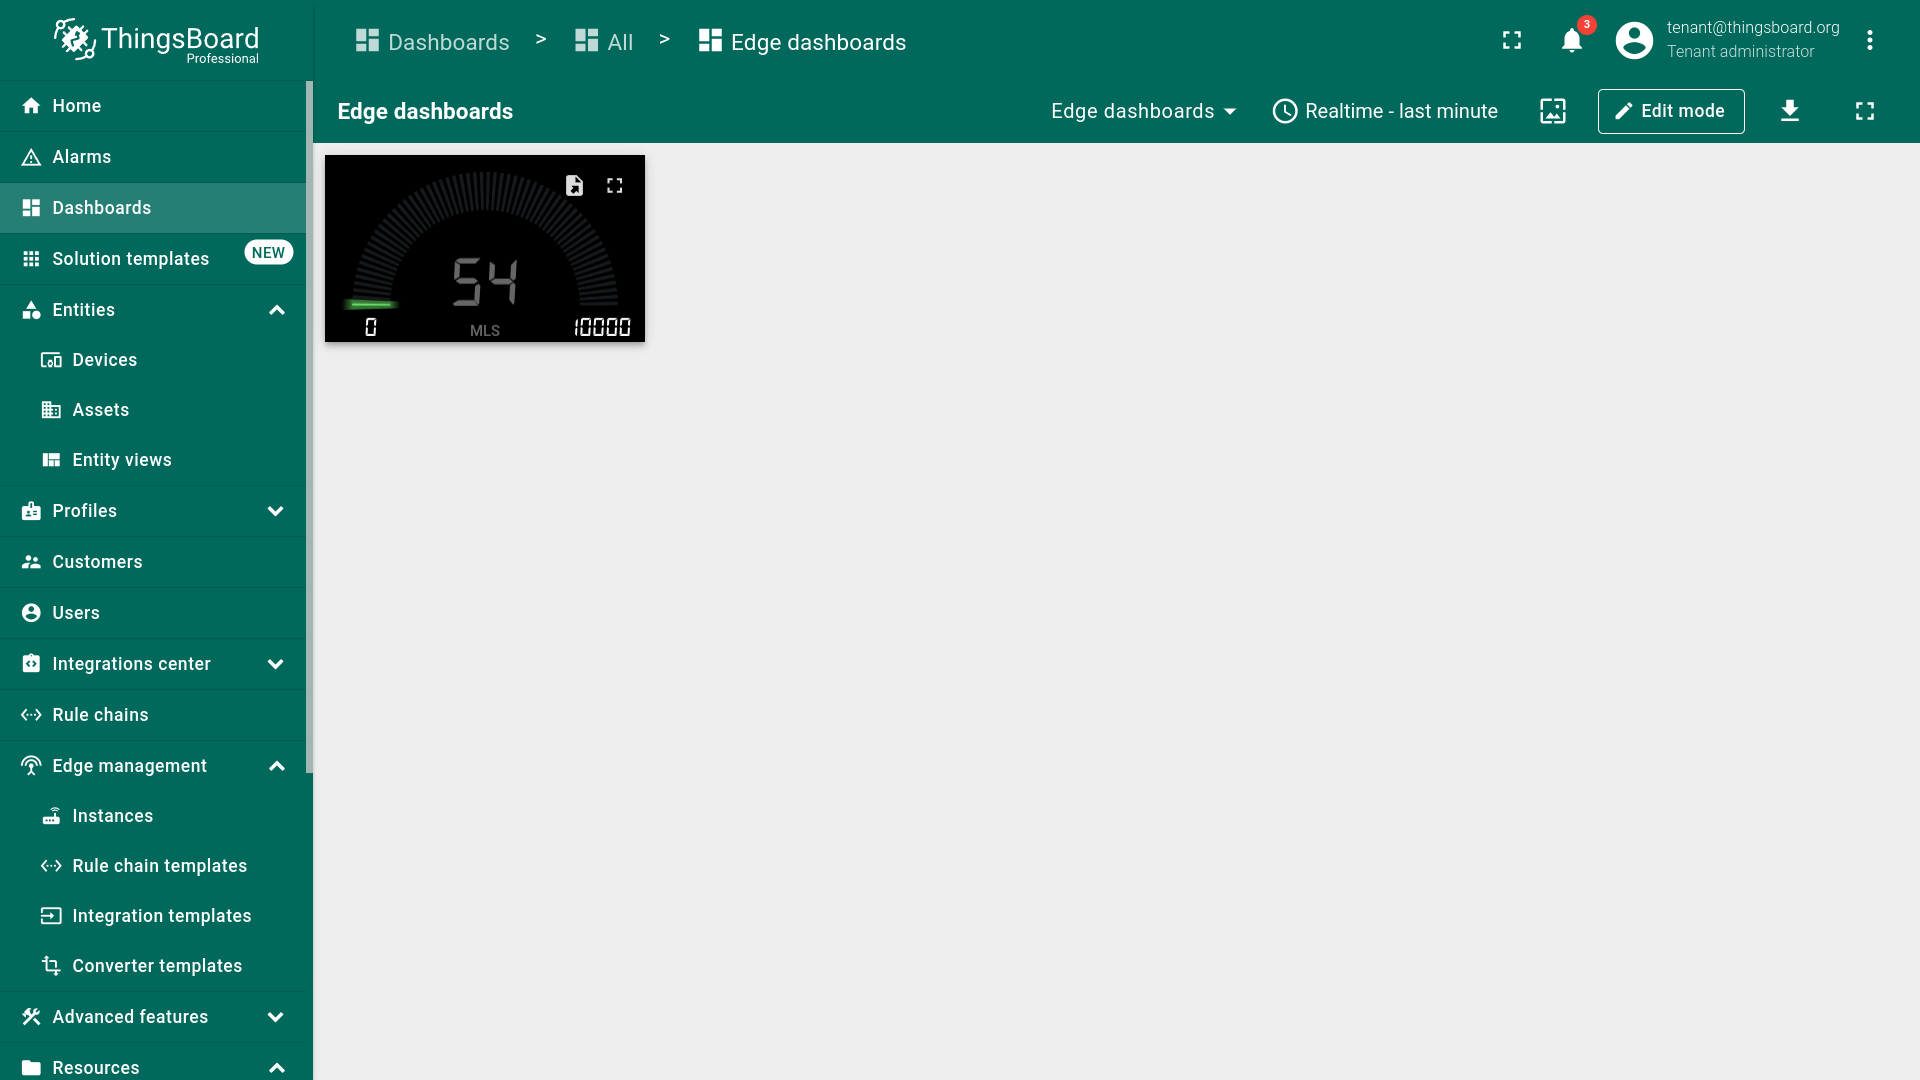
Congratulations! You have successfully sent telemetry from the device, saved it on the edge, pushed filtered data to the cloud, and visualized it on the dashboard.
Next Steps
-
Getting started guide - Provide quick overview of main ThingsBoard Edge features. Designed to be completed in 15-30 minutes:
-
Installation guides - Learn how to setup ThingsBoard Edge on various available operating systems and connect to ThingsBoard Server.
-
Edge Rule Engine:
-
Rule Chain Templates - Learn how to use ThingsBoard Edge Rule Chain Templates.
-
Provision Rule Chains from cloud to edge - Learn how to provision edge rule chains from cloud to edge.
-
- Security:
- gRPC over SSL/TLS - Learn how to configure gRPC over SSL/TLS for communication between edge and cloud.
-
Features:
-
Edge Status - Learn about Edge Status page on ThingsBoard Edge.
-
Cloud Events - Learn about Cloud Events page on ThingsBoard Edge.
-
-
Use cases:
- Data filtering and traffic reduce - This guide will show how to send to cloud from edge only filterd amount of device data:
- Roadmap - ThingsBoard Edge roadmap.