ThingsBoard extensions
ThingsBoard extensions is our additional project that allows you to create your own angular components and use them in your widgets and actions. We highly recommend using this feature for any complex logic in your solutions, because it provides you an opportunity to reuse your code, using all functionality of TypeScript, RXJS, Angular, etc. In this topic, we will cover how to connect your extensions in ThingsBoard 3.6 and higher using our UI.
Important remark: you can use extensions even if you use previous versions of ThingsBoard(before 3.6). For this, you will need to load the extension file manually to your server and restart it. All the necessary information can be found in the README file in the corresponding branches of the extensions project. This branch is used for the ThingsBoard 3.1.0 - 3.4.1 version and this one is for 3.5 - 3.5.1 version.
First of all, you need a file with your compiled components. By default, it is called thingsboard-extension-widgets.js. All instructions on how to create it can be found inside the README file to ThingsBoard extensions.
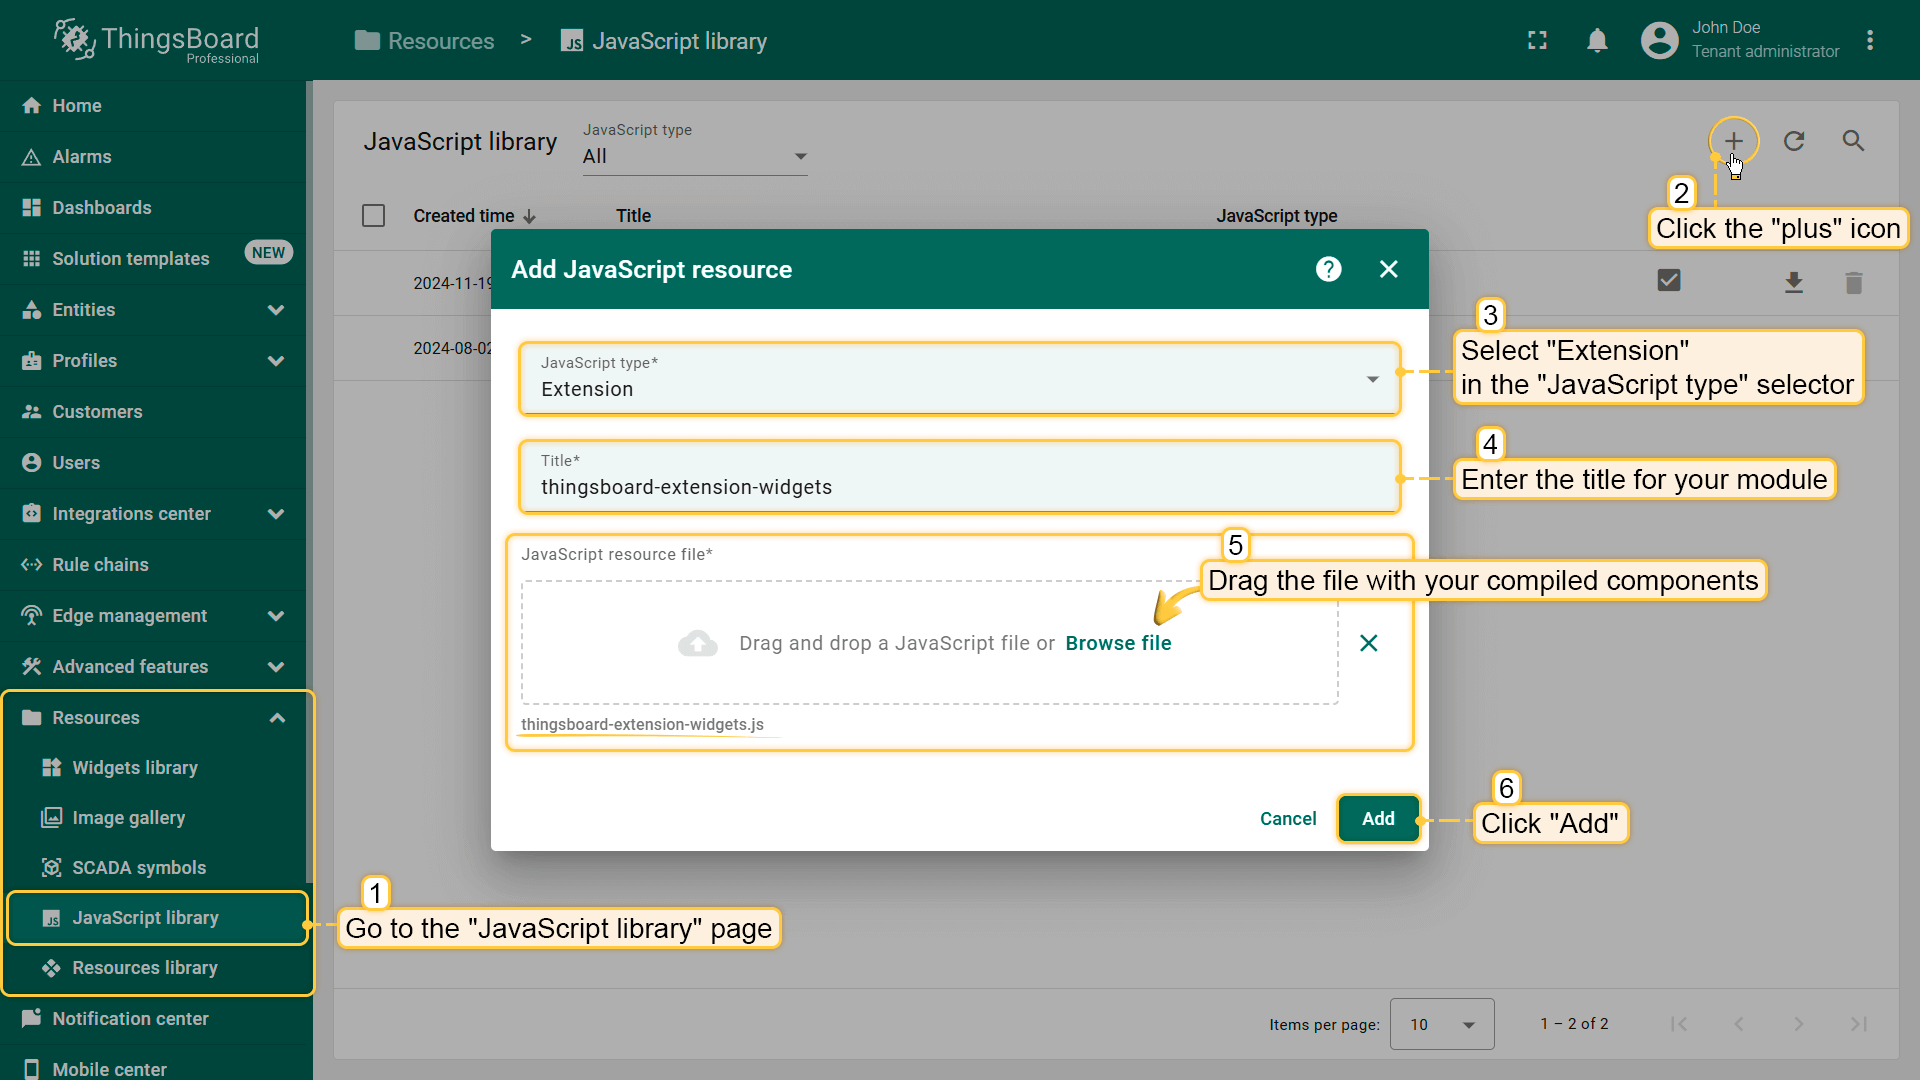
Once you have the file with your components, let’s proceed to load them into ThingsBoard:
- Go to the “JavaScript library” page inside “Resources” section;
- Click the “Add JavaScript resource” button (the “plus” icon in the upper-right corner of the window);
- In the open pop-up, select “Extension” in the “JavaScript type” selector (or “Module” to paste a piece of code);
- Enter title for your module;
- Drag the file with your compiled components;
- Click “Add”.
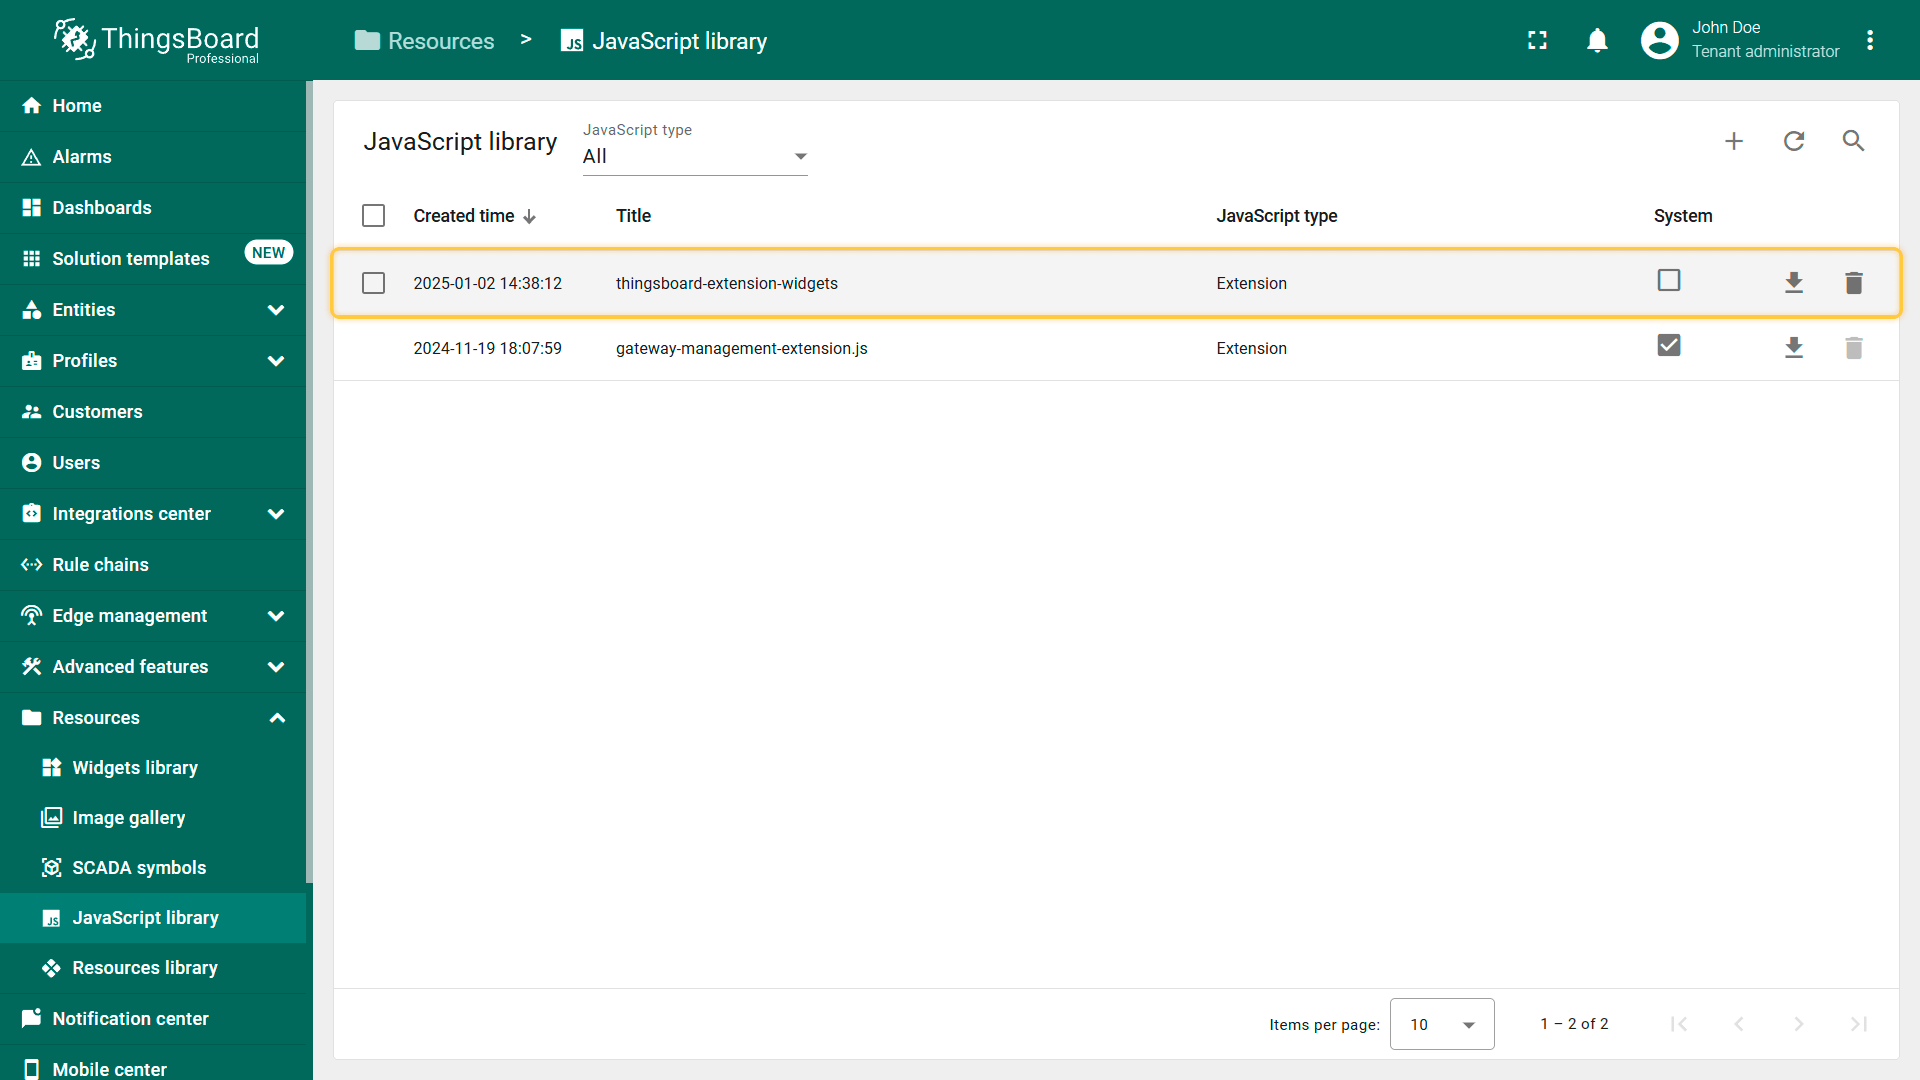
Congratulations, your components have been added to the ThingsBoard!
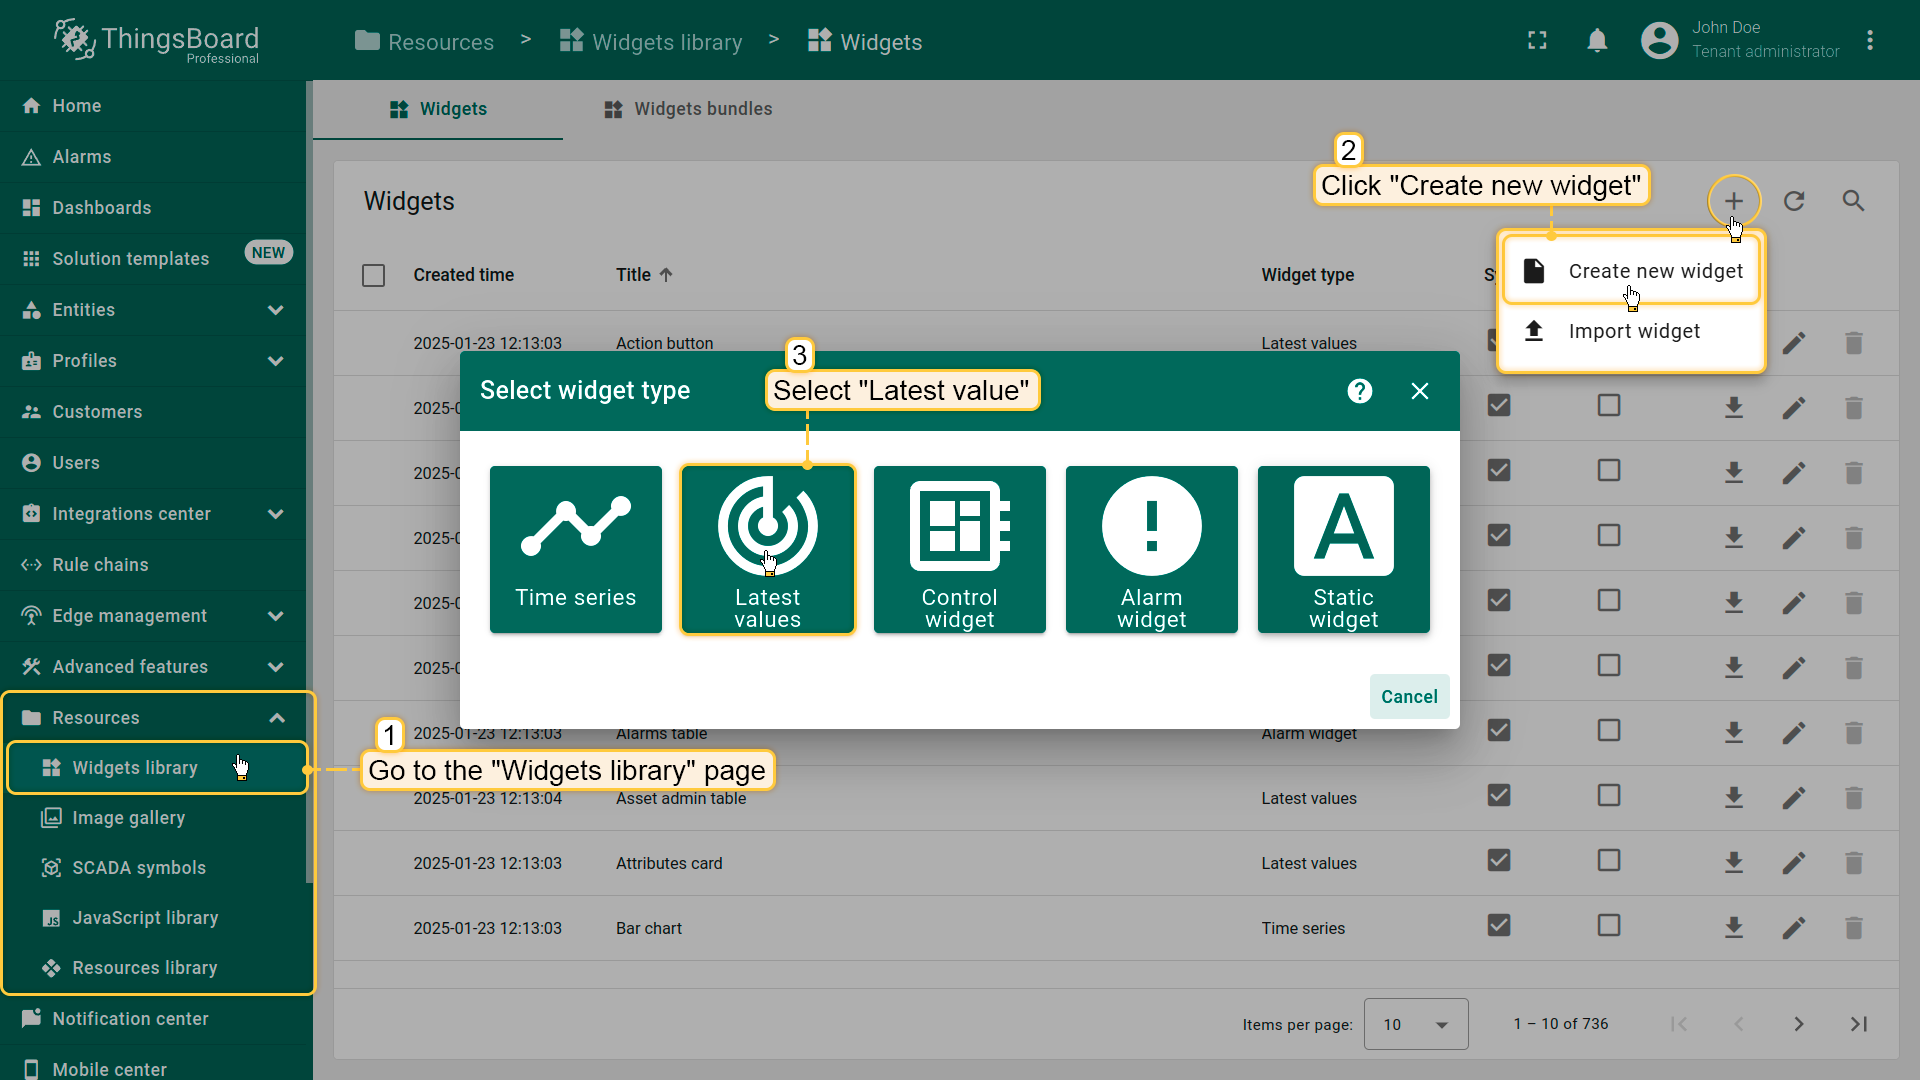
Now, let’s use them in some widget. We shall create a simple latest value widget that will use components from our extensions (in case you have questions about how to create a new widget, you should read this topic):
- Go to the “Widgets library” page of the “Resources” section;
- Click the “plus” icon in the upper-right corner of the window, and select the “Create new widget” option;
- Select widget type - “Latest value”;
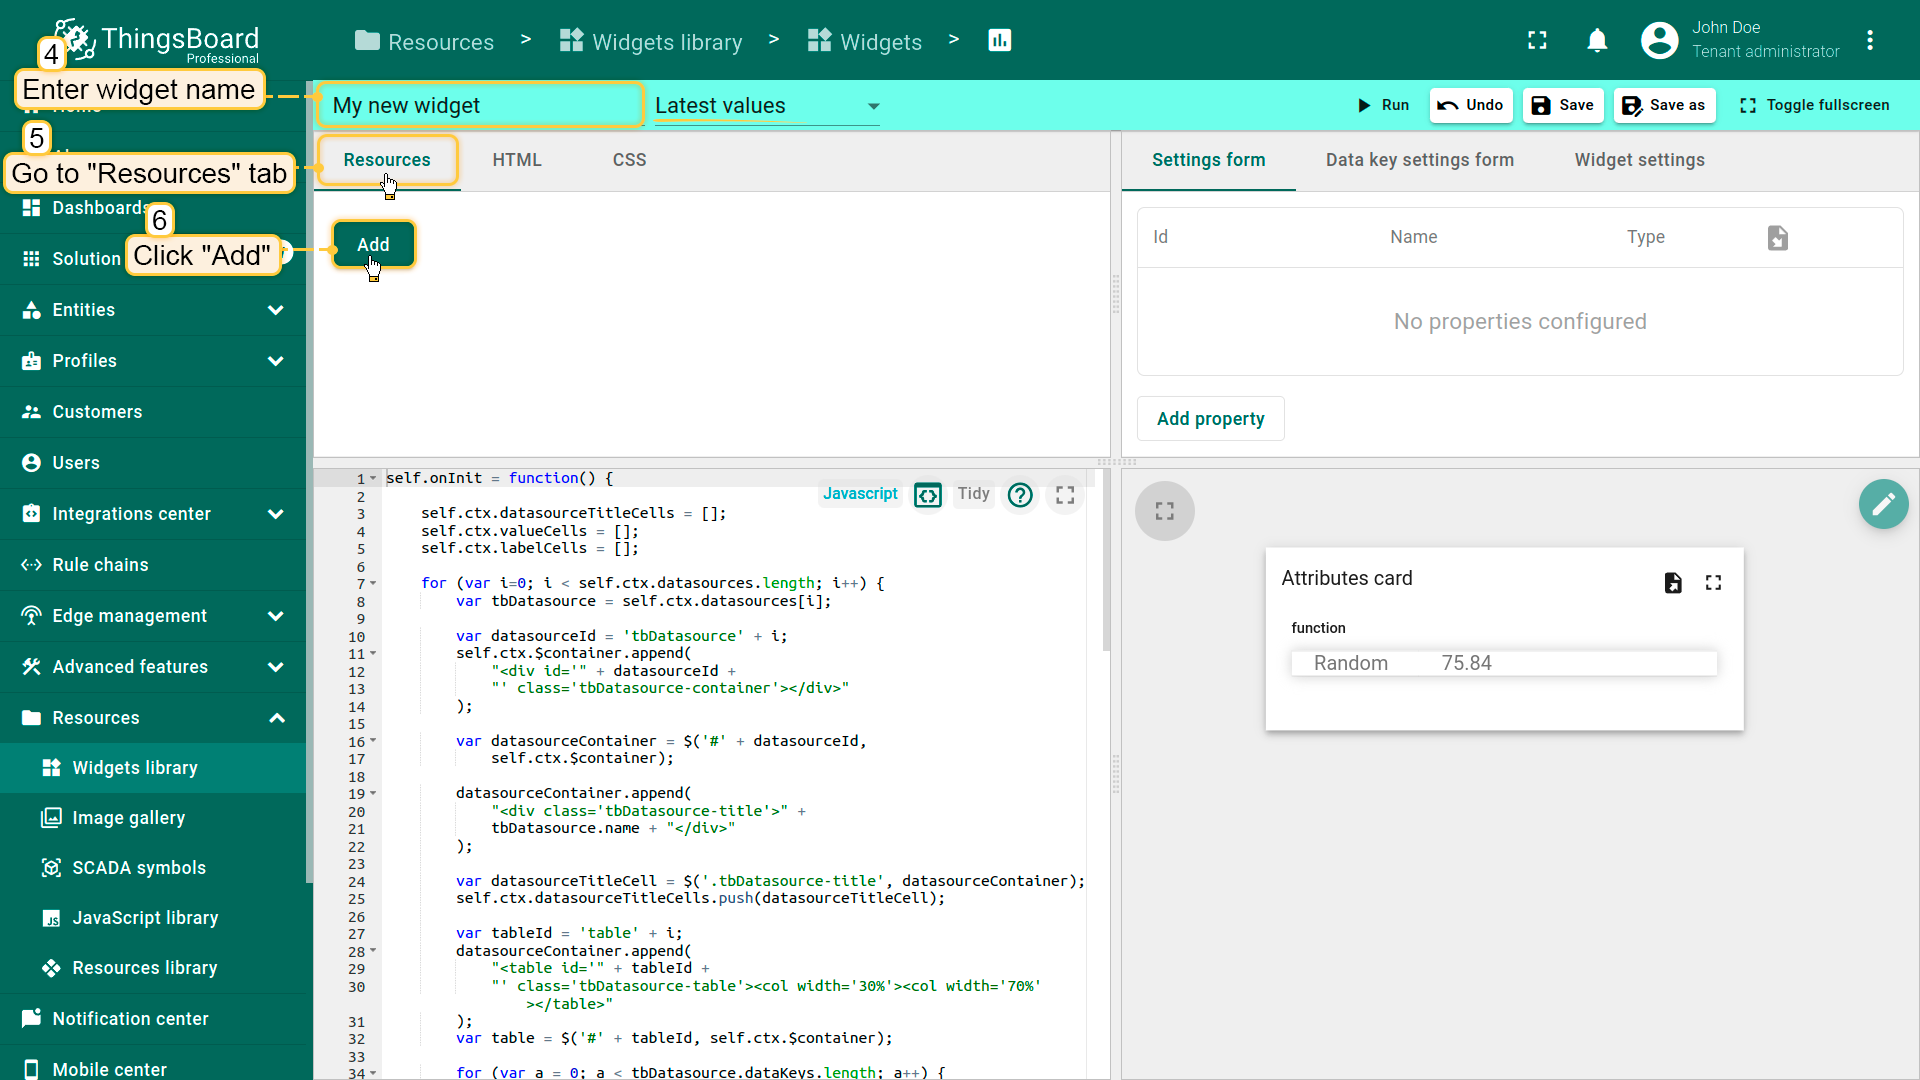
- Enter widget name;
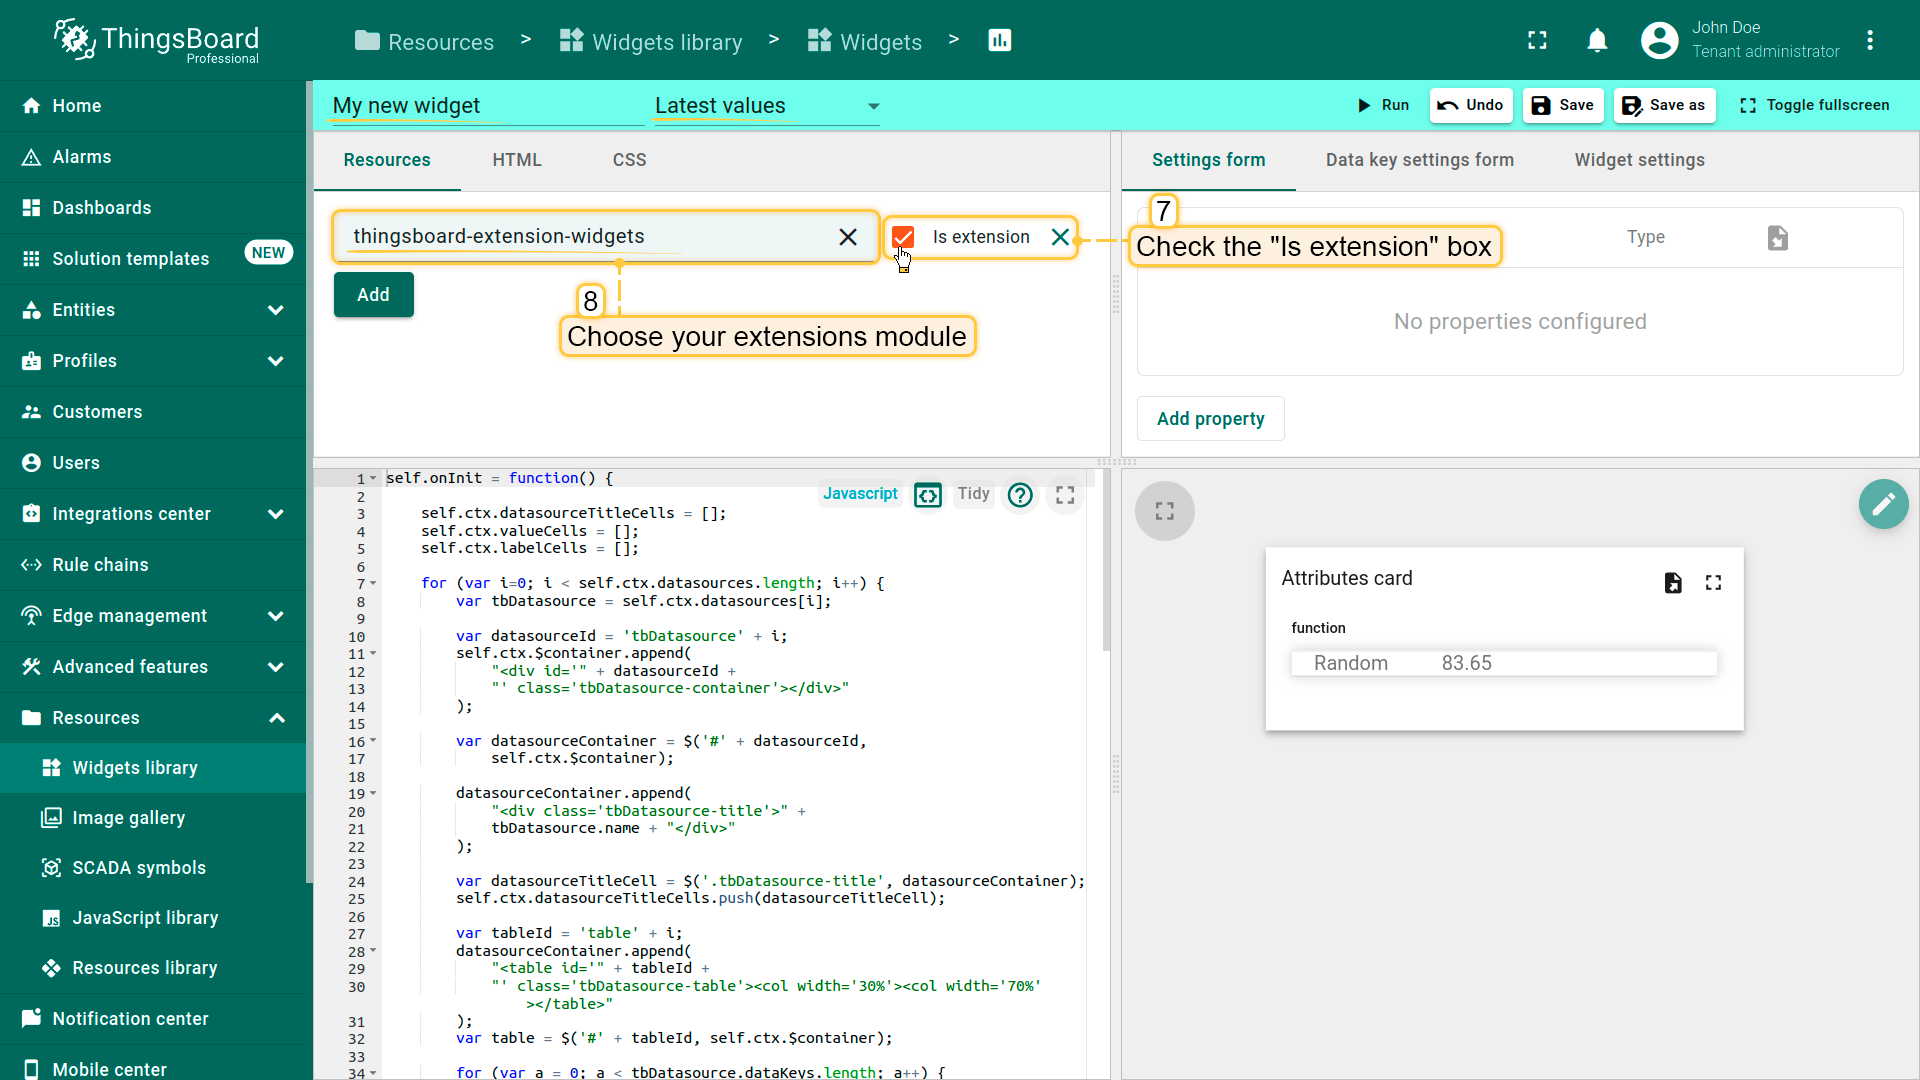
- Navigate to the “Resources” tab, and click “Add” button;
- Check the “Is extension” box;
- Choose your extension module from the drop-don menu;
Your module is connected to your widget. Now, you can use your angular components:
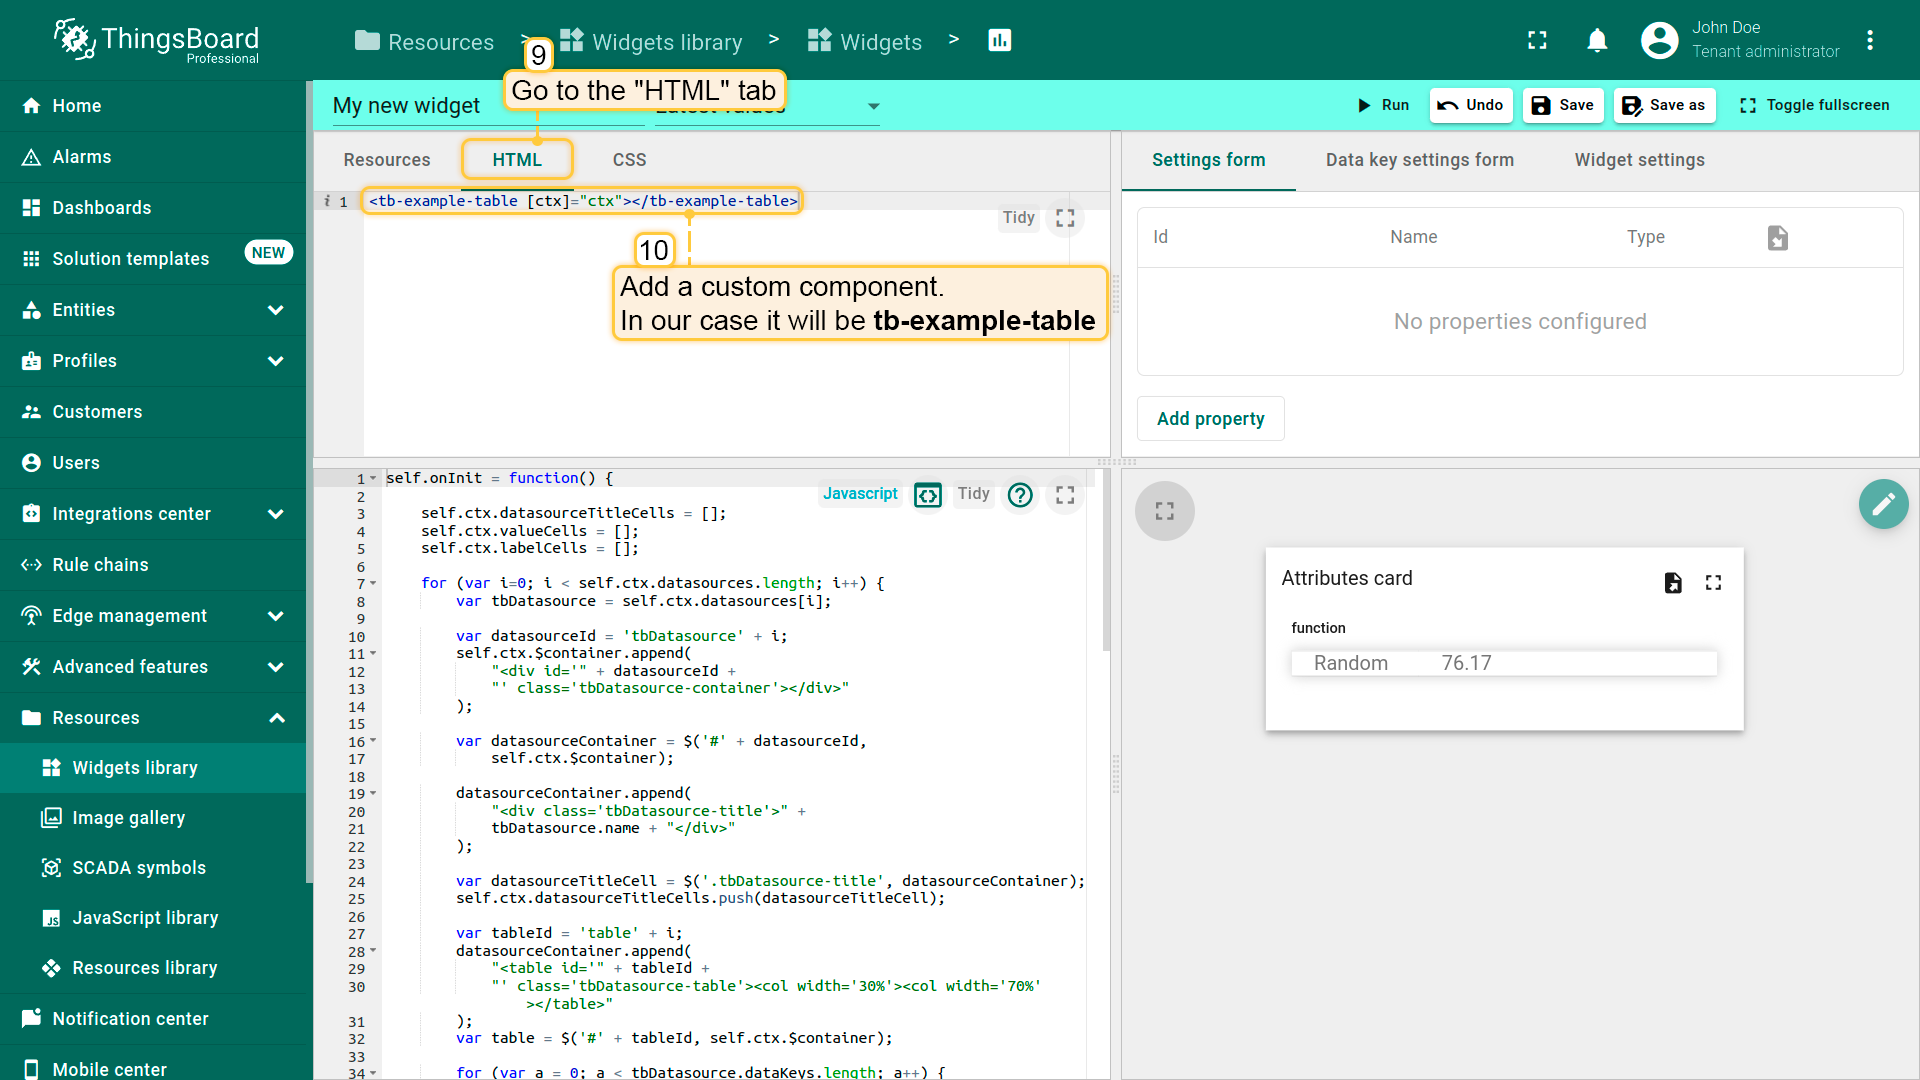
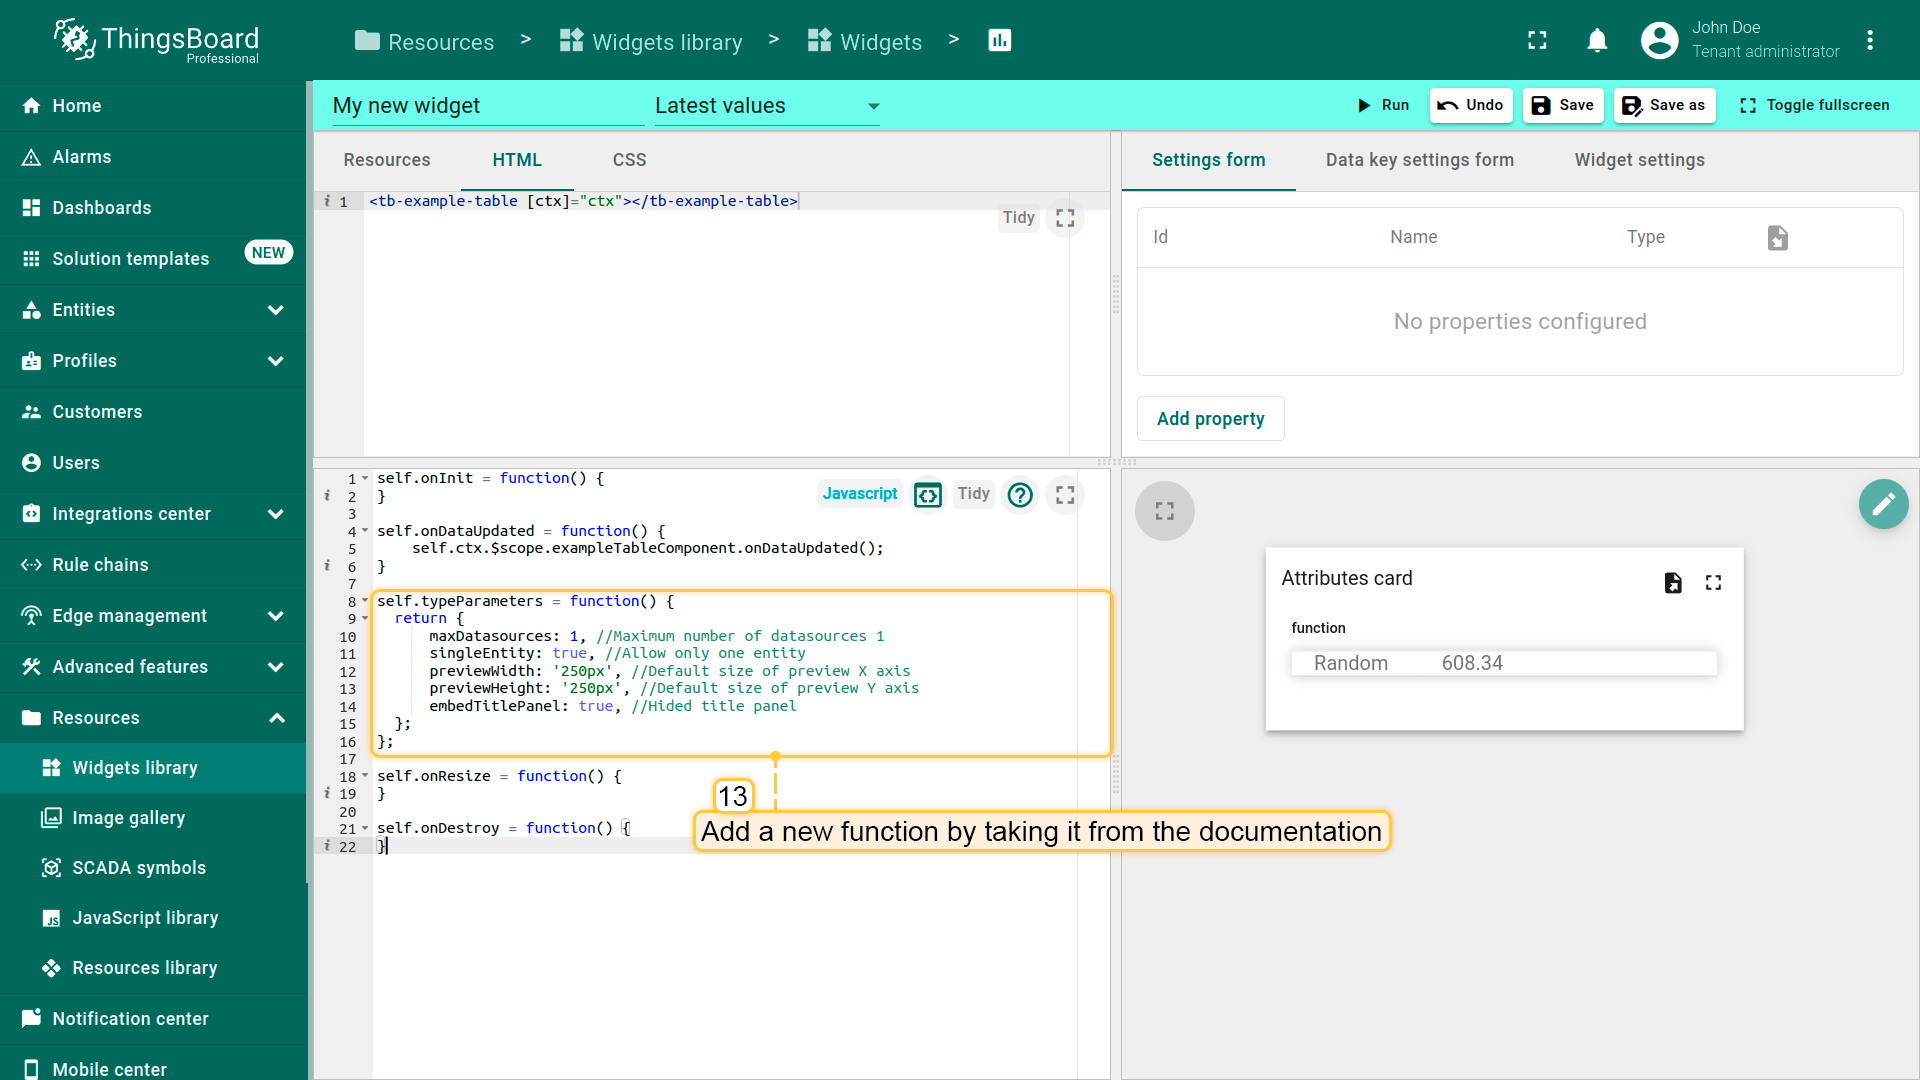
- Go to the “HTML” tab, and add the custom component. In our case it will be tb-example-table (don’t forget to add ctx);
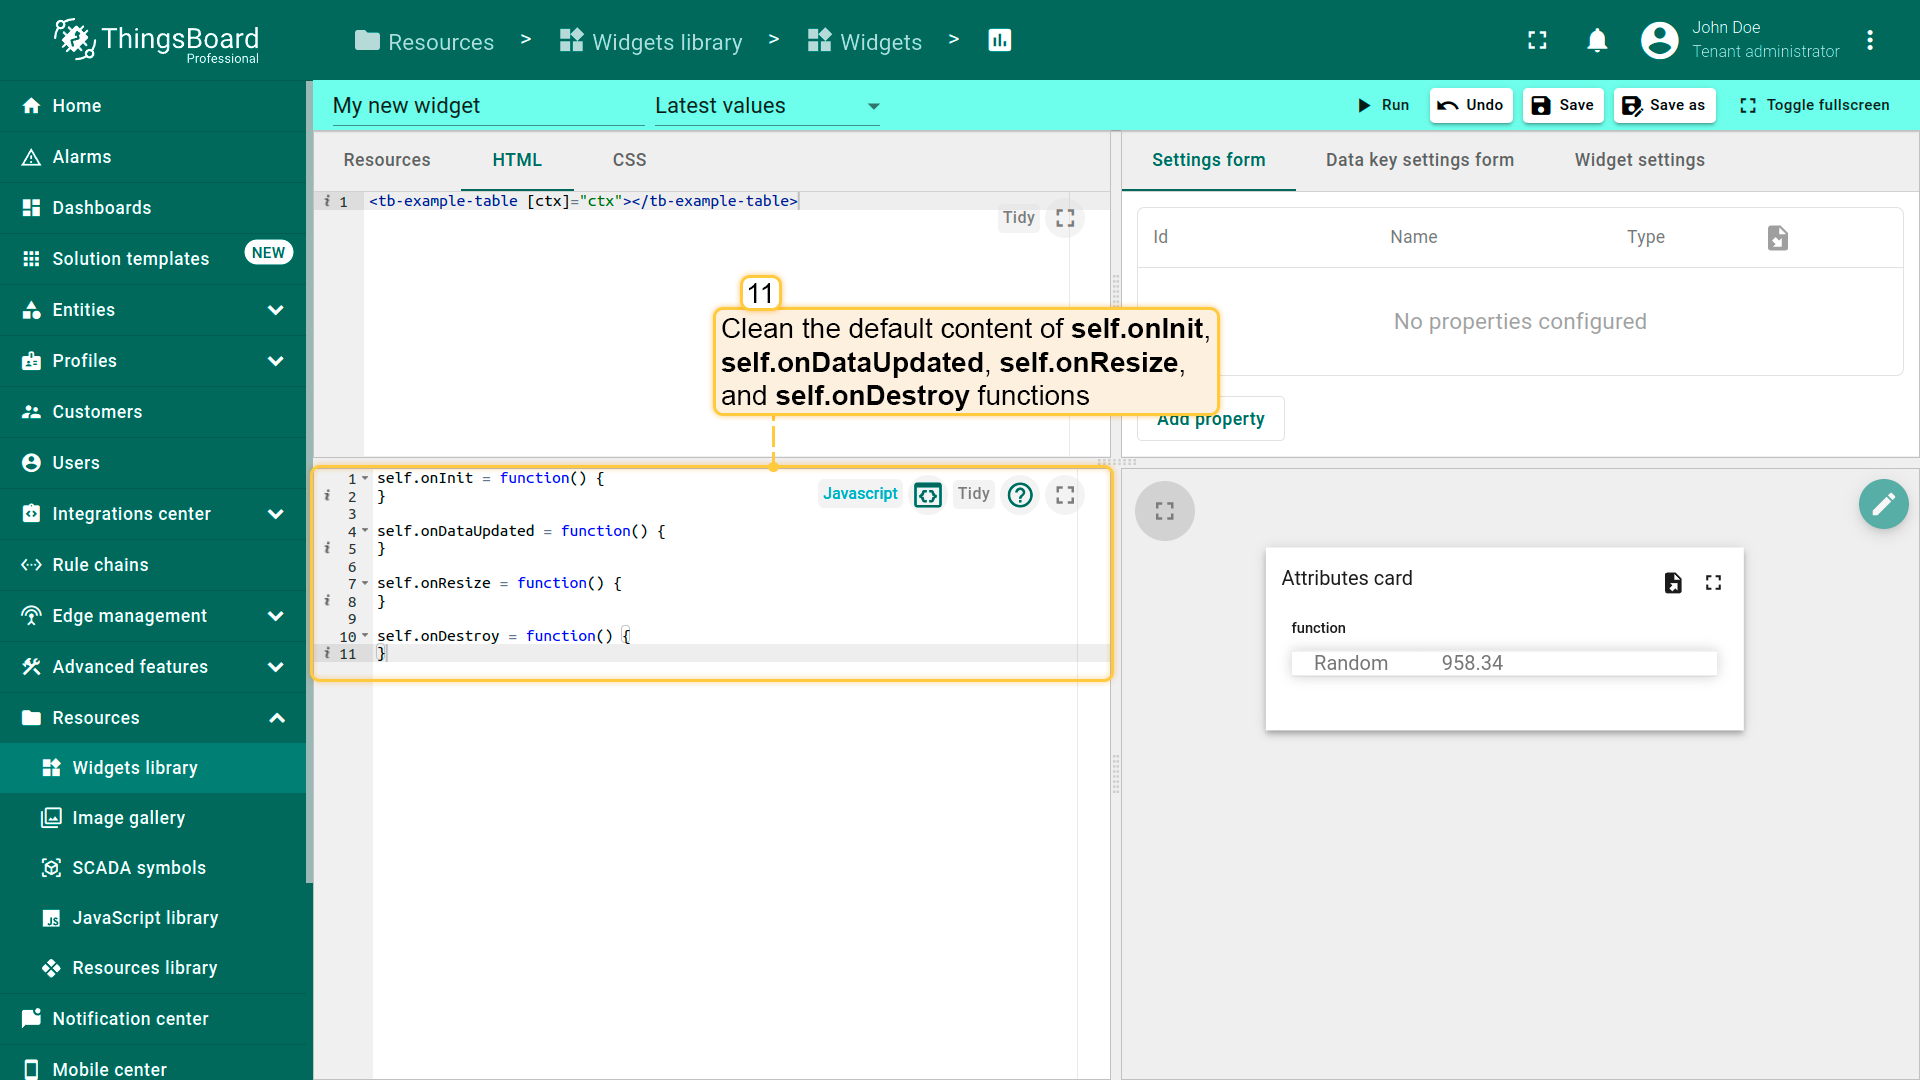
- Clean the default content of self.onInit, self.onDataUpdated, self.onResize functions;
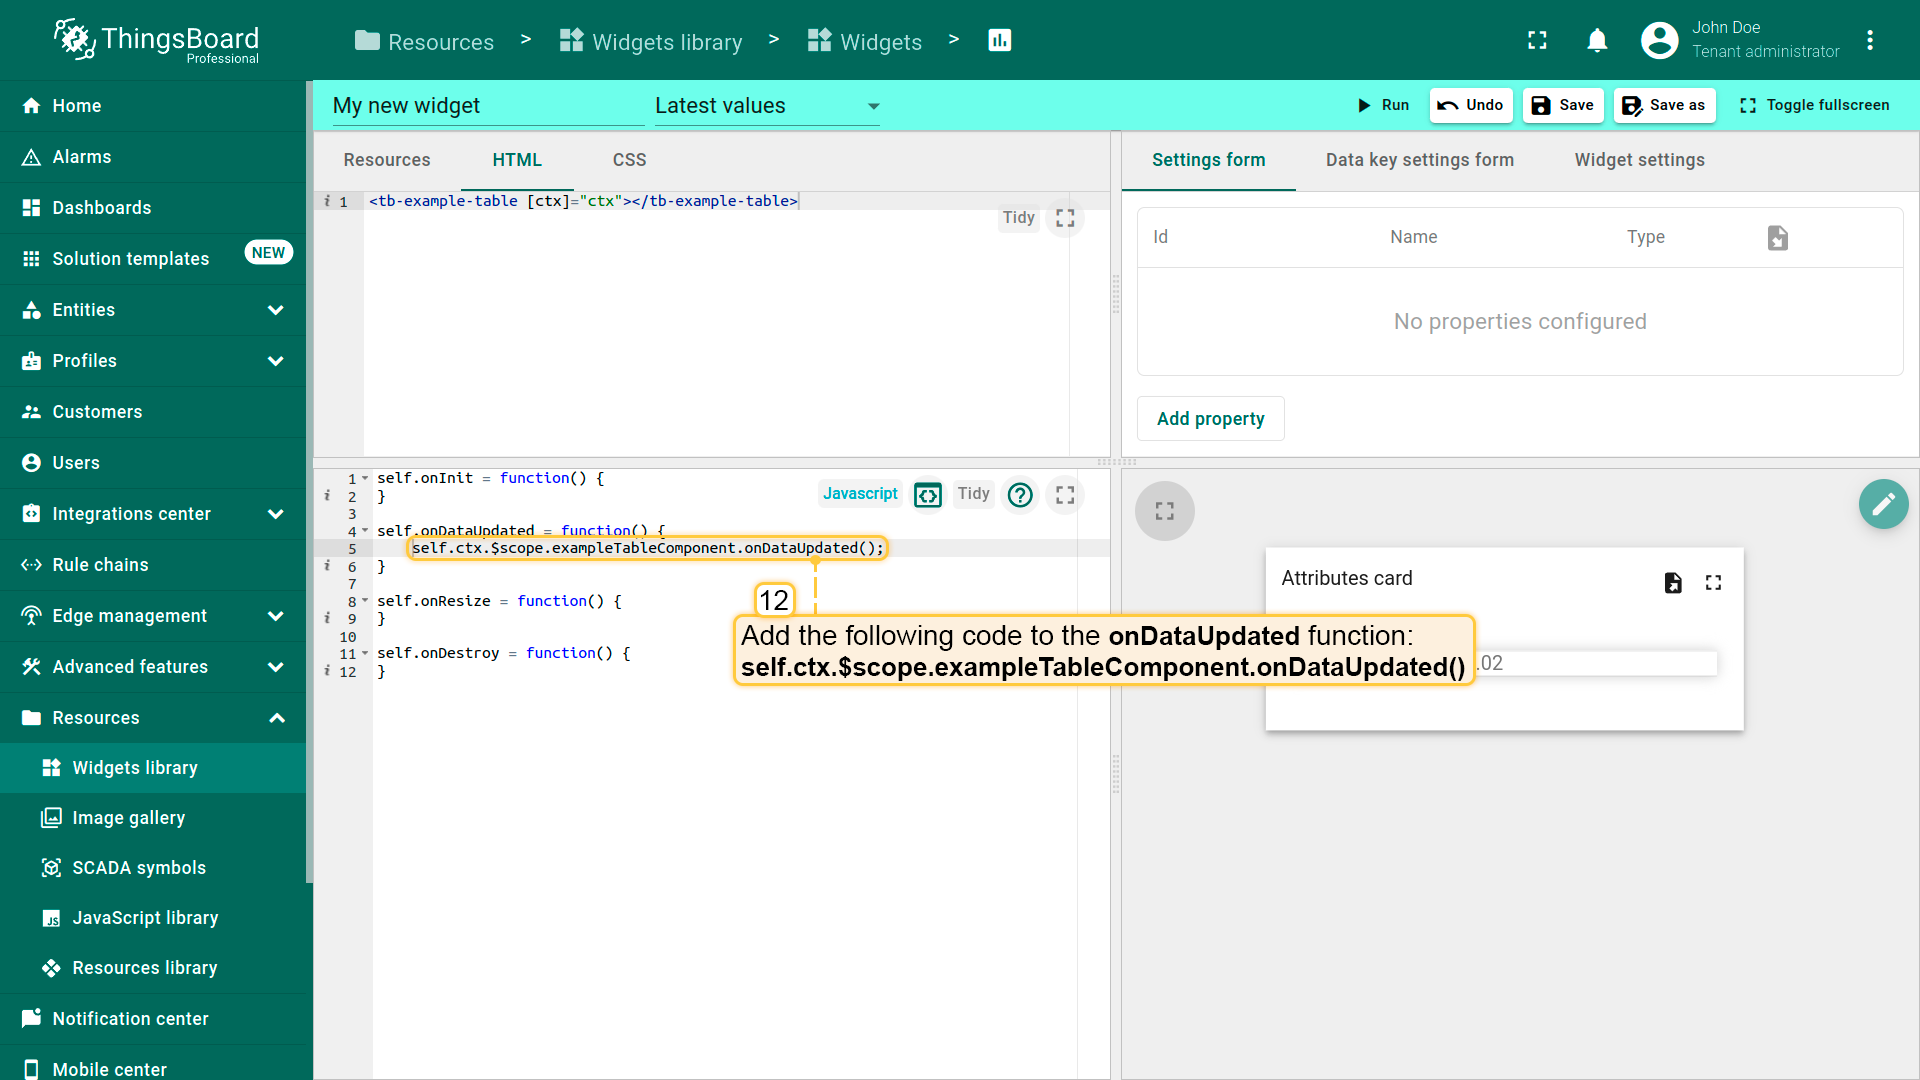
- Add to the onDataUpdated function next code:
1
self.ctx.$scope.exampleTableComponent.onDataUpdated();
It will trigger the update function inside a custom component when the widget receives new data;
- Add next function:
1
2
3
4
5
6
7
8
9
self.typeParameters = function() {
  return {
      maxDatasources: 1, //Maximum number of datasources 1
      singleEntity: true, //Allow only one entity
      previewWidth: '250px', //Default size of preview X axis
      previewHeight: '250px', //Default size of preview Y axis
      embedTitlePanel: true, //Hided title panel
  };
};
It sets behavior rules for the widget
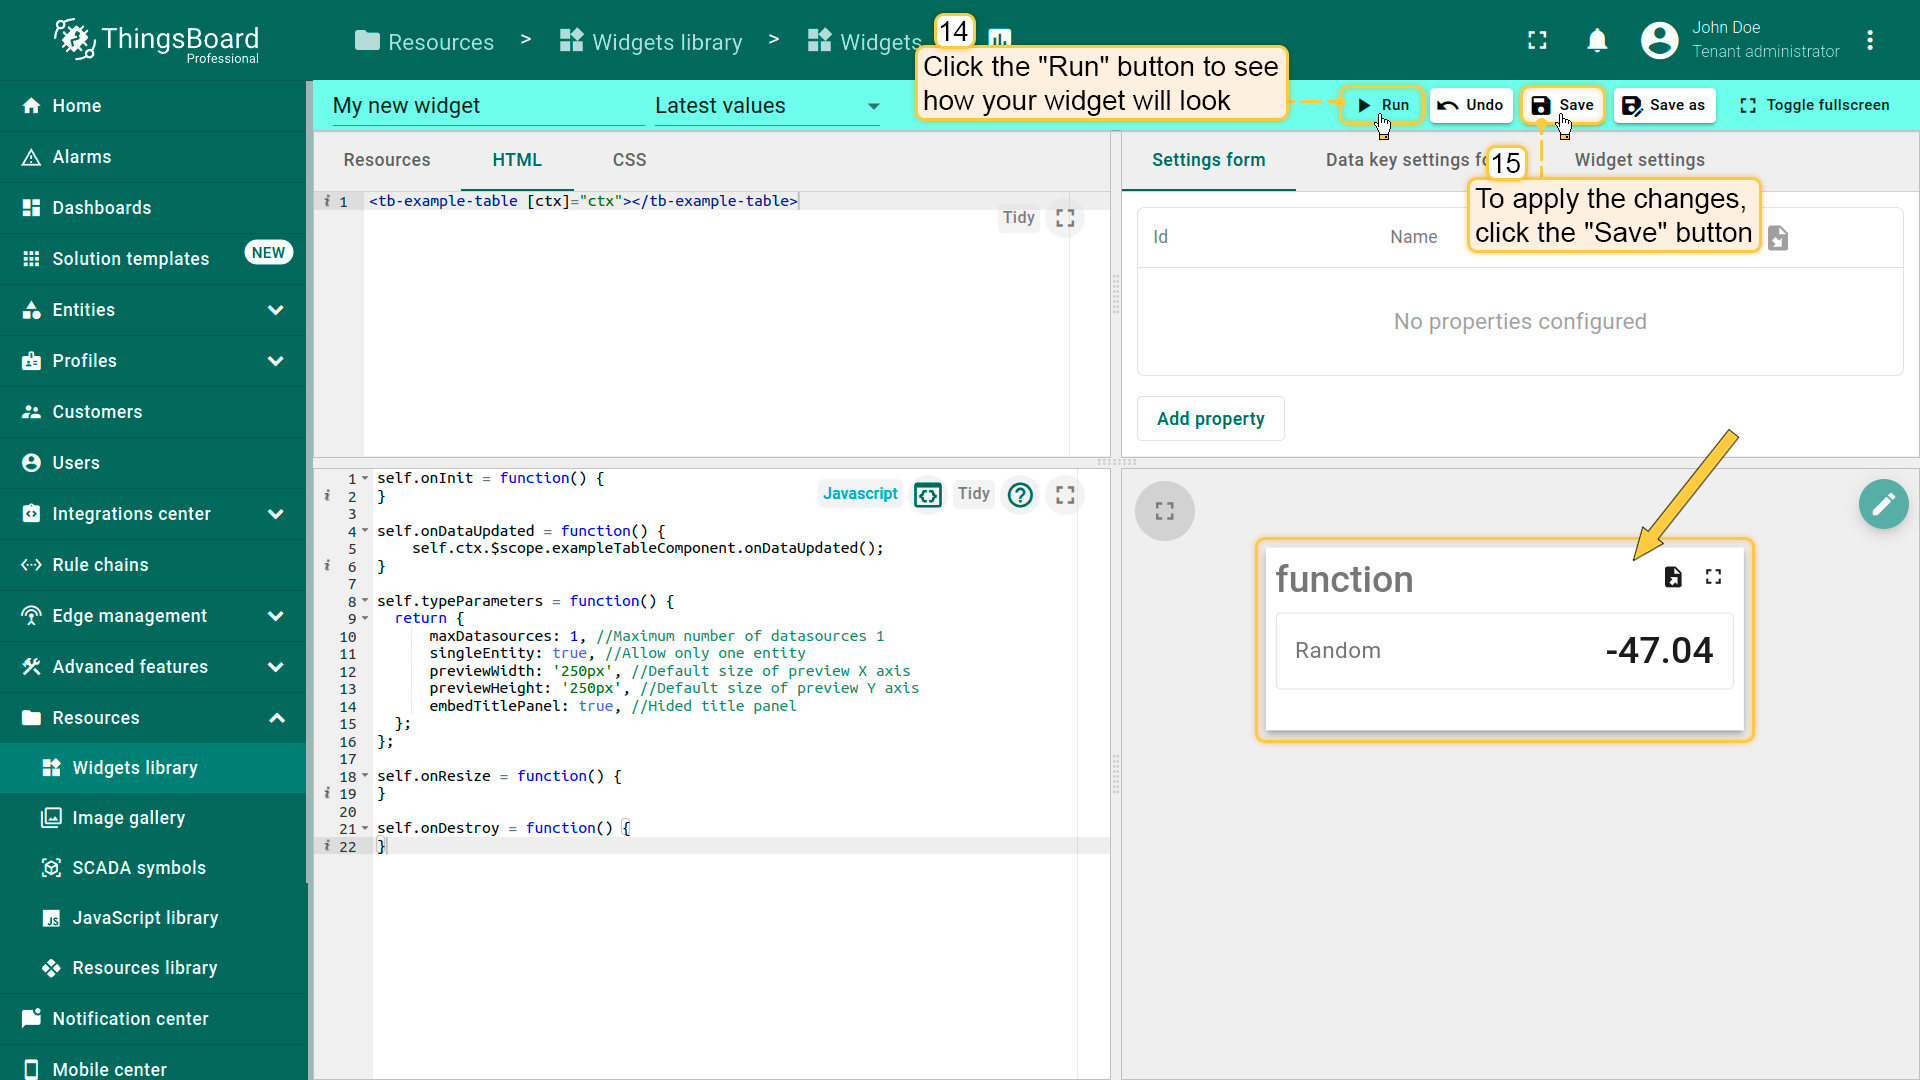
- Click the “Run” button to preview how your widget will look;
- To apply the changes, click the “Save” button.
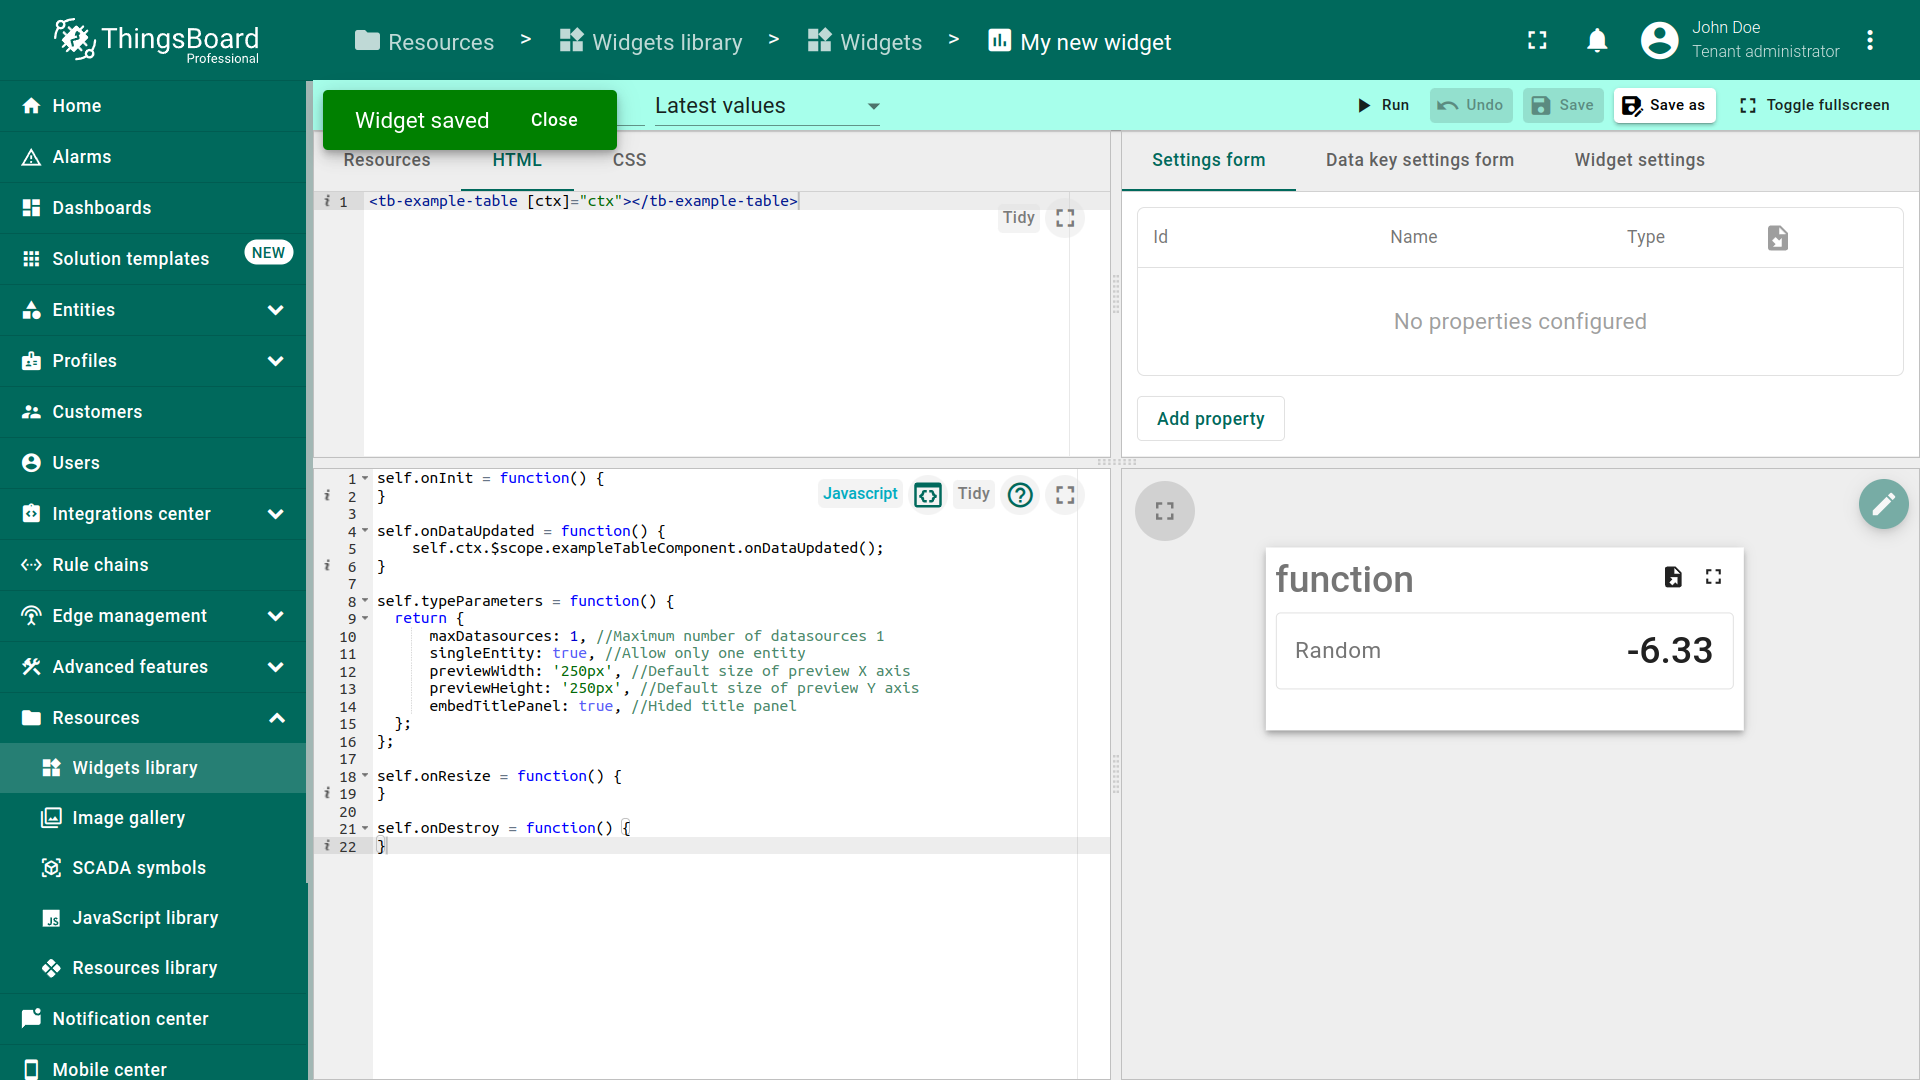
Now, your component is used inside your widget.
In general, ThingsBoard extensions allow you to create any possible widgets in the scope of ThingsBoard platforms.
Good luck with your future awesome solutions!
Integrating existing code to create widget definition
Below are some examples demonstrating how external JavaScript libraries or existing code can be reused/integrated to create new widgets.
Using external JavaScript library
Latest Values Example
In this example, Latest Values gauge widget will be created using external gauge.js library.
In the Widgets Bundle view, click the big “+” button at the bottom-right part of the screen, then click the “Create new widget type” button. Click the Latest Values button on the Select widget type pop-up. The Widget Editor will be opened, pre-populated with the content of default Latest Values template widget.
- Open Resources tab and click “Add” then insert the following link:
1
https://bernii.github.io/gauge.js/dist/gauge.min.js
- Clear content of the CSS tab of “Resources” section.
- Put the following HTML code inside the HTML tab of “Resources” section:
1
  <canvas id="my-gauge"></canvas>
- Put the following JavaScript code inside the “JavaScript” section:
1
2
3
4
5
6
7
8
9
10
11
12
13
14
15
16
17
18
19
20
21
22
23
24
25
var canvasElement;
var gauge;

self.onInit = function() {
    canvasElement = $('#my-gauge', self.ctx.$container)[0];
    gauge = new Gauge(canvasElement);
    gauge.minValue = -1000;
    gauge.maxValue = 1000;
    gauge.animationSpeed = 16;
    self.onResize();
}

self.onResize = function() {
    canvasElement.width = self.ctx.width;
    canvasElement.height = self.ctx.height;
    gauge.update(true);
    gauge.render();
}

self.onDataUpdated = function() {
    if (self.ctx.defaultSubscription.data[0].data.length) {
        var value = self.ctx.defaultSubscription.data[0].data[0][1];
        gauge.set(value);
    }
}
- Click the Run button on the Widget Editor Toolbar in order to see the result in Widget preview section.
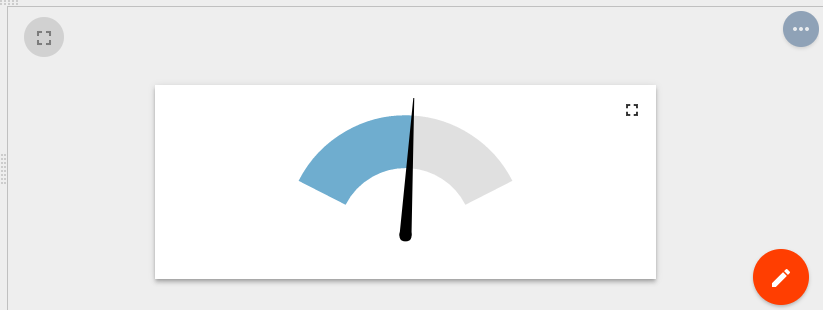
In this example, the external JS library API was used, which becomes available after injecting the corresponding URL in Resources section. The displayed value was obtained from subscription data property for the first dataKey.
Time-Series Example
In this example, Time-Series line chart widget will be created using external Chart.js library.
In the Widgets Bundle view, click the big “+” button at the bottom-right part of the screen, then click the “Create new widget type” button. Click the Time-Series button on the Select widget type pop-up. The Widget Editor will be opened, pre-populated with the content of default Time-Series template widget.
- Open Resources tab and click “Add” then insert the following link:
1
https://cdnjs.cloudflare.com/ajax/libs/Chart.js/2.9.3/Chart.min.js
- Clear content of the CSS tab of “Resources” section.
- Put the following HTML code inside the HTML tab of “Resources” section:
1
  <canvas id="myChart"></canvas>
- Put the following JavaScript code inside the “JavaScript” section:
1
2
3
4
5
6
7
8
9
10
11
12
13
14
15
16
17
18
19
20
21
22
23
24
25
26
27
28
29
30
31
32
33
34
35
36
37
38
39
40
41
42
43
44
45
46
47
48
49
50
51
52
53
54
55
56
57
58
59
60
61
62
63
64
65
66
var myChart;

self.onInit = function() {

    var chartData = {
        datasets: []
    };

    for (var i=0; i < self.ctx.data.length; i++) {
        var dataKey = self.ctx.data[i].dataKey;
        var dataset = {
            label: dataKey.label,
            data: [],
            borderColor: dataKey.color,
            fill: false
        };
        chartData.datasets.push(dataset);
    }

    var options = {
        maintainAspectRatio: false,
        legend: {
            display: false
        },
        scales: {
        xAxes: [{
            type: 'time',
            ticks: {
                maxRotation: 0,
                autoSkipPadding: 30
            }
        }]
    }
    };

    var canvasElement = $('#myChart', self.ctx.$container)[0];
    var canvasCtx = canvasElement.getContext('2d');
    myChart = new Chart(canvasCtx, {
        type: 'line',
        data: chartData,
        options: options
    });
    self.onResize();
}

self.onResize = function() {
    myChart.resize();
}

self.onDataUpdated = function() {
    for (var i = 0; i < self.ctx.data.length; i++) {
        var datasourceData = self.ctx.data[i];
        var dataSet = datasourceData.data;
        myChart.data.datasets[i].data.length = 0;
        var data = myChart.data.datasets[i].data;
        for (var d = 0; d < dataSet.length; d++) {
            var tsValuePair = dataSet[d];
            var ts = tsValuePair[0];
            var value = tsValuePair[1];
            data.push({t: ts, y: value});
        }
    }
    myChart.options.scales.xAxes[0].ticks.min = self.ctx.timeWindow.minTime;
    myChart.options.scales.xAxes[0].ticks.max = self.ctx.timeWindow.maxTime;
    myChart.update();
}
- Click the Run button on the Widget Editor Toolbar in order to see the result in Widget preview section.
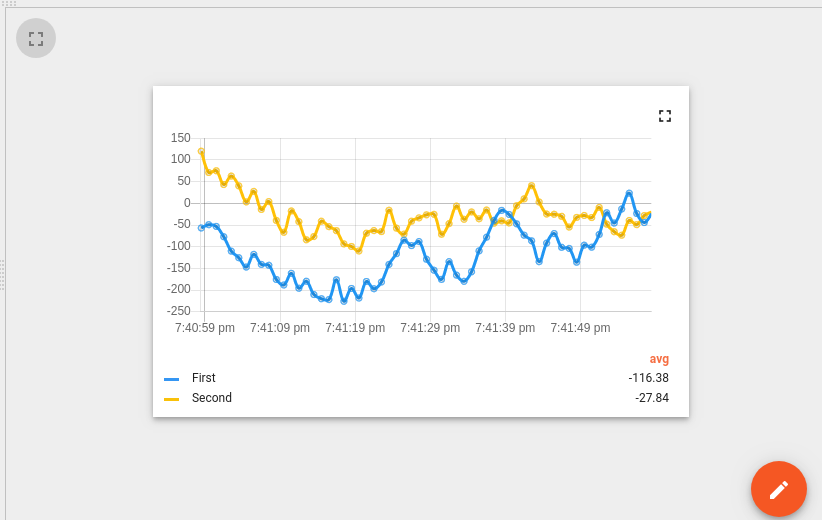
In this example, the external JS library API was used, which becomes available after injecting the corresponding URL in Resources section. Initially chart datasets prepared using configured dataKeys from data property of ctx. In the onDataUpdated function datasources data converted to Chart.js line chart format and pushed to chart datasets. Please note that xAxis (time axis) is limited to current timewindow bounds obtained from timeWindow property of ctx.
Using existing JavaScript code
Another approach of creating widgets is to use existing bundled JavaScript code. In this case, you can create your own TypeScript class or Angular component and bundle it into the ThingsBoard UI code. In order to make this code accessible within the widget, you need to register corresponding Angular module or inject TypeScript class to a global variable (for ex. window object). Some of the ThingsBoard widgets already use this approach. Take a look at the polyfills.ts or widget-components.module.ts. Here you can find how some bundled classes or components are registered for later use in ThingsBoard widgets. For example “Timeseries - Flot” widget (from “Charts” Widgets Bundle) uses TbFlot TypeScript class which is injected as window property inside polyfills.ts:
1
2
3
4
5
6
7
8
...

import { TbFlot } from '@home/components/widget/lib/flot-widget';
...

    (window as any).TbFlot = TbFlot;
...
Another example is “Timeseries table” widget (from “Cards” Widgets Bundle) that uses Angular component tb-timeseries-table-widget which is registered as dependency of WidgetComponentsModule Angular module inside widget-components.module.ts. Thereby this component becomes available for use inside the widget template HTML.
1
2
3
4
5
6
7
8
9
10
11
12
13
14
15
16
17
18
19
20
21
22
...

import { TimeseriesTableWidgetComponent } from '@home/components/widget/lib/timeseries-table-widget.component';

...

@NgModule({
  declarations:
    [
...
      TimeseriesTableWidgetComponent,
...
    ],
...
  exports: [
...
      TimeseriesTableWidgetComponent,
...
  ],
...
})
export class WidgetComponentsModule { }