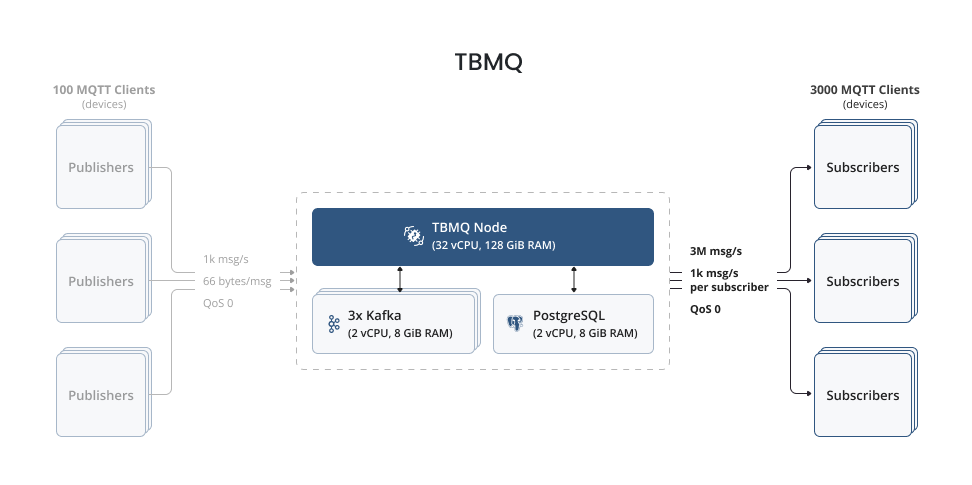
In the context of MQTT brokers, optimal performance during high workloads is of utmost importance. This article explores a recent performance test of TBMQ, where we checked its ability to handle an impressive throughput of 3 million messages per second with a single-digit milliseconds latency. With only one node, we pushed the limits of TBMQ’s capabilities.

Test methodology
We established a performance test environment by deploying a single TBMQ node within an EKS cluster alongside 3 Kafka nodes and an RDS instance. This setup served as the foundation for our performance test.
In this test, we introduced 100 publishers, each responsible for publishing 10 messages per second.
Importantly, each publisher published messages on its own topic, following the pattern "CountryCode/City/ID" where “ID” is the unique identifier of each publisher.
The size of a single “publish” message was approximately 66 bytes. This approach allowed us to simulate diverse data sources.
To gauge TBMQ’s ability to efficiently distribute messages, we introduced a network of 3,000 subscribers.
Each subscriber subscribed to the topic filter "CountryCode/City/#" signifying their interest in receiving all published messages from all publishers.
This broad distribution of messages put the broker’s capabilities to the test.
During the 30-minute performance test, we wanted to test if TBMQ can demonstrate its ability to consistently manage the significant message load without experiencing any performance degradation or resource exhaustion.
Hardware used
| Service Name | TBMQ | AWS RDS (PostgreSQL) | Kafka |
|---|---|---|---|
| Instance Type | m7a.8xlarge | db.m6i.large | m7a.large |
| vCPU | 32 | 2 | 2 |
| Memory (GiB) | 128 | 8 | 8 |
| Storage (GiB) | 10 | 30 | 50 |
| Network bandwidth (Gibps) | 12.5 | 12.5 | 12.5 |
Test summary
TBMQ, running on a single node, demonstrated remarkable performance by successfully processing a throughput of 3M messages per second. This significant achievement underlines the reliability of TBMQ in real-world scenarios.
Equally noteworthy is the broker’s impressive average message latency of just 7.4 milliseconds. This low latency is a testament to TBMQ’s capability to handle high loads while ensuring prompt message delivery.
| Msg latency Avg | Msg latency 95th |
|---|---|
| 7.4 ms | 11 ms |
It would be helpful to review an informative table that summarizes the key elements and results of the test.
| Publishers | Subscribers | Msg/sec | Throughput | QoS | Payload | TBMQ CPU | TBMQ Memory |
|---|---|---|---|---|---|---|---|
| 100 | 3000 | 10 | 3M msg/s | 0 | 66 bytes | 54 % | 75 GiB |
Lessons Learned
Our test highlighted the importance of optimizing TBMQ for reliability and scalability. It showed the broker’s potential to handle large message loads with ease, making it an ideal choice for scenarios where message distribution is critical.
We observed the resource management capabilities of TBMQ and its ability to maintain stability under high loads. This insight can guide users in configuring their setups for optimal performance.
Important notice: during the course of this performance test, we made experiments with various instance types.
While we settled on the AWS m7a.8xlarge instance type for TBMQ, it’s essential to highlight the noteworthy results even on the m7a.4xlarge (16 vCPUs, 64 GiB RAM) instance.
This configuration delivered an average message latency of 14.2 ms while maintaining a CPU usage of 90%.
These findings highlight the flexibility and potential of TBMQ to perform greatly across diverse instance types,
providing users with the opportunity to choose the configuration that best suits their specific requirements.
Running test
The test agent represents a cluster of performance test nodes (runners) and an orchestrator that supervises these runners. To fulfill their respective roles, we deployed 1 publisher and 6 subscriber Kubernetes pods, with a single pod designated as the orchestrator. Notably, each publisher and subscriber pod was allocated to separate AWS EC2 instances.
For a comprehensive view of the AWS EC2 instances used in our test setup, you can refer to the following image:
The test initiation involves the establishment of connections between the clients and TBMQ. Subscriber clients promptly set up their subscriptions, while publisher clients begin their warm-up phase. Once all the runners are ready, the orchestrator notifies the cluster is ready and the message publishing is started.
After a period of processing, we can evaluate the monitoring tools such as JMX, htop, and Kafka UI along with AWS CloudWatch for more comprehensive insights.
Monitoring tools show an average CPU load of approximately 54%. This finding indicates that TBMQ demonstrates substantial processing capacity, suggesting its ability to efficiently handle even more significant workloads and manage peaks in message delivery.
How to repeat the test
We recommend referring to our installation guide, which provides step-by-step instructions on how to deploy TBMQ on AWS. In addition, you may explore the branch containing the scripts and parameters used for running TBMQ during this performance test, enabling you to gain deeper insights into our configuration. For the practical execution of performance tests, we offer a dedicated performance testing tool capable of generating MQTT clients and simulating the desired message load. For configuring the performance tests, you can review and modify the configuration files for the publishers and subscribers as per your specific requirements.
Conclusion
The performance test of TBMQ, where it successfully processed 3M messages per second with an average latency of just 7.4 milliseconds, confirms again its position as a robust and scalable MQTT broker. This achievement underscores TBMQ’s readiness for handling demanding workloads, making it a reliable choice for applications that rely on efficient message distribution.
As we continue to explore TBMQ’s capabilities, we remain committed to delivering improved performance and reliability. We look forward to sharing more insights and performance results in the future.
Your feedback is highly appreciated, and we encourage you to stay connected with our project by following us on GitHub to be updated on our latest developments.


