- Test methodology
- Hardware used
- Test summary
- TCO calculations
- Running tests
- How to repeat the tests
- Conclusion
- Reference Commits
An essential attribute of the MQTT broker involves the reception of messages published by clients, their filtration based on topics, and subsequent distribution to subscribers. This procedure holds great significance, particularly when operating under substantial workloads. Within this article, we will show the steps taken to ensure that TBMQ can reliably handle about 100M connected clients while effectively managing a throughput of 6M MQTT publish messages per second.
Test methodology
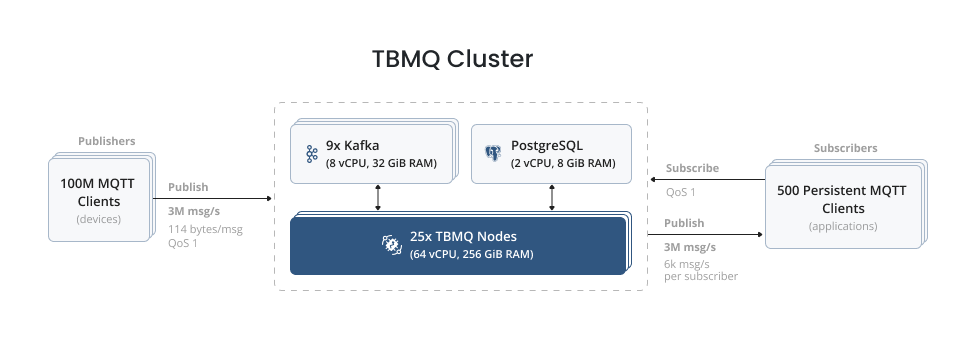
We have chosen Amazon Web Services (AWS) as the target cloud provider to conduct the performance test. We have deployed the TBMQ cluster of 25 nodes in the EKS cluster (on a single EC2 instance, or node, 1 broker pod is deployed) with the connection to RDS and Kafka. For a comprehensive understanding of TBMQ architecture, please refer to the subsequent page. RDS has been deployed as a single instance while the Kafka setup consists of 9 brokers distributed across 3 distinct Availability Zones (AZs).
Various IoT device profiles differ based on the number of messages they produce and the size of each message. We have emulated smart tracker devices that send messages with five data points. The size of a single “publish” message is approximately 114 bytes. Below you can see the emulated message structure with some differences from a real test case since the test agent generates the payload values.
1
{ "lat": 40.761894, "long": -73.970455, "speed": 55.5, "fuel": 92, "batLvl": 81 }
The publishers are organized into 500 distinct groups, resulting in a total of 200k publishers and 6k msg/s per group.
Each group is responsible for transmitting data to its designated topic pattern, which follows the format of CountryCode/RandomString/GroupId/ClientId.
Consequently, an extensive range of 100M unique topics are being utilized by the publishers.
In parallel, 500 subscriber groups have been configured, each featuring a single APPLICATION subscriber.
The topic filter employed by these subscribers corresponds to the topic pattern employed by the respective publisher group (i.e. CountryCode/RandomString/GroupId/+).
As a consequence, each subscriber is capable of receiving 6k messages per second, ensuring the efficient processing of incoming data.
In the described scenario, TBMQ cluster consistently sustains 100,000,500 connections and efficiently handles the throughput of 6M messages per second. Throughput refers to the total number of messages per second, including both incoming and outgoing messages. The processing of 3M incoming messages per second results in a total of 10,800M messages over the course of 1-hour test run.
The test agent orchestrates the provisioning and establishment of MQTT clients, allowing for flexible configuration of their count. These clients operate persistently, continuously publishing time series data over MQTT to designated topics. Furthermore, the agent facilitates the provisioning of MQTT clients that subscribe by topic filters to receive the messages published by the aforementioned clients.
Considering the warm-up phase for the clients, it is noteworthy to acknowledge that 6 iterations of publishers transmitting a single message each took place. Consequently, a total of 600M warm-up messages were generated within a span of ~7 minutes. These warm-up messages serve the purpose of preparing the system and initiating the flow of data. In addition to the warm-up phase, the overall test encompasses a grand total of 11,400M messages that were processed. This figure encapsulates both the warm-up messages and the subsequent messages generated and handled during the complete test duration.
This substantial volume of data amounts to approximately 1TB, which is stored in the initial Kafka topic labeled as tbmq.msg.all.
Each individual subscriber, being configured as an APPLICATION subscriber, has its dedicated topic within Kafka
where it receives a cumulative total of 22.8M messages for further processing and analysis.
Notably, with the configuration of 500 subscribers, the data collection process solely relies on Kafka, and Postgres is not involved.
This is because only the persistent clients categorized as APPLICATION are included in the current configuration setup.
Tip: to plan and manage the Kafka disk space, please, adjust the size retention policy and period retention policy. For detailed information regarding the configurations associated with each topic, please refer to the configuration document.
Every individual MQTT client establishes a distinct connection to the broker. This approach ensures that each client operates independently and maintains its own dedicated connection for seamless communication with the broker.
Hardware used
| Service Name | TBMQ | AWS RDS (PostgreSQL) | Kafka |
|---|---|---|---|
| Instance Type | m6g.metal | db.m6i.large | m6a.2xlarge |
| Memory (GiB) | 256 | 8 | 32 |
| vCPU | 64 | 2 | 8 |
| Storage (GiB) | 10 | 100 | 500 |
| Network bandwidth (Gibps) | 25 | 12.5 | 12.5 |
Test summary
The connection rate of the clients reached a notable level of ~22k connections per second, signifying an efficient setup. To ensure the absence of any resource leakage or performance degradation over time, the test was executed for a duration of one hour, allowing for thorough observation and analysis.
With a rate of 3M messages published per second, including warm-up messages, a total of 11,400M messages were processed throughout the test, resulting in an impressive incoming and outgoing throughput of approximately 1TB.
This substantial volume of data showcases the scalability and handling capabilities of TBMQ.
To maintain a high level of reliability and message delivery assurance, an MQTT Quality of Service (QoS) level of 1, specifically AT_LEAST_ONCE, was employed for both the publishers and subscribers.
This QoS level ensures that messages are guaranteed to be delivered at least once, ensuring data integrity and consistency.
Considering the comprehensive scope of the test, it would be advantageous to review an informative table that summarizes the key elements and outcomes of the conducted test.
| Devices | Throughput (msgs/sec) | Broker CPU | Broker Memory | Kafka CPU | Kafka Read/Write throughput | PostgreSQL CPU | PostgreSQL Read/Write IOPS |
|---|---|---|---|---|---|---|---|
| 100M | 6M | 45% | 160GiB | 58% | 7k / 80k KiB/s | 2% | less than 1 / less than 3 |
The following statistics provide insights into the Kafka topics used during the test
(i.e. publish_msg, after Kafka topics renaming [1] tbmq.msg.all,
is the main Kafka topic where all the messages are stored, and several examples of application topics for APPLICATION subscribers that receive the data).
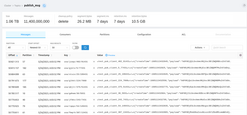


It is important to highlight that the provided information demonstrates a 100% success rate in processing all the messages.
publish_msg and application topics contain compressed data since producers are sending compressed data and Kafka brokers
retain the original compression codec set by the producers (compression.type property).
This approach ensures efficient data storage and transmission while maintaining the integrity and original compression settings of the messages.
We should now turn our attention to the matter of message processing latency. Below you can find a table containing the essential statistics, which shed light on this crucial aspect of the evaluation.
| Msg latency Avg | Msg latency 95th | Pub Ack Avg | Pub Ack 95th |
|---|---|---|---|
| 195 ms | 295 ms | 23 ms | 55 ms |
where “Msg latency Avg” represents the average duration from the moment a message is transmitted by the publisher until it is received by the subscriber,
“Pub Ack Avg” indicates the average time elapsed from the point of message transmission by the publisher to the reception of the PUBACK acknowledgment,
and 95th is the 95th percentile of the respectful latency statistics.
Lessons learned
TBMQ cluster in the current configuration contains the capacity to process an even bigger load. Kafka provides reliable and highly-available processing of messages.
In this scenario, the utilization of APPLICATION subscribers and the nature of the test resulted in minimal load on PostgreSQL, with only a few operations executed per second.
There is no direct communication between TBMQ nodes that helped scale horizontally to achieve the mentioned results.
Although employing a QoS level of 0 would further elevate the message rate, our intention was to demonstrate TBMQ’s processing capabilities with a more practical setup.
In general, a QoS level of 1 is widely favored as it strikes a balance between message delivery speed and reliability, making it a popular configuration choice.
TBMQ is a great choice for both low and high message rates.
It excels in various processing use cases, such as fan-in, p2p, and fan-out scenarios, and proves equally suitable for deployments of various scales.
Thanks to its inherent capacity for both vertical and horizontal scalability, the broker adapts to the demands of either small-scale or large-scale deployments.
Challenges faced during testing
During the pursuit of achieving such substantial levels of connections and data flow, we encountered various scenarios that demanded some effort in code optimization.
One such instance involved addressing Kafka producer disconnects, which had the undesirable consequence of message loss. To solve this issue, we implemented a distinct executor service dedicated to processing publish callbacks for Kafka producers[2]. This measure effectively resolved the aforementioned disconnections.
To further enhance performance, we eliminated the need for a specialized publishing queue[3] by leveraging the inherent thread-safe nature of Kafka producers. This adjustment yielded additional benefits in terms of overall system efficiency as the message ordering guarantees were achieved in another way.
Additional adjustments were introduced to elevate the processing rate, as evidenced by the commits related to improvements in message pack processing, UUID generation[4], and the adoption of a mechanism for sending messages without the need for explicit flushing[5].
To optimize memory utilization and minimize unnecessary garbage creation, we undertook substantial efforts to improve overall memory usage. These enhancements 6, 7, 8 not only contributed to enhanced Garbage Collector performance but also reduced stop-the-world pauses, thereby improving overall system responsiveness.
During our later testing phases on larger scales, we observed an uneven distribution of clients among the broker nodes. This resulted in a disproportionate workload for the specific broker node, which posed minimal issues for publishers but had a notable impact on APPLICATION clients, requiring more substantial resource utilization. That resulted in one broker node processing much more requests than others. To address this concern, we devised a mechanism to ensure an even distribution of clients among the broker nodes[9], alongside other minor performance improvements.
Through these diligent efforts, we successfully addressed various challenges along the way, optimizing code performance and ensuring a smooth and efficient operation of the system.
TCO calculations
Herewith you can find total cost of ownership (TCO) calculations for TBMQ deployed using AWS.
Important notice: all the calculations and pricing provided below are approximations and are intended solely for illustrative purposes. To obtain precise and accurate pricing information, it is highly recommended that you consult with your respective cloud service provider. For instance, AWS provides cost-saving opportunities such as Savings Plans (up to 72% discount), RDS Reserved Instances (up to 69%), MSK Tiered Storage (50% or more), along with a multitude of additional options.
AWS EKS cluster in the us-east-1 region. Approx. price is ~73 USD/month.
AWS Instance Type: 25 x m6g.metal instances (64 vCPUs AWS Graviton2 Processor, 256 GiB, EBS GP3 10GiB) to host 25 TBMQ nodes. Approx. price is ~23,800 USD/month.
AWS RDS: db.m6i.large (2 vCPU, 8 GiB), 100GiB storage. Approx. price is ~100 USD/month.
AWS MSK: 9 brokers (3 brokers per AZ) x m6a.2xlarge (8 vCPU, 32 GiB), 4,500GiB total storage. Approx. price is ~2,600 USD/month.
TCO: ~26,573 USD per month or 0.0003 USD per month per device.
Running tests
Load configuration:
- 100M publish MQTT clients (smart tracker devices);
- 500 persistent subscribe MQTT clients (specific applications that consume the data - e.g. for analysis/graphs);
- 6M msg/sec throughput over MQTT, each MQTT message contains 5 data points, message size is 114 bytes;
- PostgreSQL database to store MQTT client credentials, client session states;
- Kafka queue to persist messages.
The aforementioned message rate and message size, as observed previously, result in approximately ~1TB of data per hour in the initial Kafka topic, and around ~1.6GB of data per hour per subscriber topic.
However, it is not necessary to store the data for an extended period for purposes such as visualization, analysis, or others. TBMQ is responsible for receiving messages, distributing them among the subscribers, and optionally storing them temporarily for offline clients. Hence, it is advisable to configure an appropriate storage size based on your specific requirements. Additionally, as a reminder, it is crucial to configure the size retention policy and period retention policy for the Kafka topics.
The test agent represents a cluster of performance test nodes (runners) and an orchestrator that supervises these runners. To fulfill the role of runners, we have deployed 2000 publisher and 500 subscriber Kubernetes pods, while a single pod serves as the orchestrator.
By utilizing the JSON configuration, we have the capability to specify the publishers and subscribers separately, organizing them into groups for more flexible control. Let us now examine the configurations for both publishers and subscribers.
Publisher group:
1
2
3
4
5
6
{
    "id":1,
    "publishers":200000,
    "topicPrefix":"usa/ydwvv/1/",
    "clientIdPrefix":null
}
where
- id - identifier of the publisher group;
- publishers - number of publisher clients in the group;
- topicPrefix - respectively topic prefix to which publish messages;
- clientIdPrefix - client id prefix of publishers.
Subscriber group:
1
2
3
4
5
6
7
8
9
10
{
    "id":1,
    "subscribers":1,
    "topicFilter":"usa/ydwvv/1/+",
    "expectedPublisherGroups":[1],
    "persistentSessionInfo":{
        "clientType":"APPLICATION"
    },
    "clientIdPrefix":null
}
where
- id - identifier of the subscriber group;
- subscribers - number of subscriber clients in the group;
- topicFilter - respectively topic filter to subscribe to;
- expectedPublisherGroups - list of ids of publisher groups whose messages current subscribers will receive (parameter is used for debugging and statistics purposes);
- persistentSessionInfo - persistent info object containing client type;
- clientIdPrefix - client id prefix of subscribers.
Test run
The test starts by establishing connections between the clients and the cluster. APPLICATION clients subscribe to the relevant topics, while publishers undergo a warm-up phase.
The 100,000,500 clients are evenly distributed among the performance test pods, facilitating parallel connections to the broker.
After a period of time, all clients successfully establish connections, and each performance test pod notifies the orchestrator of its readiness.
To gauge the progress, we can examine the client_session (after Kafka topics renaming [1] tbmq.client.session)
Kafka topic. This topic provides an approximate count of the connected sessions.

Once all the runners are ready, the orchestrator notifies the cluster is ready and the message publishing is started.
1
09:12:35.407 [main] INFO  o.t.m.b.tests.MqttPerformanceTest - Start msg publishing.
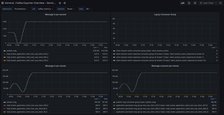
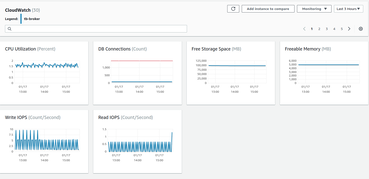
After a period of processing, we can evaluate the monitoring tools such as JMX, Grafana, and Kafka UI that were employed during the test, along with AWS CloudWatch for more comprehensive insights. Upon examination, we observe favorable outcomes. The published and consumed messages are being processed without any noticeable delays. The application processors efficiently deliver the messages to the subscribers, ensuring a smooth and uninterrupted flow. Additionally, all 100,000,500 clients maintain stable connections with the broker.
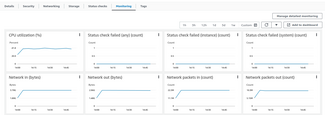
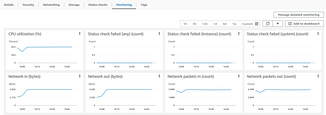
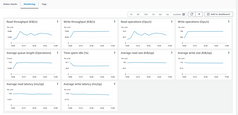
AWS instance (where TBMQ nodes are deployed) monitoring shows about 45% average CPU load. The AWS RDS resources, on the other hand, are not utilized as there are no DEVICE persistent clients and only a few requests per second are sent. Meanwhile, the Kafka monitoring indicates that there are more resources available, suggesting that it can handle even higher loads if necessary.
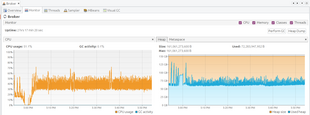
Lastly, let us examine the JVM state of TBMQ. To accomplish this, we must forward the JMX port to establish a connection and monitor the Java applications.
1
kubectl port-forward tb-broker-0 9999:9999
To proceed, please open VisualVM and add the local application. Once added, open it and allow the data to be collected for a few minutes. Here is the JMX monitoring for TBMQ. The broker nodes are operating steadily and without any notable issues.
How to repeat the tests
Please refer to the subsequent installation guide to learn how to deploy TBMQ on AWS. In addition, you may explore the branch containing the scripts and parameters employed for running TBMQ during this performance test. Lastly, the performance tests tool available for conducting performance tests, which generates MQTT clients and produces the load. For configuring the performance tests, you can review and modify the configuration files for the publishers and subscribers to simulate the desired load.
Conclusion
This performance test demonstrates the capabilities of TBMQ cluster in efficiently processing the throughput of 6M messages per second originating from diverse devices along with handling 100M concurrent connections. Our commitment to continuous improvement compels us to undertake further efforts aimed at enhancing performance. As a result, we anticipate publishing updated performance results for TBMQ cluster in the near future. We sincerely hope that this article be valuable to individuals evaluating TBMQ and those seeking to conduct performance tests within their own environments.
Your feedback is highly appreciated, and we encourage you to stay connected with our project by following us on GitHub and Twitter.
Reference Commits
[1] - Kafka topics renaming.
[2] - Kafka producer callbacks.
[3] - Stop adding publish messages to queue.
[4] - Msg pack processing, UUID generation improvements.
[5] - Send messages without flush.
[6] - ClientSessionInfo object reuse.
[7] - Remove application publish msg copies.
[8] - Bytebuf in publish msg.
