- Troubleshooting instruments and tips
- Logs
- Metrics
- Prometheus metrics
- Edge randomly disconnects from Cloud
- Monitoring message statistics
- Getting help
Troubleshooting instruments and tips
MessagePack Processing Log
To enable logging for the slowest and most frequently called rule nodes, update your logging configuration with the following logger:
1
<logger name="org.thingsboard.server.service.queue.TbMsgPackProcessingContext" level="DEBUG" />
After this, you can find the following messages in your logs:
1
2
3
4
5
6
7
8
9
2021-03-24 17:01:21,023 [tb-rule-engine-consumer-24-thread-3] DEBUG o.t.s.s.q.TbMsgPackProcessingContext - Top Rule Nodes by max execution time:
2021-03-24 17:01:21,024 [tb-rule-engine-consumer-24-thread-3] DEBUG o.t.s.s.q.TbMsgPackProcessingContext - [Main][3f740670-8cc0-11eb-bcd9-d343878c0c7f] max execution time: 1102. [RuleChain: Thermostat|RuleNode: Device Profile Node(3f740670-8cc0-11eb-bcd9-d343878c0c7f)]
2021-03-24 17:01:21,024 [tb-rule-engine-consumer-24-thread-3] DEBUG o.t.s.s.q.TbMsgPackProcessingContext - [Main][3f6debf0-8cc0-11eb-bcd9-d343878c0c7f] max execution time: 1. [RuleChain: Thermostat|RuleNode: Message Type Switch(3f6debf0-8cc0-11eb-bcd9-d343878c0c7f)]
2021-03-24 17:01:21,024 [tb-rule-engine-consumer-24-thread-3] INFO  o.t.s.s.q.TbMsgPackProcessingContext - Top Rule Nodes by avg execution time:
2021-03-24 17:01:21,024 [tb-rule-engine-consumer-24-thread-3] INFO  o.t.s.s.q.TbMsgPackProcessingContext - [Main][3f740670-8cc0-11eb-bcd9-d343878c0c7f] avg execution time: 604.0. [RuleChain: Thermostat|RuleNode: Device Profile Node(3f740670-8cc0-11eb-bcd9-d343878c0c7f)]
2021-03-24 17:01:21,025 [tb-rule-engine-consumer-24-thread-3] INFO  o.t.s.s.q.TbMsgPackProcessingContext - [Main][3f6debf0-8cc0-11eb-bcd9-d343878c0c7f] avg execution time: 1.0. [RuleChain: Thermostat|RuleNode: Message Type Switch(3f6debf0-8cc0-11eb-bcd9-d343878c0c7f)]
2021-03-24 17:01:21,025 [tb-rule-engine-consumer-24-thread-3] INFO  o.t.s.s.q.TbMsgPackProcessingContext - Top Rule Nodes by execution count:
2021-03-24 17:01:21,025 [tb-rule-engine-consumer-24-thread-3] INFO  o.t.s.s.q.TbMsgPackProcessingContext - [Main][3f740670-8cc0-11eb-bcd9-d343878c0c7f] execution count: 2. [RuleChain: Thermostat|RuleNode: Device Profile Node(3f740670-8cc0-11eb-bcd9-d343878c0c7f)]
2021-03-24 17:01:21,028 [tb-rule-engine-consumer-24-thread-3] INFO  o.t.s.s.q.TbMsgPackProcessingContext - [Main][3f6debf0-8cc0-11eb-bcd9-d343878c0c7f] execution count: 1. [RuleChain: Thermostat|RuleNode: Message Type Switch(3f6debf0-8cc0-11eb-bcd9-d343878c0c7f)]
Logs
Read logs
Regardless of the deployment type, ThingsBoard Edge logs are stored in the following directory:
1
/var/log/tb-edge
Different deployment tools provide different ways to view logs:
View last logs in runtime: You can use grep command to show only the output with desired string in it. For example, you can use the following command in order to check if there are any errors on the service side: |
View last logs in runtime: If you still rely on Docker Compose as docker-compose (with a hyphen) execute next command: docker-compose logs -f tb-edge You can use grep command to show only the output with desired string in it. For example, you can use the following command in order to check if there are any errors on the backend side: If you still rely on Docker Compose as docker-compose (with a hyphen) execute next command: docker-compose logs tb-edge | grep ERROR Tip: you can redirect logs to file and then analyze with any text editor: If you still rely on Docker Compose as docker-compose (with a hyphen) execute next command: docker-compose logs -f tb-edge > tb-edge.log Note: you can always log into the ThingsBoard Edge container and view logs there: |
Enable specific logs
ThingsBoard provides the ability to enable/disable logging for specific parts of the system, depending on the information you need for troubleshooting.
You can do this by modifying the logback.xml file. Like the logs themselves, the file is stored in the following directory:
1
/usr/share/tb-edge/conf
Here’s an example of the logback.xml configuration:
1
2
3
4
5
6
7
8
9
10
11
12
13
14
15
16
17
18
19
20
21
22
23
24
25
26
<!DOCTYPE configuration>
<configuration scan="true" scanPeriod="10 seconds">

    <appender name="fileLogAppender"
              class="ch.qos.logback.core.rolling.RollingFileAppender">
        <file>/var/log/tb-edge/tb-edge.log</file>
        <rollingPolicy
                class="ch.qos.logback.core.rolling.SizeAndTimeBasedRollingPolicy">
            <fileNamePattern>/var/log/tb-edge/tb-edge.%d{yyyy-MM-dd}.%i.log</fileNamePattern>
            <maxFileSize>100MB</maxFileSize>
            <maxHistory>30</maxHistory>
            <totalSizeCap>3GB</totalSizeCap>
        </rollingPolicy>
        <encoder>
            <pattern>%d{ISO8601} [%thread] %-5level %logger{36} - %msg%n</pattern>
        </encoder>
    </appender>

    <logger name="org.thingsboard.server" level="INFO" />
    <logger name="org.thingsboard.js.api" level="TRACE" />
    <logger name="com.microsoft.azure.servicebus.primitives.CoreMessageReceiver" level="OFF" />

    <root level="INFO">
        <appender-ref ref="fileLogAppender"/>
    </root>
</configuration>
The most useful for the troubleshooting parts of the config files are loggers. They allow you to enable/disable logging for a specific class or group of classes.
In the example above, the default logging level is set to INFO (meaning that logs will contain only general information, warnings and errors).
However, for the org.thingsboard.js.api package we enabled the most detailed level of logging by setting it to TRACE.
It’s also possible to completely disable logging for certain parts of the system.
In the example above, we did this to the com.microsoft.azure.servicebus.primitives.CoreMessageReceiver class by setting the log-level to OFF.
To enable/disable logging for a specific part of the system, you need to add the appropriate </logger> configuration, and wait up to 10 seconds.
Different deployment tools provide different ways to update logs:
For standalone deployment you need to update |
For docker-compose deployment we are mapping |
Metrics
You can enable Prometheus metrics by setting the following environment variables in the configuration file:
- set
METRICS_ENABLEDtotrue - set
METRICS_ENDPOINTS_EXPOSEtoprometheus
These metrics are exposed at the path: https://<yourhostname>/actuator/prometheus which can be scraped by prometheus (no authentication is required).
Prometheus metrics
Some internal state metrics can be exposed by the Spring Boot Actuator using Prometheus.
Here is the list of stats that ThingsBoard pushes to Prometheus:
tb-edge metrics:
- attributes_queue_${index_of_queue} (statsNames - totalMsgs, failedMsgs, successfulMsgs): The stats that represent attribute writes to the database.
Note that several queues (threads) are used to persist attributes for maximum performance. - ruleEngine_${name_of_queue} (statsNames - totalMsgs, failedMsgs, successfulMsgs, tmpFailed, failedIterations, successfulIterations, timeoutMsgs, tmpTimeout):
The stats that represent message processing in the Rule Engine. They are persisted for each queue (e.g. Main, HighPriority, SequentialByOriginator etc).
Descriptions of some metrics:
- tmpFailed: The number of messages that failed and got reprocessed later.
- tmpTimeout: The number of messages that timed out and got reprocessed later.
- timeoutMsgs: The number of messages that timed out and were discarded.
- failedIterations: The iterations of processing message packs where at least one message wasn’t processed successfully.
- ruleEngine_${name_of_queue}_seconds (for each present tenantId): The stats that represent the time it took to process messages in different queues.
- core (statsNames - totalMsgs, toDevRpc, coreNfs, sessionEvents, subInfo, subToAttr, subToRpc, deviceState, getAttr, claimDevice, subMsgs):
The stats that represent the processing of internal system messages.
Descriptions of some metrics:
- toDevRpc: The number of processed RPC responses from Transport services.
- sessionEvents: The number of session events from Transport services.
- subInfo: The number of subscription infos from Transport services.
- subToAttr: The number of subscribes to attribute updates from Transport services.
- subToRpc: The number of subscribes to RPC from Transport services.
- getAttr: The number of ‘get attributes’ requests from Transport services.
- claimDevice: The number of device claims from Transport services.
- deviceState: The number of processed changes to Device State.
- subMsgs: The number of processed subscriptions.
- coreNfs: The number of processed specific ‘system’ messages.
- jsInvoke (statsNames - requests, responses, failures): The stats that represent the number of total, successful and failed requests to the JS executors.
- attributes_cache (results - hit, miss): The stats that represent the number of attribute requests that went to the cache.
transport metrics:
- transport (statsNames - totalMsgs, failedMsgs, successfulMsgs): The stats that represent the number of requests received by Transport from Core.
- ruleEngine_producer (statsNames - totalMsgs, failedMsgs, successfulMsgs): The stats that represent the number of messages pushed from Transport to the Rule Engine.
- core_producer< (statsNames - totalMsgs, failedMsgs, successfulMsgs): The stats that represent the number of messages pushed from Transport to the ThingsBoard node device actor.
- transport_producer (statsNames - totalMsgs, failedMsgs, successfulMsgs): The stats that represent the number of requests from Transport to the Core.
PostgreSQL-specific metrics:
- ts_latest_queue_${index_of_queue} (statsNames - totalMsgs, failedMsgs, successfulMsgs): The stats that represent the latest telemetry writes to the database.
Note that multiple queues (threads) are used to ensure maximum performance. - ts_queue_${index_of_queue}(statsNames - totalMsgs, failedMsgs, successfulMsgs): The stats that represent the telemetry writes to the database.
Note that multiple queues (threads) are used to ensure maximum performance.
Edge randomly disconnects from Cloud
If an Edge instance repeatedly disconnects without an obvious reason but reconnects to the cloud within a few seconds, the most likely cause is unstable network connectivity between the Edge and the Cloud. This may happen due to very low bandwidth or intermittent packet loss on the network.
One option is to diagnose your network using external tools and resolve any identified issues.
If that is not possible, you can adjust the gRPC connection parameters between Edge and Cloud by increasing certain timeouts. This helps reduce unexpected disconnects during temporary network disruptions.
On the ThingsBoard Server (Cloud):
-
EDGES_RPC_CLIENT_MAX_KEEP_ALIVE_TIME_SEC: A minimum allowed interval between client keepalive pings. This prevents clients from sending pings too frequently, which can be a nuisance to the server. Potentially, this could be a denial-of-service attack vector if abused. If a client sends pings more frequently than this interval, the server can terminate the connection. 1 second by default.
-
EDGES_RPC_KEEP_ALIVE_TIME_SEC: The time of inactivity (no read operations on the connection) after which the server sends a keepalive ping to the client. This is used to ensure that the connection is still alive and to prevent network intermediaries from dropping connections due to inactivity. It’s a way for the server to proactively check if the client is still responsive. 10 seconds by default.
-
EDGES_RPC_KEEP_ALIVE_TIMEOUT_SEC: The maximum amount of time that the server waits for a response to its keepalive ping. If the ping is not acknowledged within this time frame, the server considers the connection dead and may close it. This timeout helps detect unresponsive clients.
5 seconds by default.
Read more about Edge parameters for Cloud here
On the ThingsBoard Edge (gRPC client):
-
CLOUD_RPC_KEEP_ALIVE_TIME_SEC: The amount of time in seconds that the client waits in an idle state (with no read operations on the connection) before sending a keepalive ping to the server. This setting is crucial for ensuring that the connection remains alive during periods of inactivity and helps prevent the server from closing the connection due to a timeout. It’s used to probe the server periodically to check if it is still responsive and maintain the connection through potential network devices that might drop inactive connections (like NATs and load balancers). 10 seconds by default.
-
CLOUD_RPC_KEEP_ALIVE_TIMEOUT_SEC: Specifies how long the client will wait for a response to its keepalive ping. If the ping isn’t acknowledged within this timeframe, the client assumes that the connection is dead or unreachable. This timeout is essential for detecting when the server side might have issues or when there might be network failures preventing communication. If the server does not respond to a keepalive ping within this period, the client will consider the connection as lost and may attempt to reconnect or take other recovery actions. 5 seconds by default.
Read more about Cloud configuration for Edge here
WARNING:
gRPC advises against enabling keepalive without calls and recommends that clients avoid configuring their keepalive much below one minute.
Scale‑safe starting points:
- Do not reduce timeouts on unreliable networks: If you see ping‑ack timeouts in the logs, increase the
*_KEEP_ALIVE_TIMEOUT_SEC - Keep the client interval ≥ server’s minimum: Raise this server guardrail if you want to intentionally block overly chatty clients, and then coordinate the necessary client changes.
- Keep the interval < the shortest NAT/LB idle timeout on the path so the flow never goes idle (e.g., if the middlebox drops after 60 s, use 25–55 s intervals)
How to apply
ServerStop the currently running ThingsBoard container before making any changes. Then, edit the docker compose file: Add the following lines to the “environment” block in the YAML file: EdgeStop the currently running. TB Edge container before making any changes. Then, edit the docker compose file: Add the following lines to the “environment” block in the YAML file: Once all the changes have been made, start the ThingsBoard and TB Edge docker containers. |
ServerEdit the ThingsBoard configuration file: Add the following lines to the configuration file: EdgeThen, edit the ThingsBoard Edge configuration file: Add the following lines to the configuration file: Once all the changes have been made, restart the ThingsBoard and TB Edge services. |
Monitoring message statistics
| Available since TB Edge version 4.2 |
To diagnose and resolve issues with message delivery between the Cloud and Edge, you can monitor the state of uplink (Edge → Cloud) and downlink (Cloud → Edge) message flows.
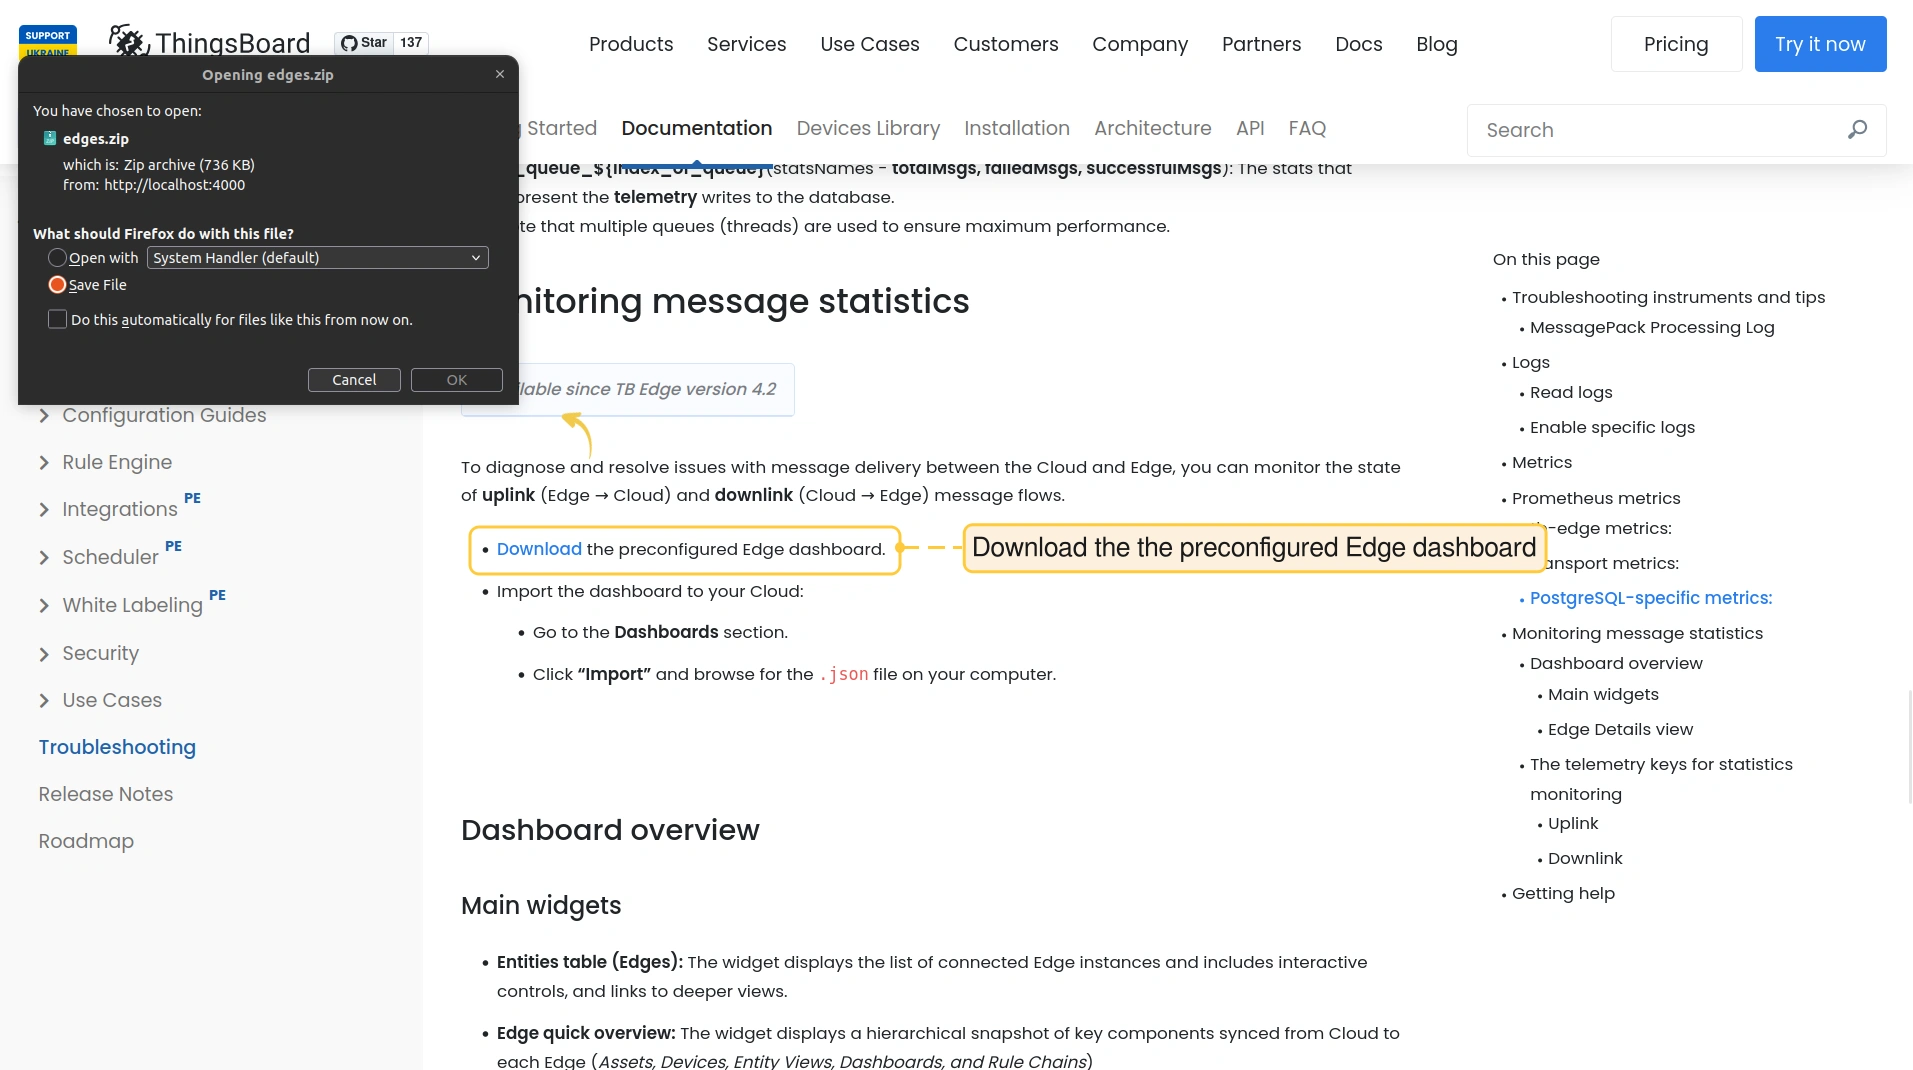
- Download the preconfigured Edge dashboard.
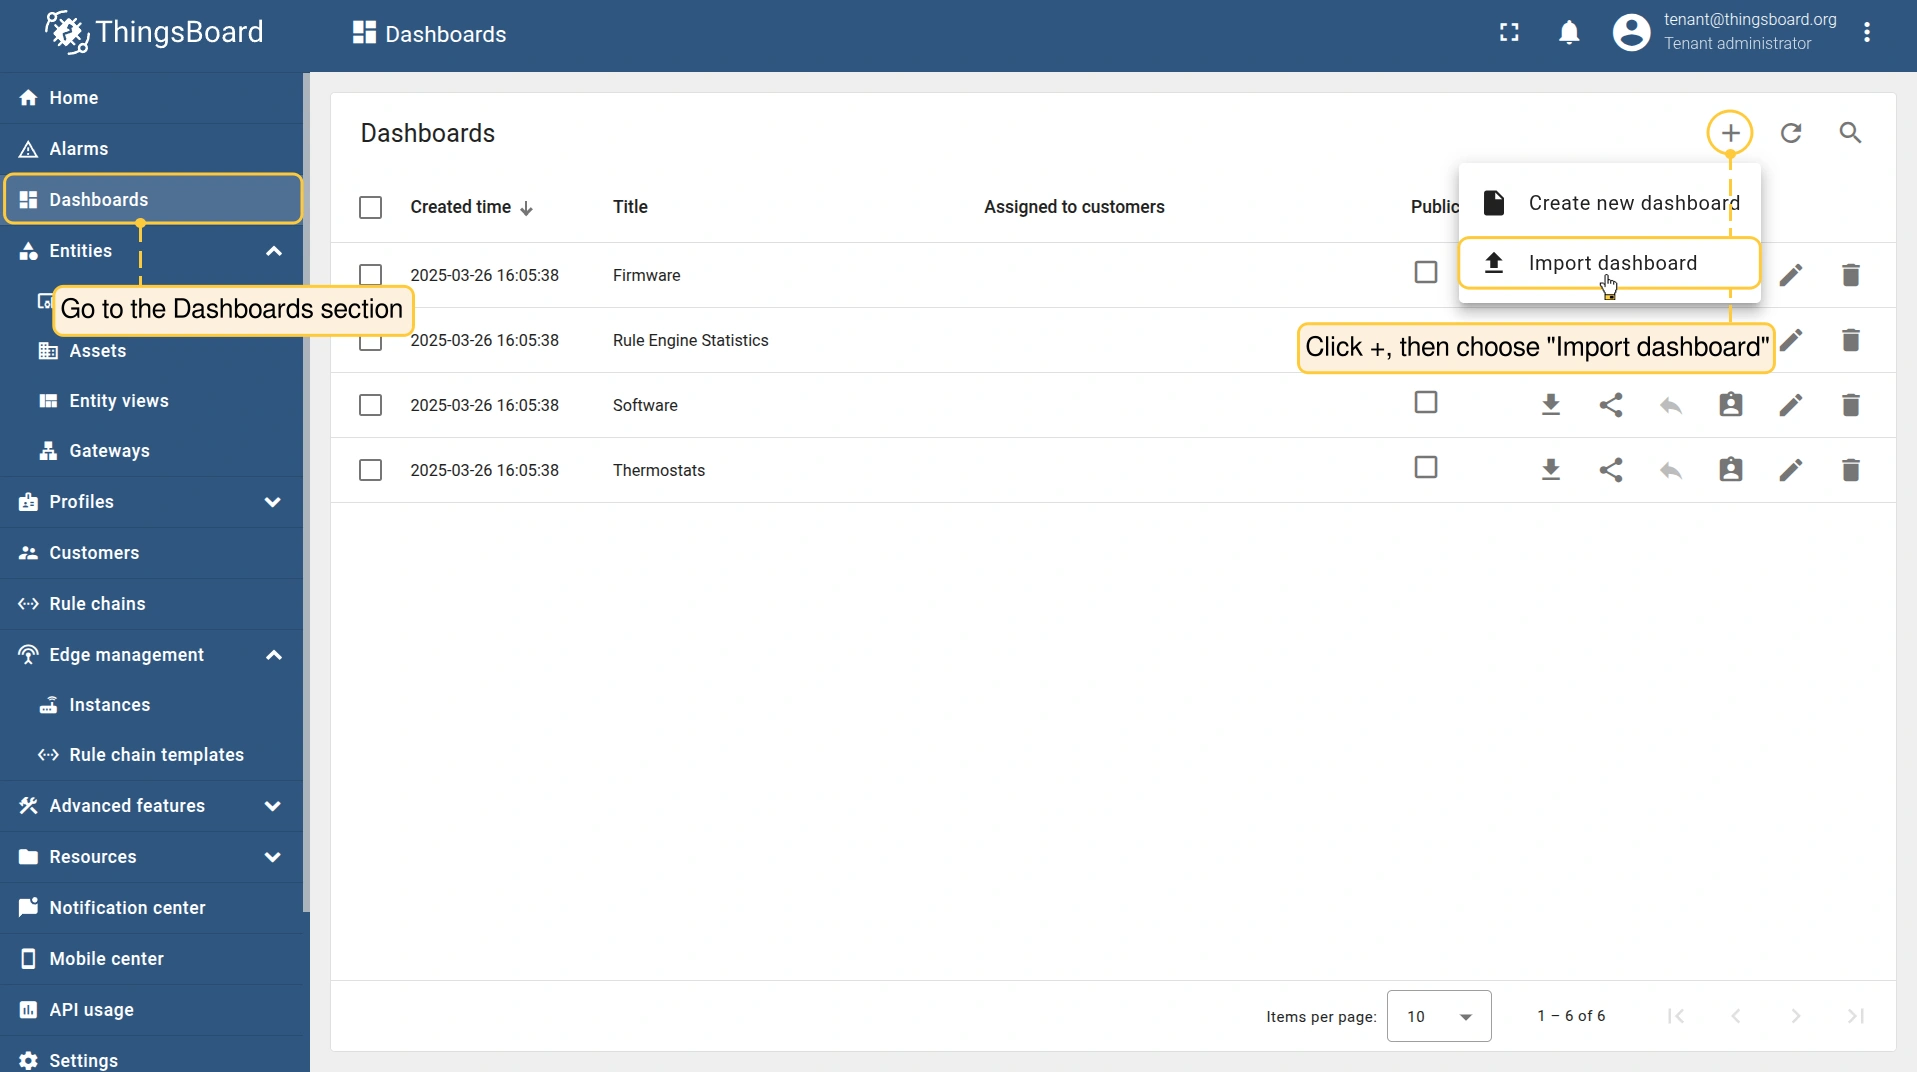
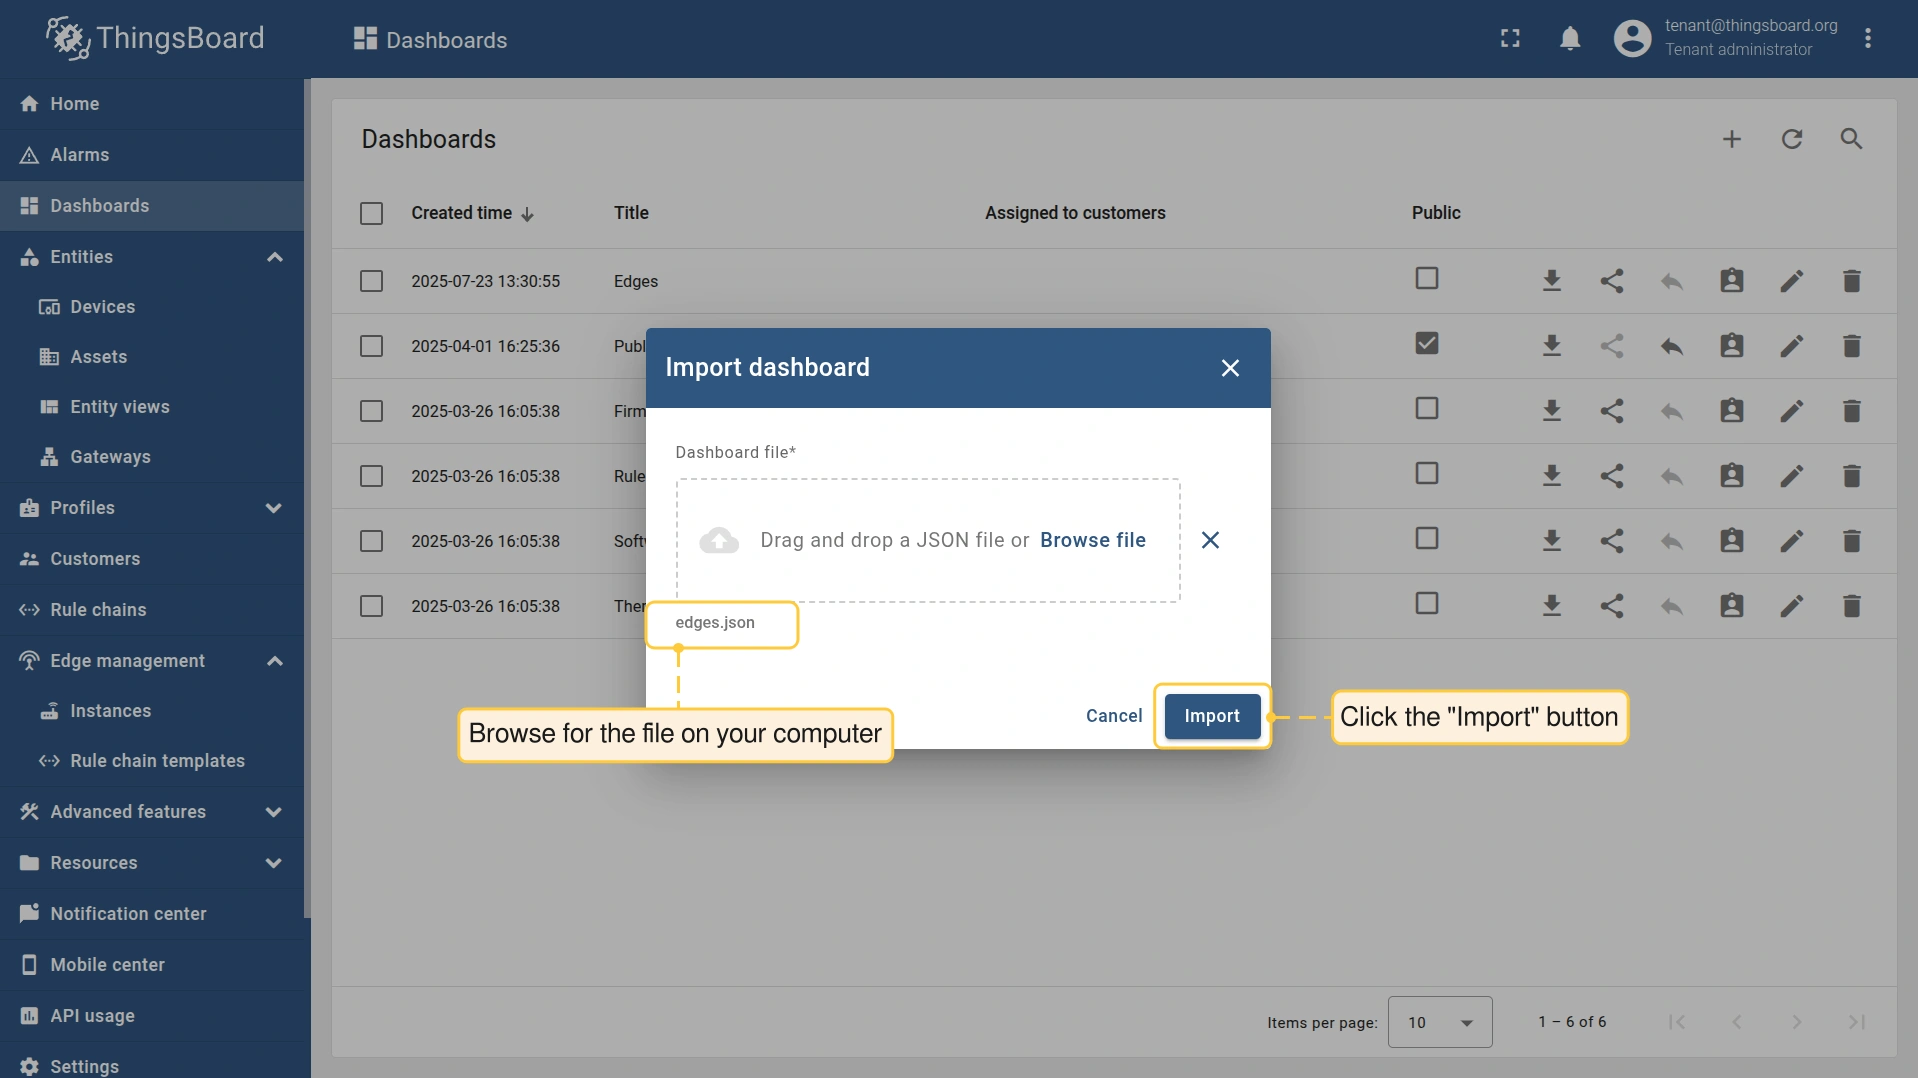
- Import the dashboard to your Cloud:
- Go to the Dashboards section.
- Click the ”+” button, select the “Import dashboard” option and browse for the
.jsonfile on your computer. Click the “Import” button to proceed.
The telemetry keys for statistics monitoring
ThingsBoard Edge exposes a set of telemetry keys that allow you to monitor message statistics between Edge and Cloud.
Uplink
- uplinkMsgsAdded: The number of messages added to the queue.
- uplinkMsgsPushed: The number of messages successfully sent to the Cloud.
- uplinkMsgsPermanentlyFailed: The number of permanently failed messages.
- uplinkMsgsTmpFailed: The number of temporarily failed messages (e.g., due to network issues).
- uplinkMsgsLag: The number of messages remaining in the queue (lag).
Downlink
- downlinkMsgsAdded: The number of messages added to the queue.
- downlinkMsgsPushed: The number of messages successfully sent to the Cloud.
- downlinkMsgsPermanentlyFailed: The number of permanently failed messages.
- downlinkMsgsTmpFailed: The number of temporarily failed messages (e.g., due to network issues).
- downlinkMsgsLag: The number of messages remaining in the queue (lag).
Getting help
If your problem isn’t answered by any of the guides above, feel free to contact ThingsBoard team.